| Param | Original file | Final file |
|---|---|---|
| Filename | modeM0/AS1A02_071T01_9000001078_07875cztM0_level2.evt | modeM0/AS1A02_071T01_9000001078_07875cztM0_level2_quad_clean.evt |
| Size (bytes) | 417,977,280 | 73,739,520 |
| Size | 398.6 MB | 70.3 MB |
| Events in quadrant A | 3,010,342 | 455,153 |
| Events in quadrant B | 2,717,790 | 474,999 |
| Events in quadrant C | 3,900,897 | 461,394 |
| Events in quadrant D | 2,642,369 | 443,026 |
| Mode SS | |||
|---|---|---|---|
| Quadrant | BADHDUFLAG | Total packets | Discarded packets |
| A | 0 | 118 | 0 |
| B | 0 | 118 | 0 |
| C | 0 | 118 | 0 |
| D | 0 | 118 | 0 |
| Mode M0 | |||
|---|---|---|---|
| Quadrant | BADHDUFLAG | Total packets | Discarded packets |
| A | 0 | 12783 | 2 |
| B | 0 | 11881 | 1 |
| C | 0 | 15723 | 1 |
| D | 0 | 11851 | 1 |
| Mode M9 | |||
|---|---|---|---|
| Quadrant | BADHDUFLAG | Total packets | Discarded packets |
| A | 0 | 11 | 0 |
| B | 0 | 11 | 0 |
| C | 0 | 11 | 0 |
| D | 0 | 11 | 0 |
| Quadrant | Total seconds | Saturated seconds | Saturation percentage |
|---|---|---|---|
| A | 5689 | 57 | 1.001934% |
| B | 5689 | 42 | 0.738267% |
| C | 5689 | 61 | 1.072245% |
| D | 5689 | 22 | 0.386711% |
Noise dominated data is calculated using 1-second bins in cleaned event files. If a bin has >2000 counts, and if more than 50% of those come from <1% of pixels, then it is considered to be noise-dominated and hence unusable.
| Quadrant | # 1 sec bins | Bins with >0 counts | Bins with >2000 counts | High rate bins dominated by noise | Noise dominated (total time) | Noise dominated (detector-on time) | Marked lightcurve |
|---|---|---|---|---|---|---|---|
| A | 6849 | 5690 | 14 | 14 | 0.20% | 0.25% | 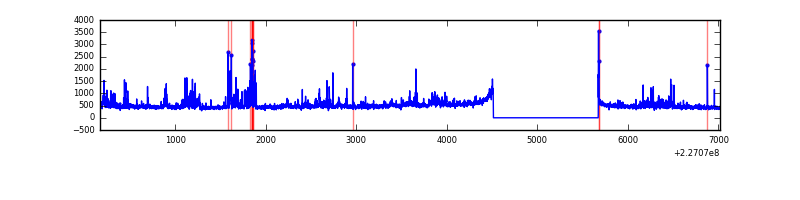 |
| B | 6849 | 5690 | 4 | 4 | 0.06% | 0.07% | 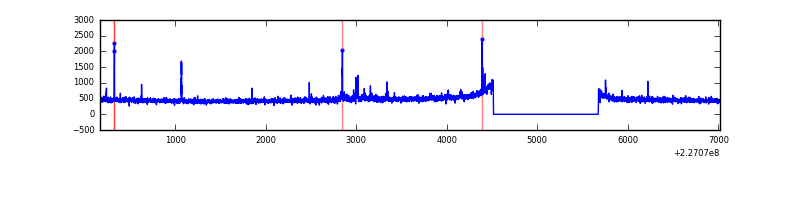 |
| C | 6849 | 5690 | 2 | 2 | 0.03% | 0.04% | 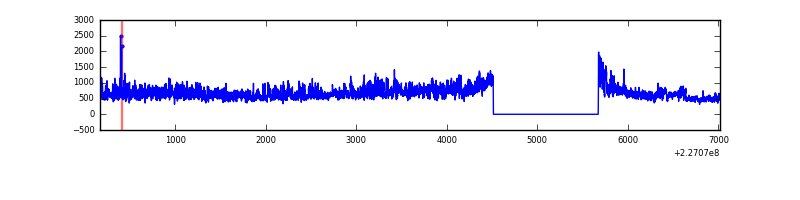 |
| D | 6849 | 5690 | 4 | 4 | 0.06% | 0.07% | 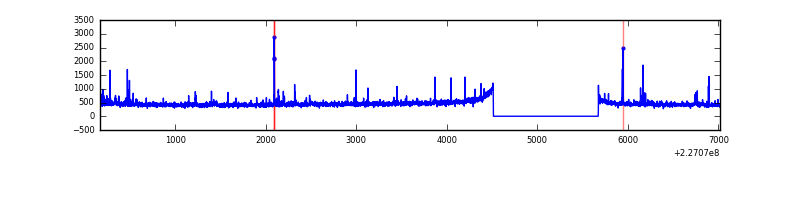 |
Top three noisy pixels from each quadrant. If the there are fewer than three noisy pixels in the level2.evt file, extra rows are filled as -1
| Pixel properties | Quadrant properties | ||||||
|---|---|---|---|---|---|---|---|
| Quadrant | DetID | PixID | Counts | Sigma | Mean | Median | Sigma |
| A | 15 | 239 | 203307 | 1492.67 | 670 | 654 | 135.8 |
| A | 2 | 79 | 197464 | 1449.64 | 670 | 654 | 135.8 |
| A | 15 | 234 | 11439 | 79.44 | 670 | 654 | 135.8 |
| B | 4 | 239 | 40082 | 305.12 | 681 | 666 | 129.2 |
| B | 12 | 111 | 12720 | 93.31 | 681 | 666 | 129.2 |
| B | 11 | 111 | 10288 | 74.48 | 681 | 666 | 129.2 |
| C | 1 | 16 | 1251480 | 8103.44 | 667 | 673 | 154.4 |
| C | 12 | 4 | 19648 | 122.93 | 667 | 673 | 154.4 |
| C | 8 | 229 | 18275 | 114.04 | 667 | 673 | 154.4 |
| D | 2 | 152 | 30263 | 182.12 | 666 | 647 | 162.6 |
| D | 14 | 34 | 27107 | 162.71 | 666 | 647 | 162.6 |
| D | 13 | 104 | 19548 | 116.23 | 666 | 647 | 162.6 |
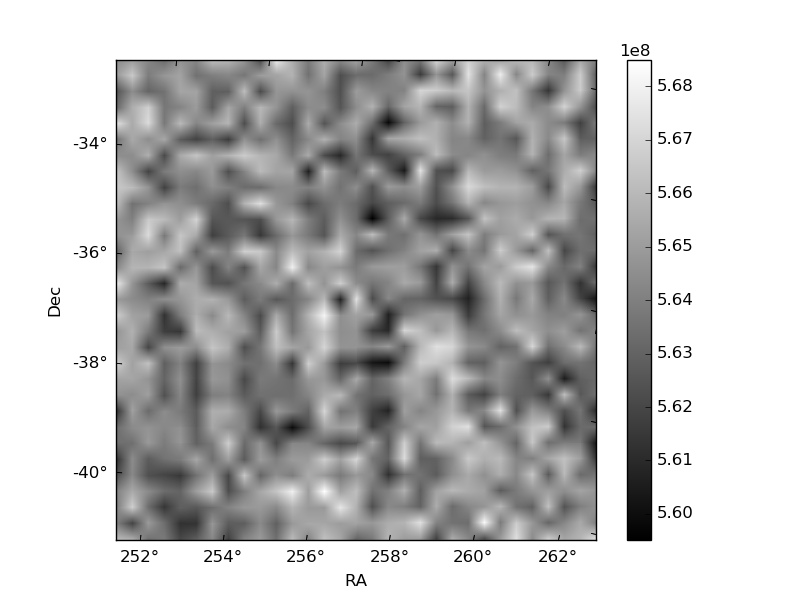
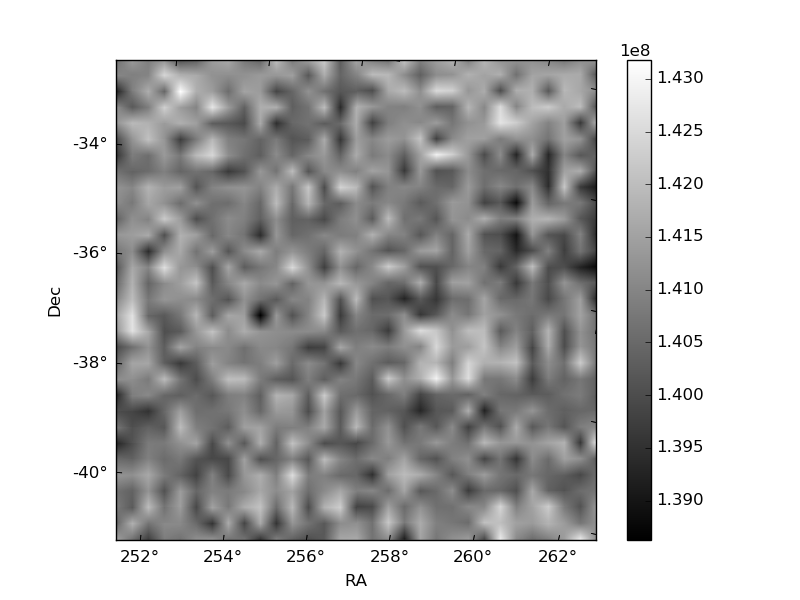
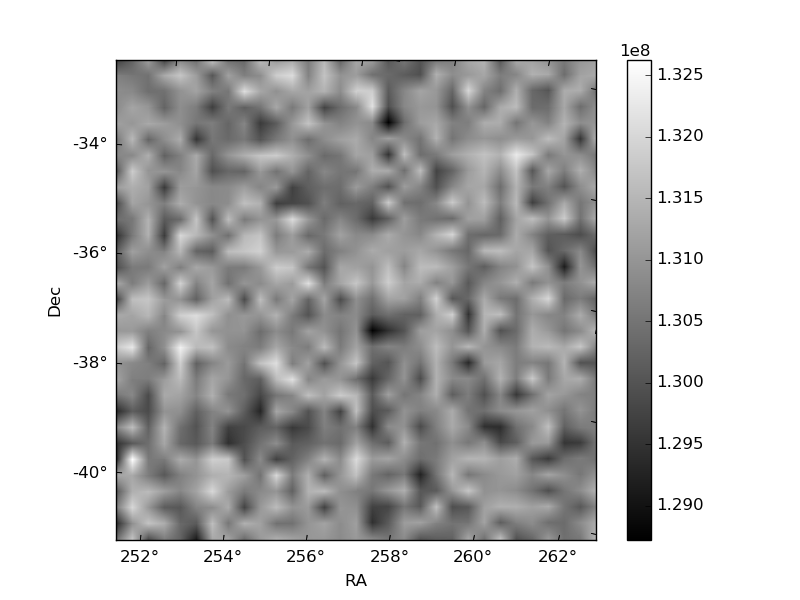
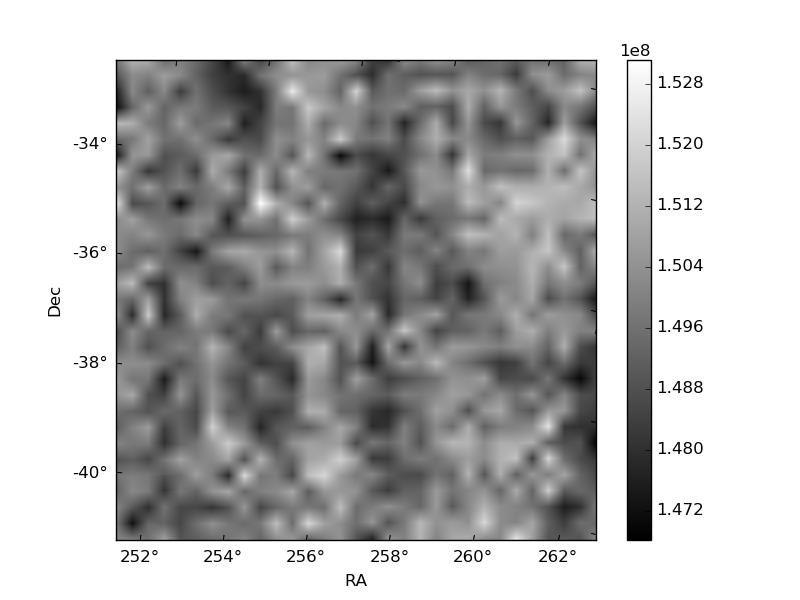
Histogram calculated using DETX and DETY for each event in the final _common_clean file
| Quadrant A | 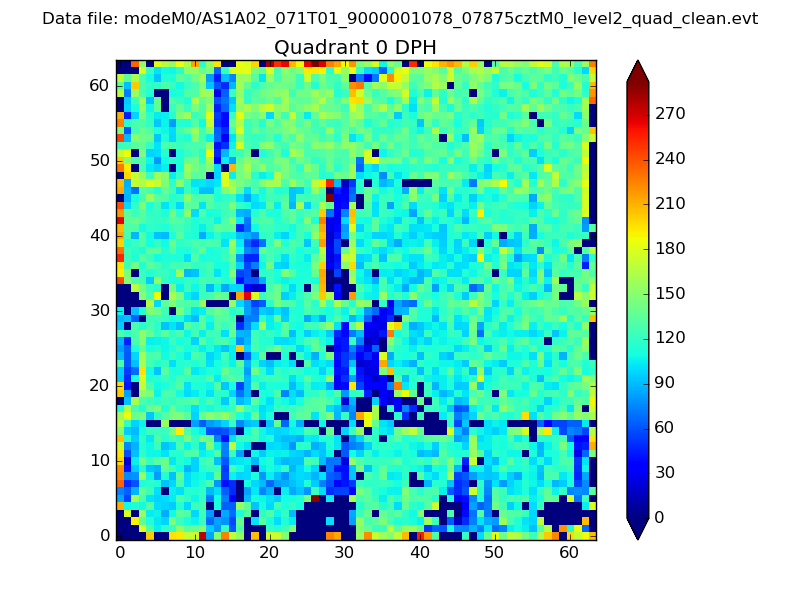 |
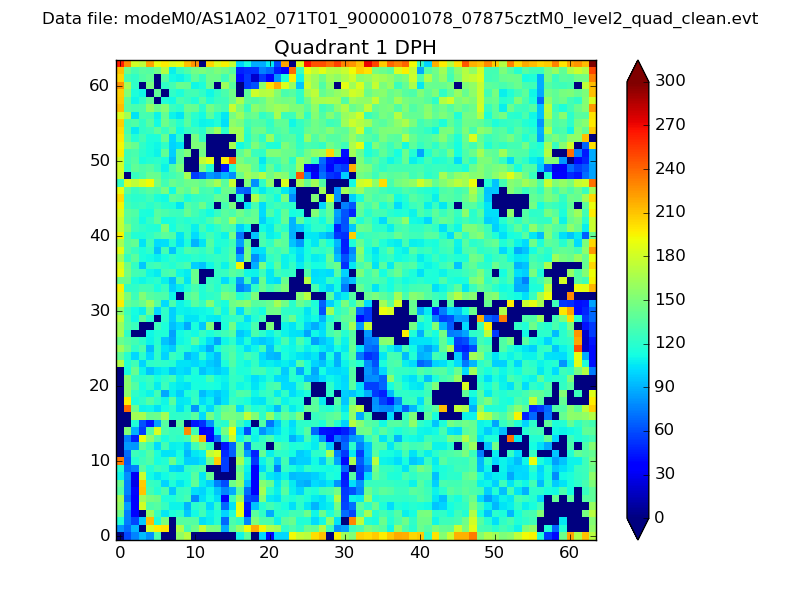 |
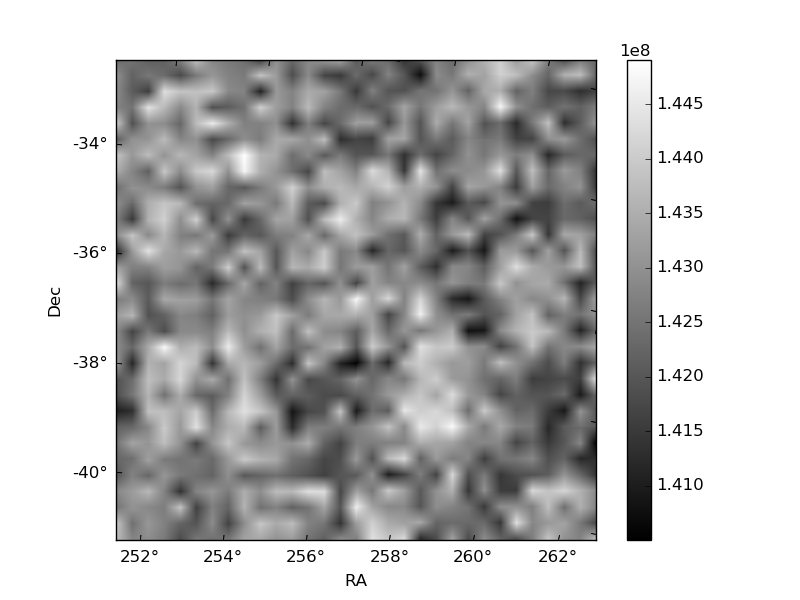
Quadrant B |
|---|---|---|---|
| Quadrant D | 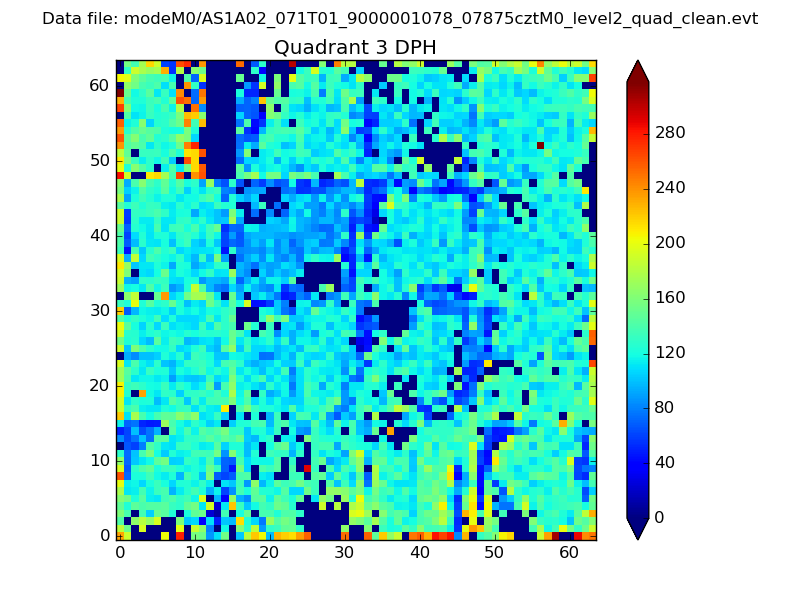 |
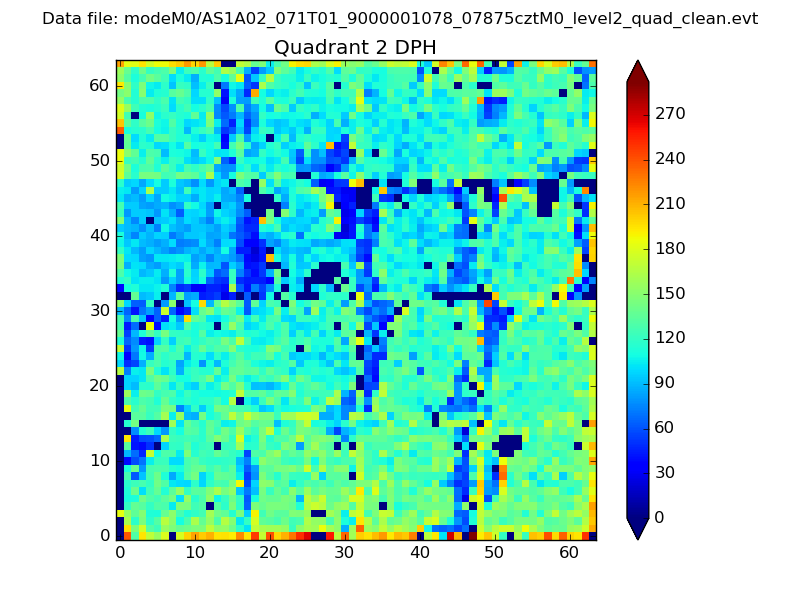 |
Quadrant C |
| Plot type | Count rate plots | Images |
|---|---|---|
| Comparison with Poisson distribution Blue bars denote a histogram of data divided into 1 sec bins. Red curve is a Poisson curve with rate = median count rate of data. |
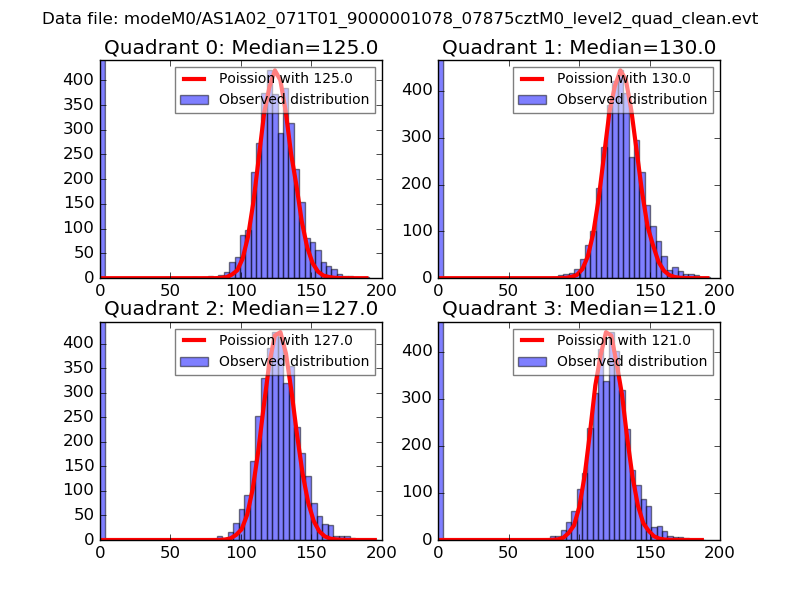 |
 |
| Quadrant-wise count rates Data is divided into 100 sec bins |
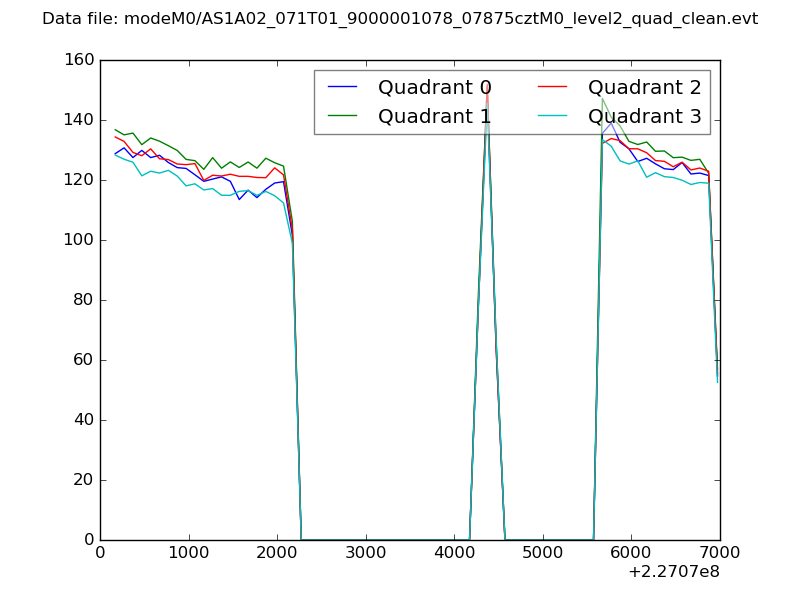 |
|
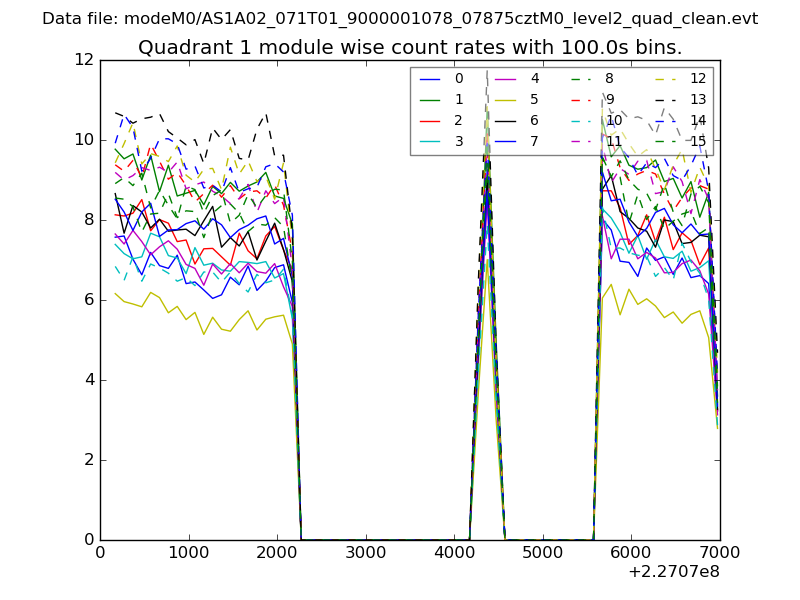
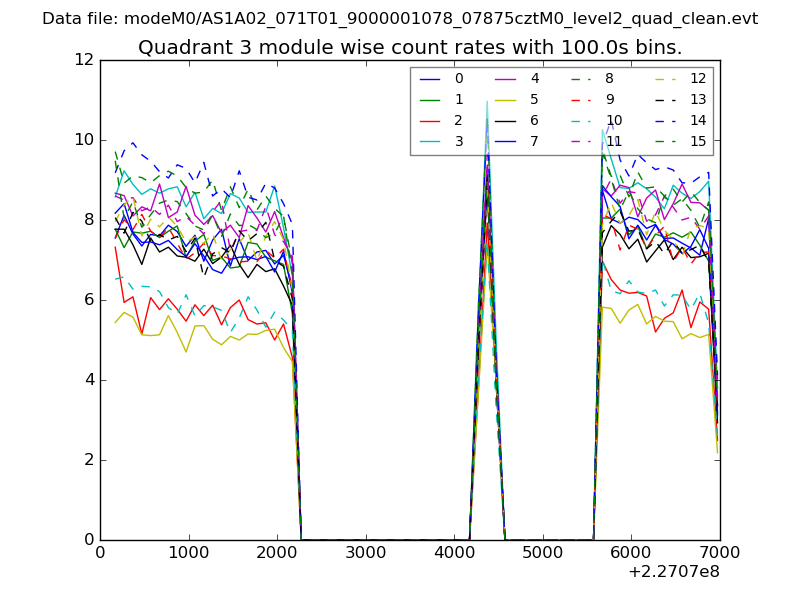
| Module-wise count rates for Quadrant A Data is divided into 100 sec bins |
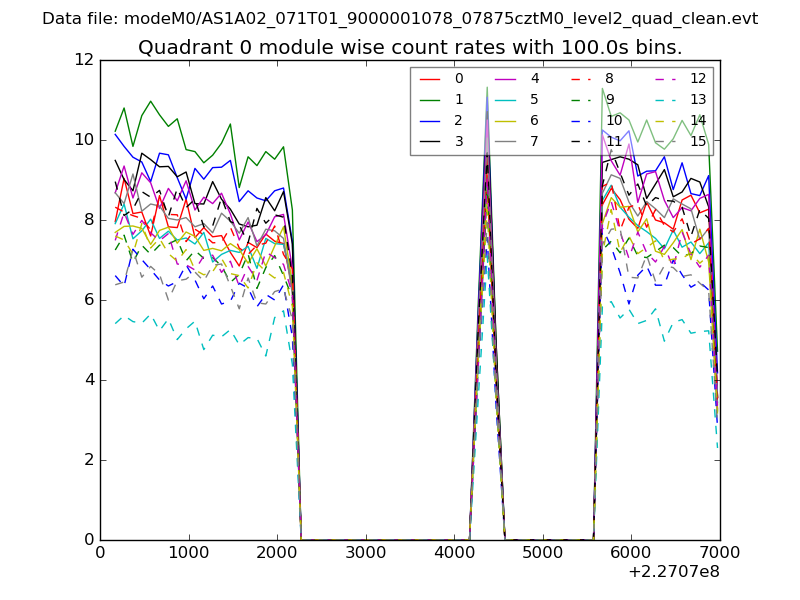 |
 |
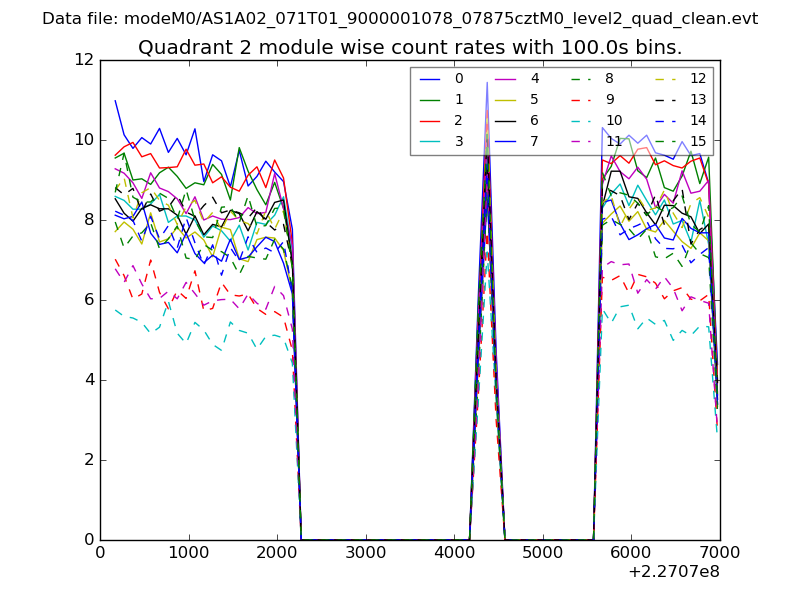
| Module-wise count rates for Quadrant B Data is divided into 100 sec bins |
 |
 |
| Module-wise count rates for Quadrant C Data is divided into 100 sec bins |
 |
 |
| Module-wise count rates for Quadrant D Data is divided into 100 sec bins |
 |
 |
| Parameter | Plot |
|---|---|
| CZT HV Monitor | 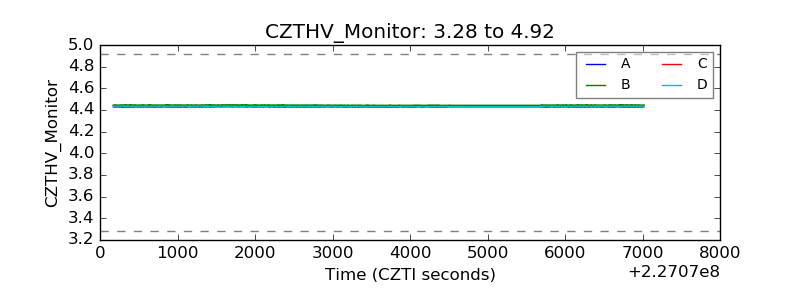 |
| D_VDD | 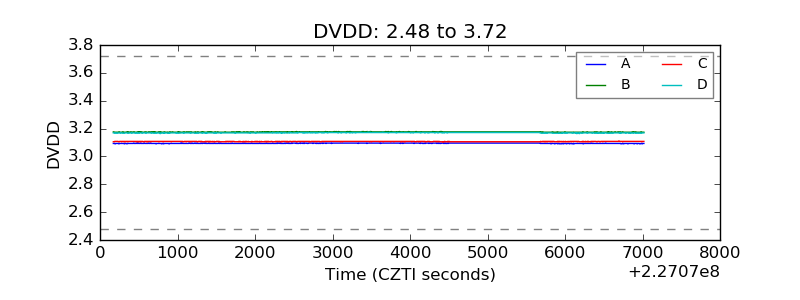 |
| Temperature 1 | 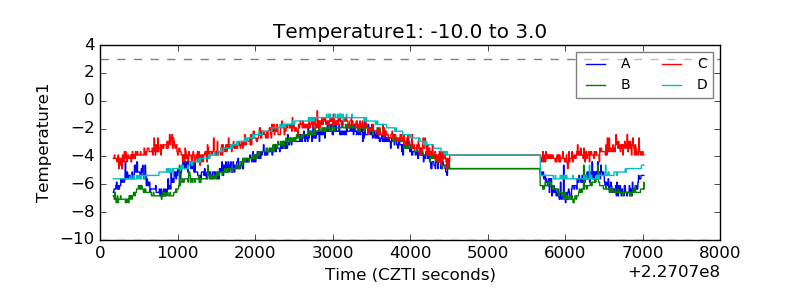 |
| Veto HV Monitor | 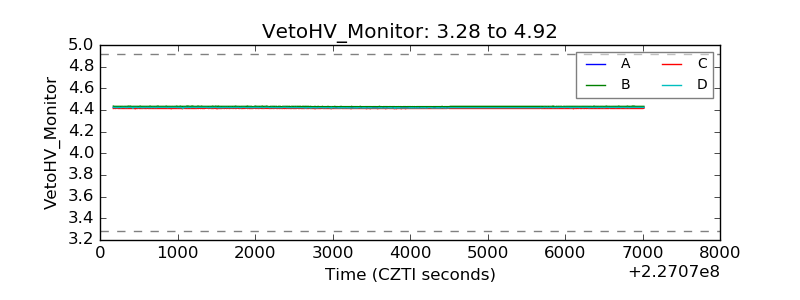 |
| Veto LLD | 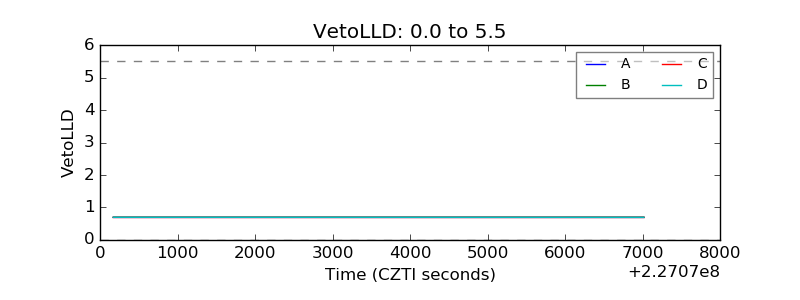 |
| Alpha Counter | 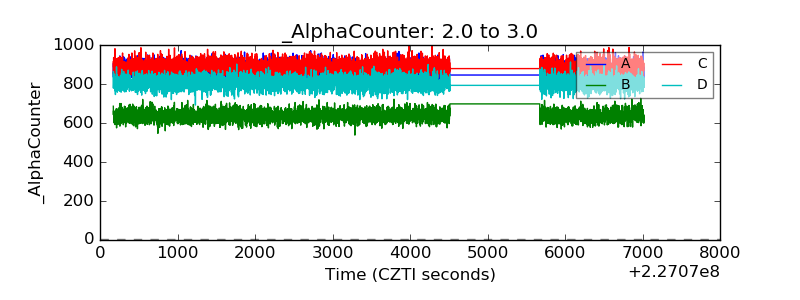 |
| _CPM_Rate | 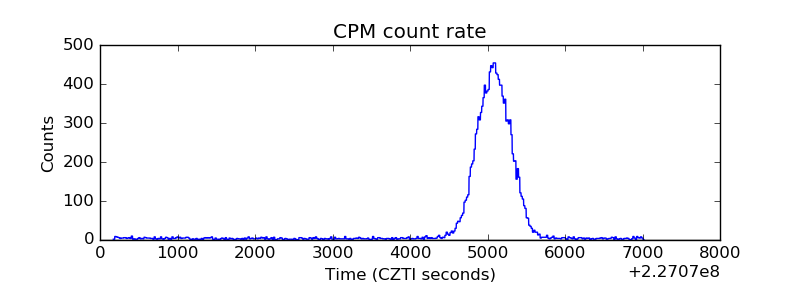 |
| CZT Counter | 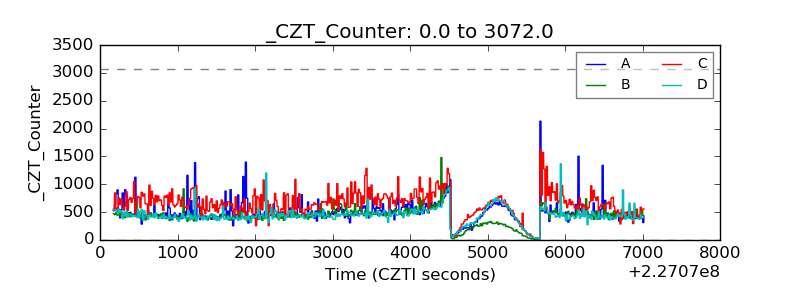 |
| +2.5 Volts monitor | 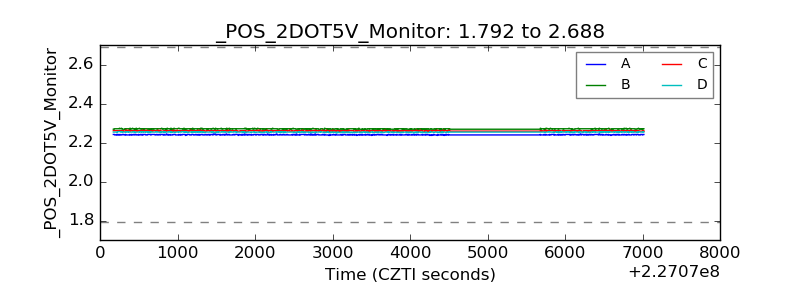 |
| +5 Volts monitor | 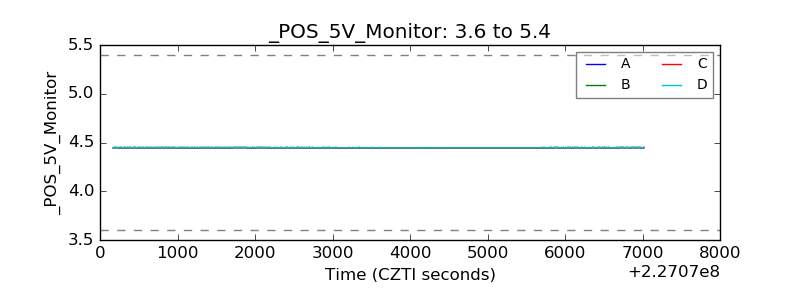 |
| _ROLL_ROT | 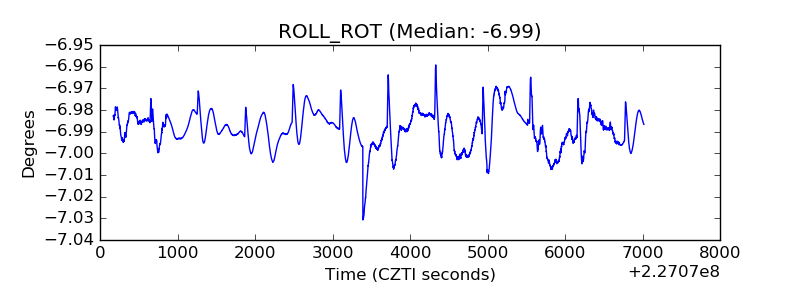 |
| _Roll_DEC | 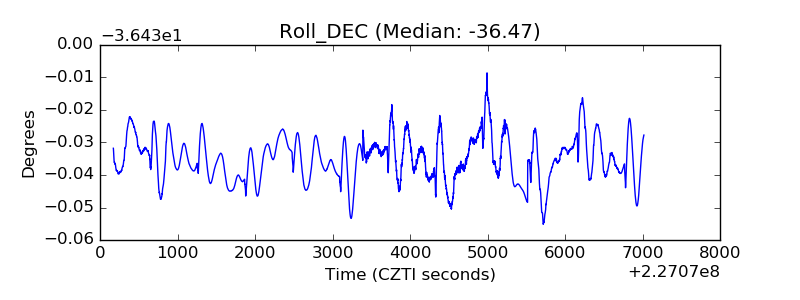 |
| _Roll_RA | 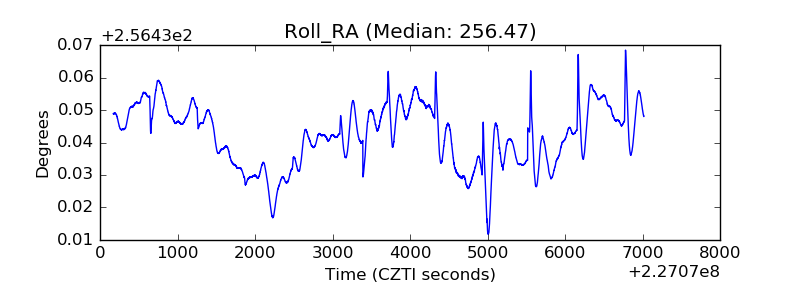 |
| Veto Counter | 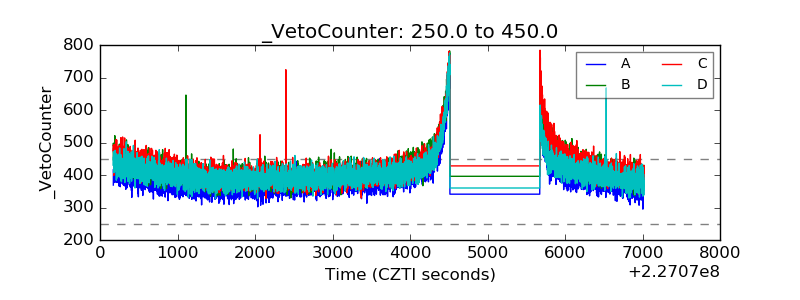 |