| Param | Original file | Final file |
|---|---|---|
| Filename | modeM0/AS1G07_046T01_9000001274_09138cztM0_level2.evt | modeM0/AS1G07_046T01_9000001274_09138cztM0_level2_quad_clean.evt |
| Size (bytes) | 604,860,480 | 87,114,240 |
| Size | 576.8 MB | 83.1 MB |
| Events in quadrant A | 5,545,330 | 516,787 |
| Events in quadrant B | 4,087,970 | 525,847 |
| Events in quadrant C | 4,020,072 | 513,036 |
| Events in quadrant D | 4,101,836 | 505,511 |
| Mode M9 | |||
|---|---|---|---|
| Quadrant | BADHDUFLAG | Total packets | Discarded packets |
| A | 0 | 3 | 0 |
| B | 0 | 3 | 0 |
| C | 0 | 3 | 0 |
| D | 0 | 3 | 0 |
| Mode SS | |||
|---|---|---|---|
| Quadrant | BADHDUFLAG | Total packets | Discarded packets |
| A | 0 | 170 | 0 |
| B | 0 | 170 | 0 |
| C | 0 | 170 | 0 |
| D | 0 | 170 | 0 |
| Mode M0 | |||
|---|---|---|---|
| Quadrant | BADHDUFLAG | Total packets | Discarded packets |
| A | 0 | 22165 | 11 |
| B | 0 | 17616 | 8 |
| C | 0 | 17747 | 4 |
| D | 0 | 18097 | 2 |
| Quadrant | Total seconds | Saturated seconds | Saturation percentage |
|---|---|---|---|
| A | 8301 | 405 | 4.878930% |
| B | 8301 | 378 | 4.553668% |
| C | 8303 | 282 | 3.396363% |
| D | 8304 | 338 | 4.070328% |
Noise dominated data is calculated using 1-second bins in cleaned event files. If a bin has >2000 counts, and if more than 50% of those come from <1% of pixels, then it is considered to be noise-dominated and hence unusable.
| Quadrant | # 1 sec bins | Bins with >0 counts | Bins with >2000 counts | High rate bins dominated by noise | Noise dominated (total time) | Noise dominated (detector-on time) | Marked lightcurve |
|---|---|---|---|---|---|---|---|
| A | 8564 | 8304 | 12 | 12 | 0.14% | 0.14% | 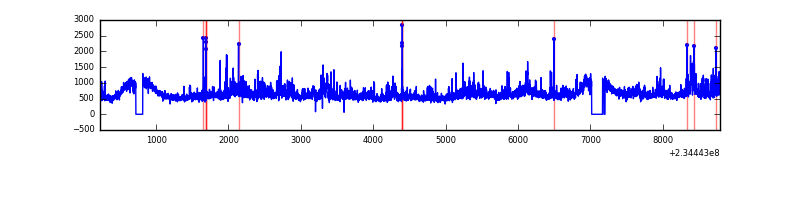 |
| B | 8564 | 8305 | 0 | 0 | 0.00% | 0.00% | 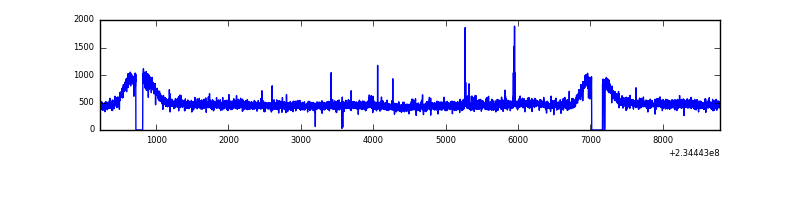 |
| C | 8564 | 8305 | 0 | 0 | 0.00% | 0.00% | 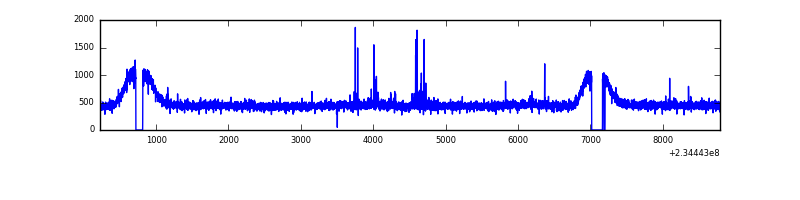 |
| D | 8564 | 8305 | 42 | 42 | 0.49% | 0.51% | 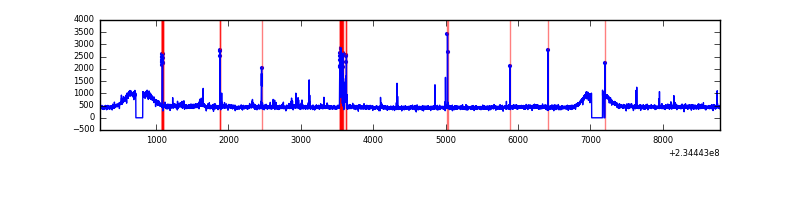 |
Top three noisy pixels from each quadrant. If the there are fewer than three noisy pixels in the level2.evt file, extra rows are filled as -1
| Pixel properties | Quadrant properties | ||||||
|---|---|---|---|---|---|---|---|
| Quadrant | DetID | PixID | Counts | Sigma | Mean | Median | Sigma |
| A | 8 | 5 | 921425 | 4299.43 | 1042 | 1019 | 214.1 |
| A | 15 | 236 | 393700 | 1834.31 | 1042 | 1019 | 214.1 |
| A | 4 | 2 | 49945 | 228.54 | 1042 | 1019 | 214.1 |
| B | 12 | 111 | 23911 | 111.52 | 1041 | 1012 | 205.3 |
| B | 11 | 111 | 19416 | 89.63 | 1041 | 1012 | 205.3 |
| B | 4 | 80 | 14779 | 67.04 | 1041 | 1012 | 205.3 |
| C | 14 | 234 | 45203 | 184.34 | 1009 | 1012 | 239.7 |
| C | 8 | 128 | 15341 | 59.77 | 1009 | 1012 | 239.7 |
| C | 9 | 68 | 8032 | 29.28 | 1009 | 1012 | 239.7 |
| D | 1 | 52 | 121317 | 480.92 | 1016 | 989 | 250.2 |
| D | 7 | 71 | 53397 | 209.46 | 1016 | 989 | 250.2 |
| D | 2 | 14 | 45988 | 179.85 | 1016 | 989 | 250.2 |
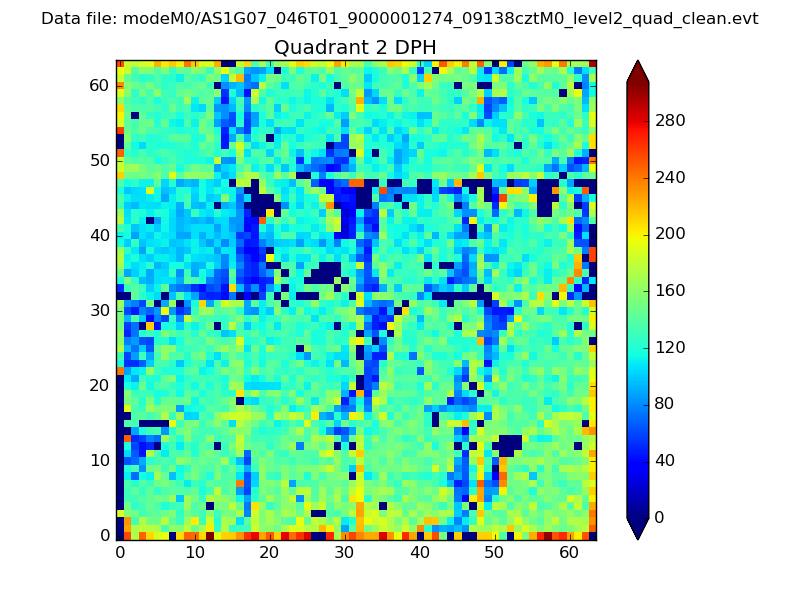
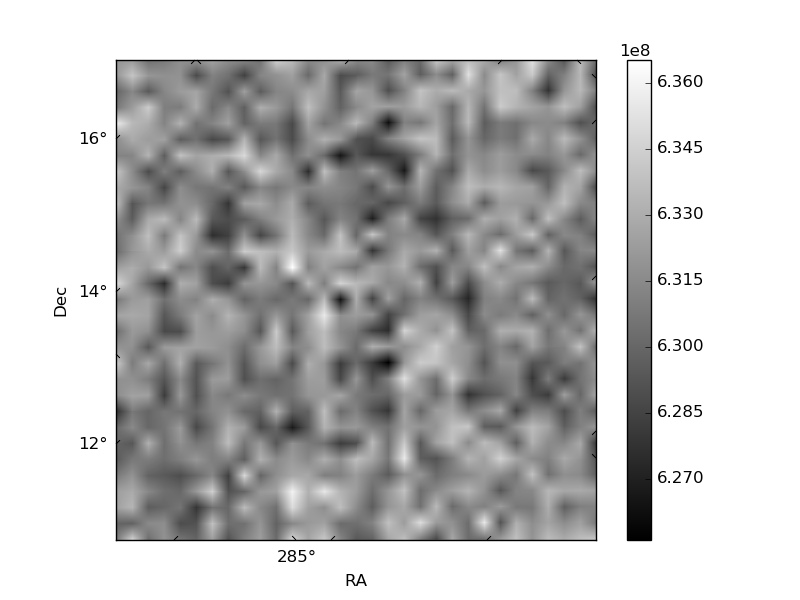
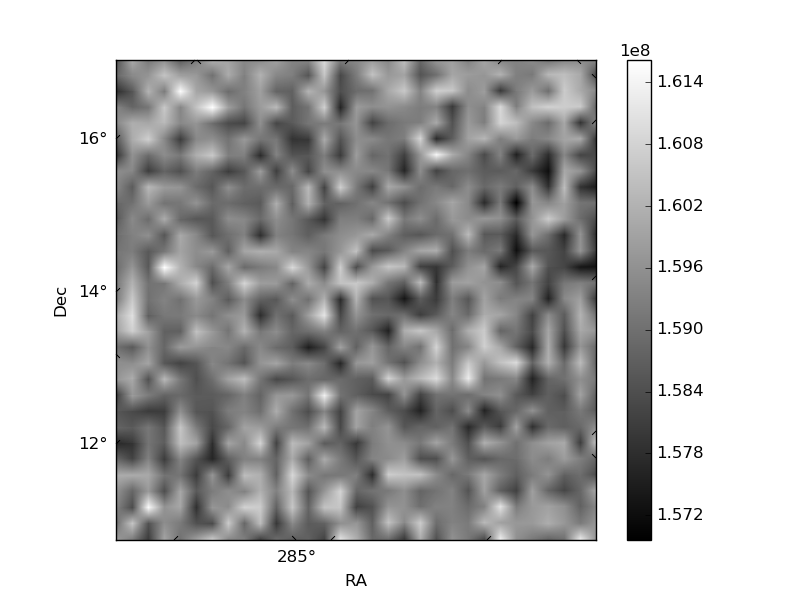
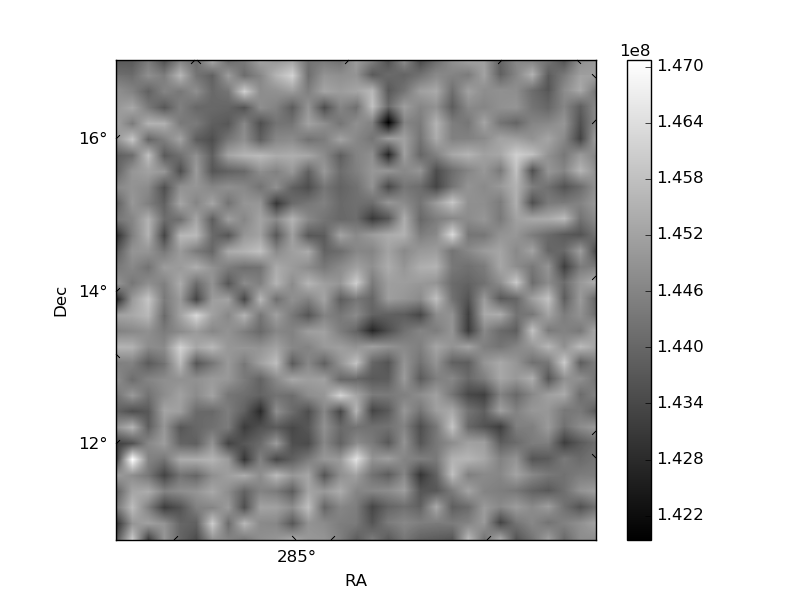
Histogram calculated using DETX and DETY for each event in the final _common_clean file
| Quadrant A | 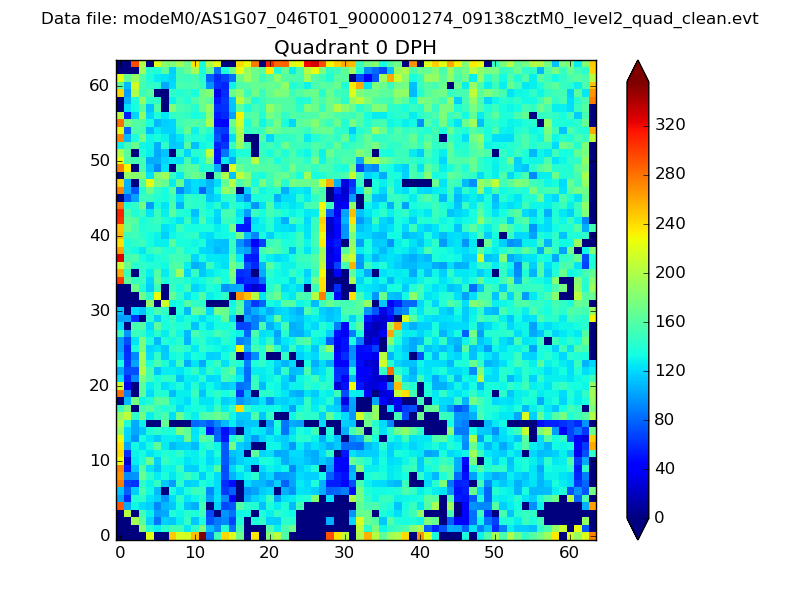 |
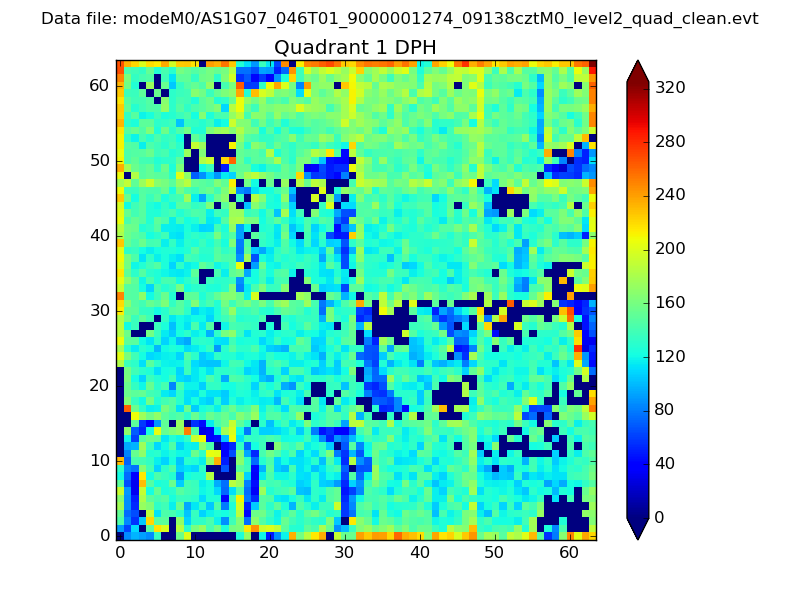 |
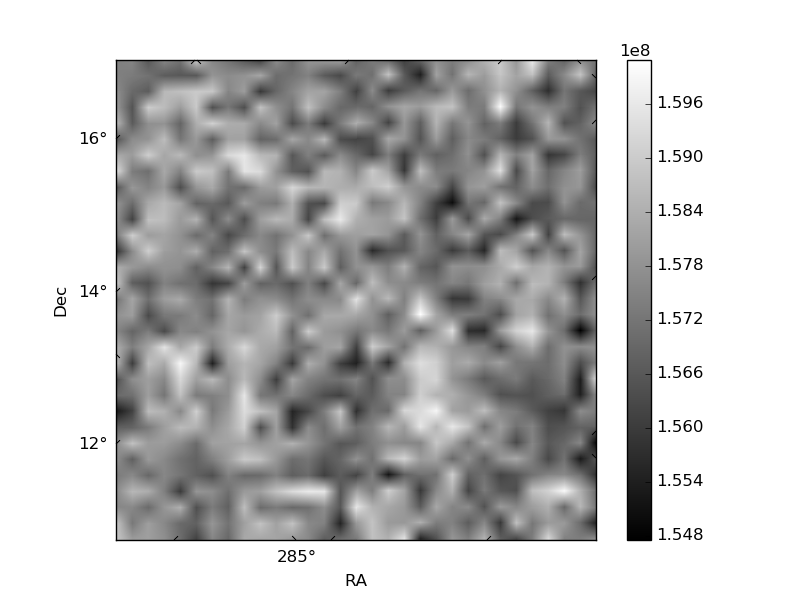
Quadrant B |
|---|---|---|---|
| Quadrant D | 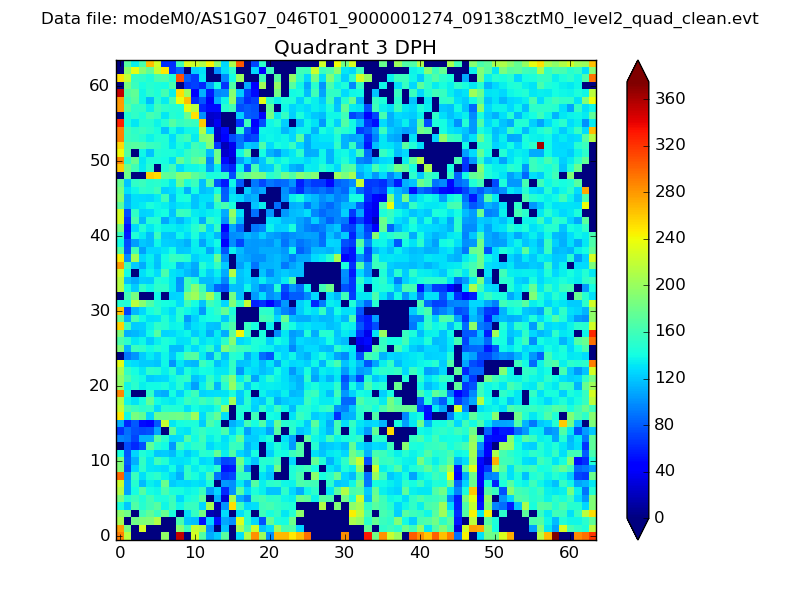 |
 |
Quadrant C |
| Plot type | Count rate plots | Images |
|---|---|---|
| Comparison with Poisson distribution Blue bars denote a histogram of data divided into 1 sec bins. Red curve is a Poisson curve with rate = median count rate of data. |
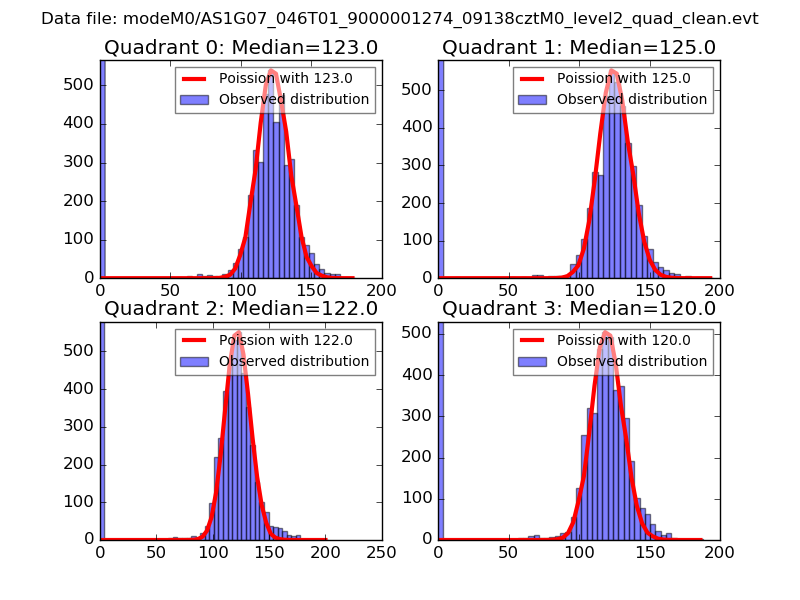 |
 |
| Quadrant-wise count rates Data is divided into 100 sec bins |
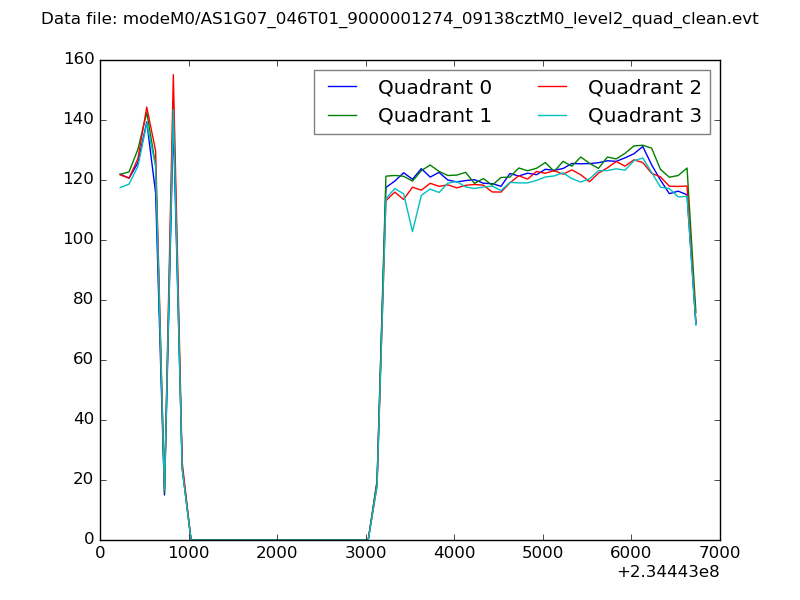 |
|
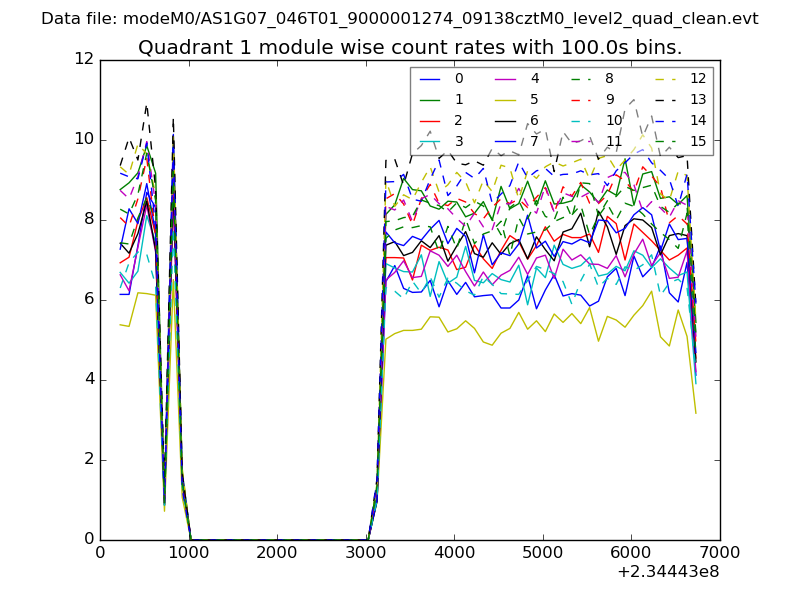
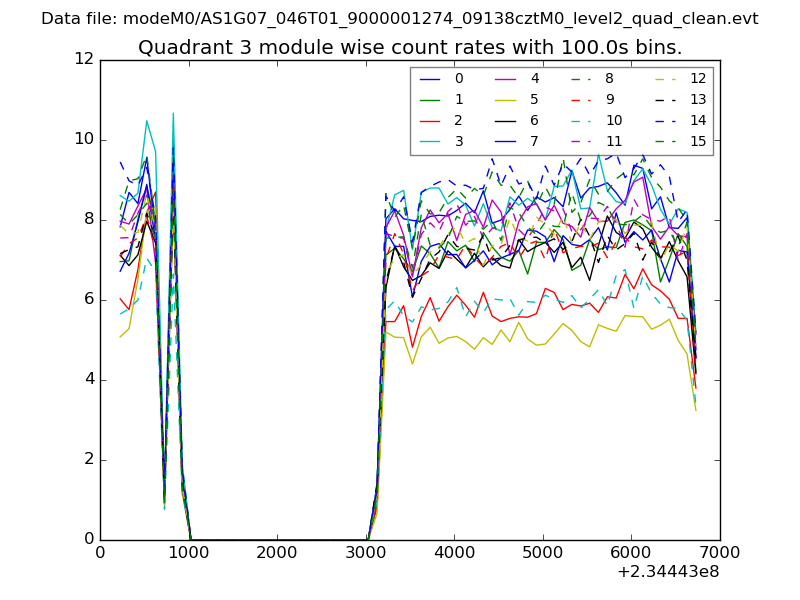
| Module-wise count rates for Quadrant A Data is divided into 100 sec bins |
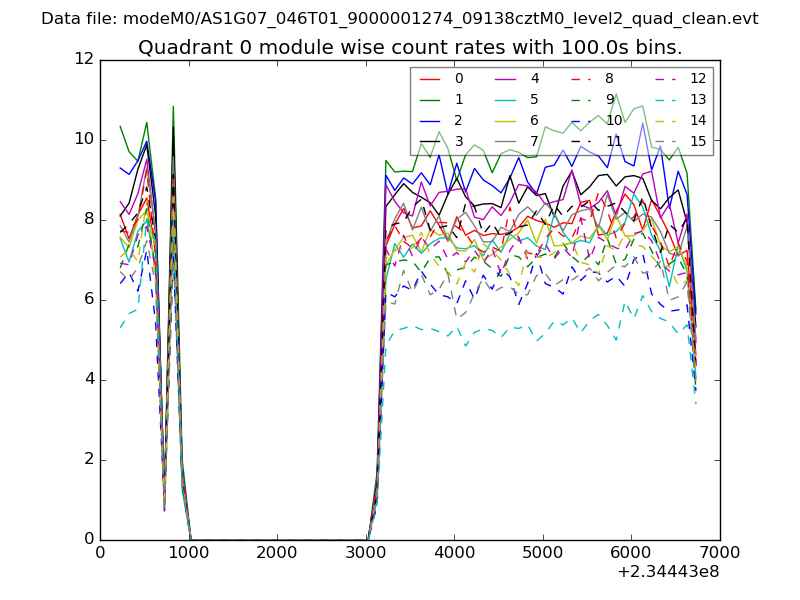 |
 |
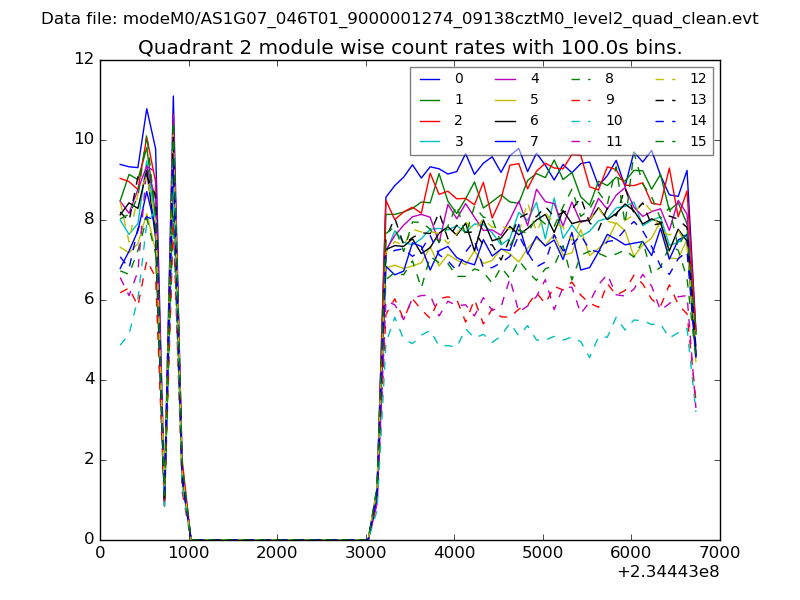
| Module-wise count rates for Quadrant B Data is divided into 100 sec bins |
 |
 |
| Module-wise count rates for Quadrant C Data is divided into 100 sec bins |
 |
 |
| Module-wise count rates for Quadrant D Data is divided into 100 sec bins |
 |
 |
| Parameter | Plot |
|---|---|
| CZT HV Monitor | 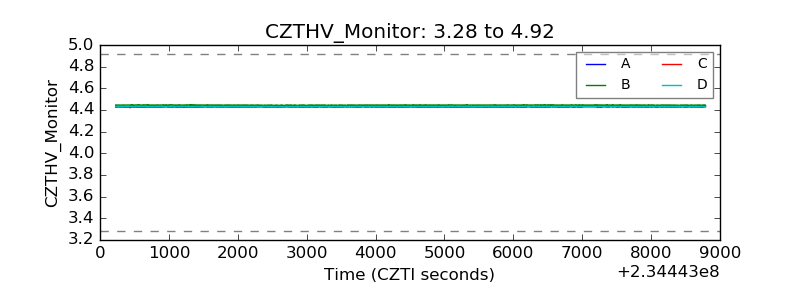 |
| D_VDD | 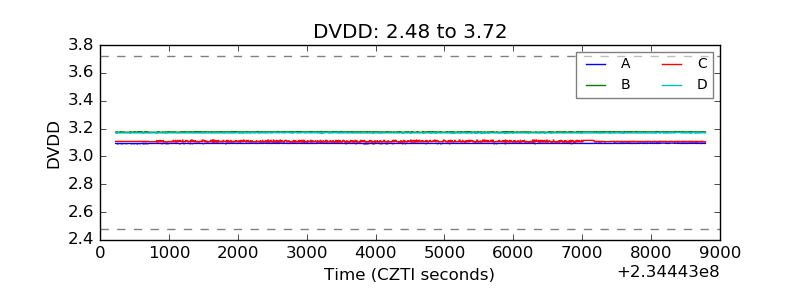 |
| Temperature 1 | 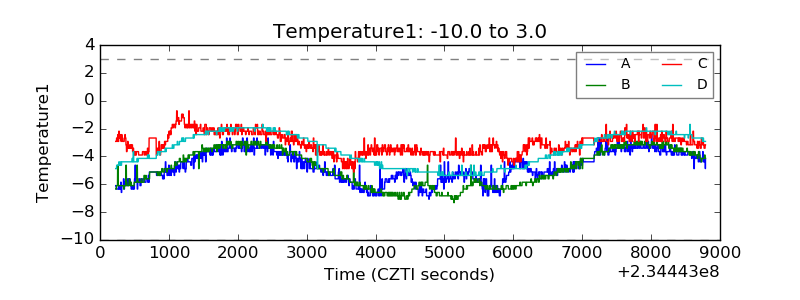 |
| Veto HV Monitor | 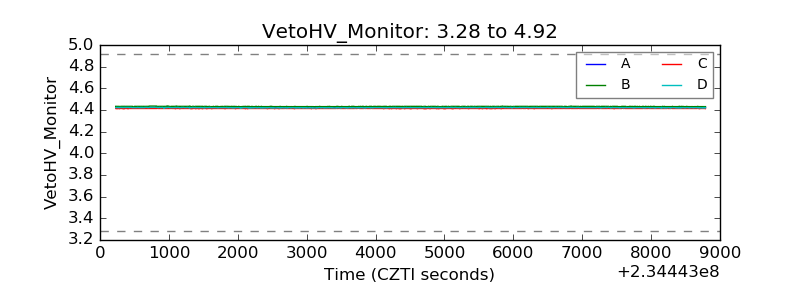 |
| Veto LLD | 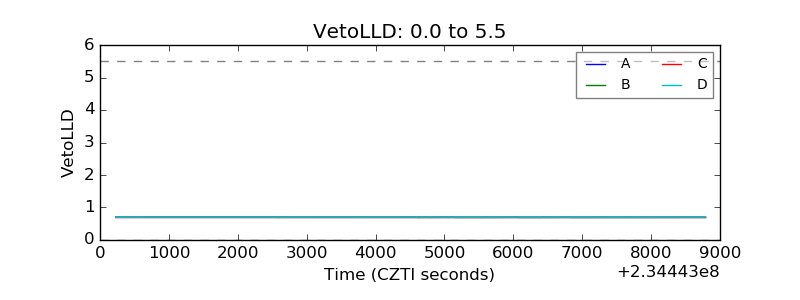 |
| Alpha Counter | 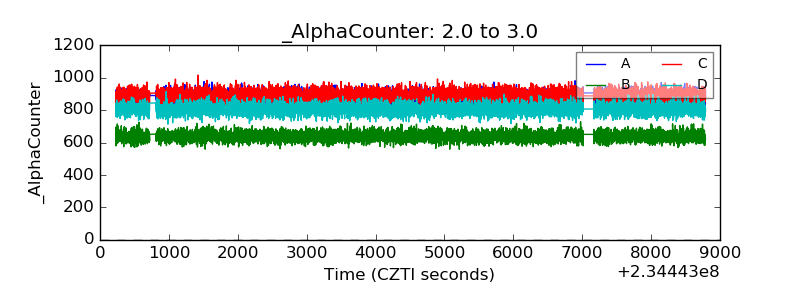 |
| _CPM_Rate | 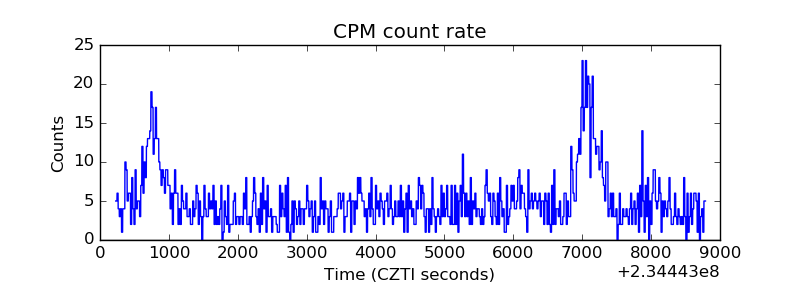 |
| CZT Counter | 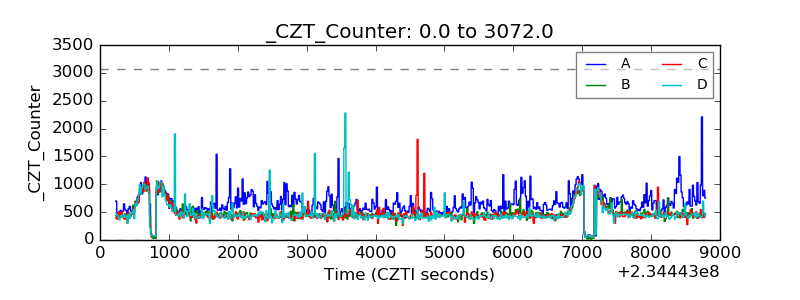 |
| +2.5 Volts monitor | 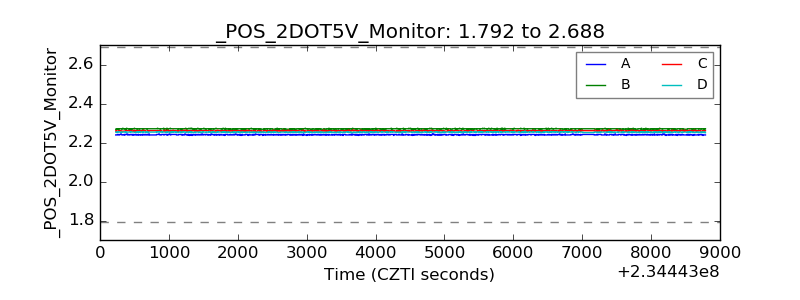 |
| +5 Volts monitor | 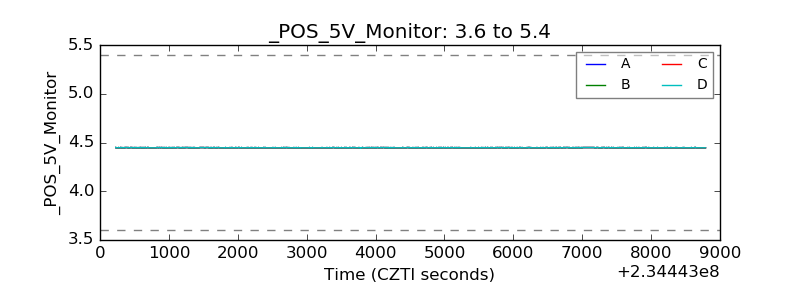 |
| _ROLL_ROT | 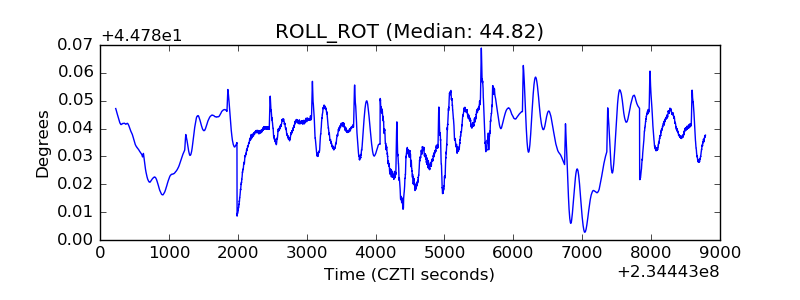 |
| _Roll_DEC | 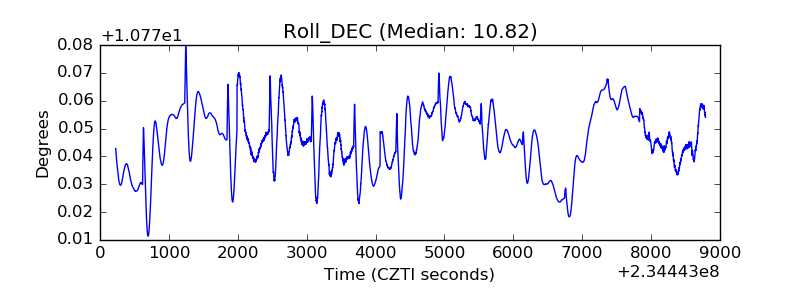 |
| _Roll_RA | 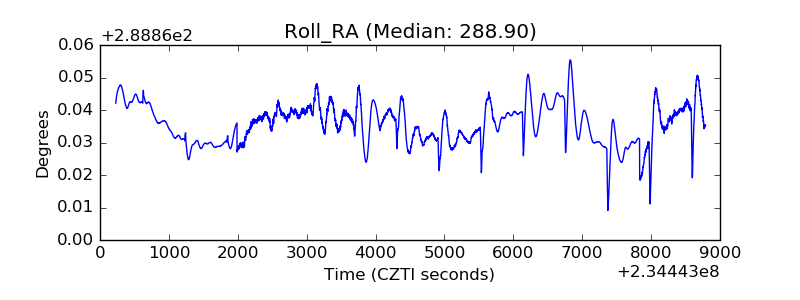 |
| Veto Counter | 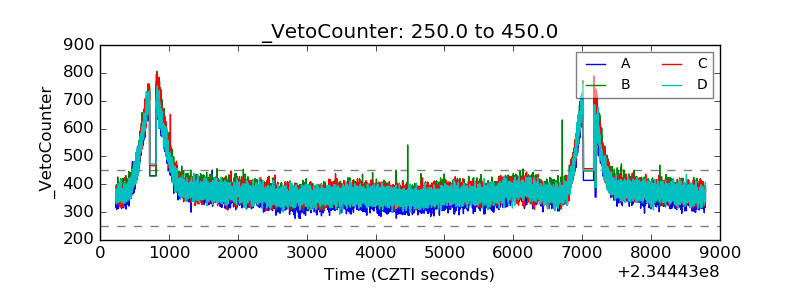 |