| Param | Original file | Final file |
|---|---|---|
| Filename | modeM0/AS1A03_053T01_9000001542_10714cztM0_level2.evt | modeM0/AS1A03_053T01_9000001542_10714cztM0_level2_quad_clean.evt |
| Size (bytes) | 583,597,440 | 86,872,320 |
| Size | 556.6 MB | 82.8 MB |
| Events in quadrant A | 3,480,068 | 549,454 |
| Events in quadrant B | 4,894,157 | 538,593 |
| Events in quadrant C | 4,248,926 | 532,420 |
| Events in quadrant D | 4,558,826 | 504,308 |
| Mode M0 | |||
|---|---|---|---|
| Quadrant | BADHDUFLAG | Total packets | Discarded packets |
| A | 0 | 15281 | 3 |
| B | 0 | 19288 | 2 |
| C | 0 | 17754 | 2 |
| D | 0 | 18459 | 2 |
| Mode M9 | |||
|---|---|---|---|
| Quadrant | BADHDUFLAG | Total packets | Discarded packets |
| A | 0 | 14 | 0 |
| B | 0 | 14 | 0 |
| C | 0 | 14 | 0 |
| D | 0 | 14 | 0 |
| Mode SS | |||
|---|---|---|---|
| Quadrant | BADHDUFLAG | Total packets | Discarded packets |
| A | 0 | 150 | 0 |
| B | 0 | 150 | 0 |
| C | 0 | 150 | 0 |
| D | 0 | 150 | 0 |
| Quadrant | Total seconds | Saturated seconds | Saturation percentage |
|---|---|---|---|
| A | 7259 | 70 | 0.964320% |
| B | 7259 | 467 | 6.433393% |
| C | 7259 | 339 | 4.670065% |
| D | 7259 | 261 | 3.595537% |
Noise dominated data is calculated using 1-second bins in cleaned event files. If a bin has >2000 counts, and if more than 50% of those come from <1% of pixels, then it is considered to be noise-dominated and hence unusable.
| Quadrant | # 1 sec bins | Bins with >0 counts | Bins with >2000 counts | High rate bins dominated by noise | Noise dominated (total time) | Noise dominated (detector-on time) | Marked lightcurve |
|---|---|---|---|---|---|---|---|
| A | 8704 | 7261 | 8 | 8 | 0.09% | 0.11% | 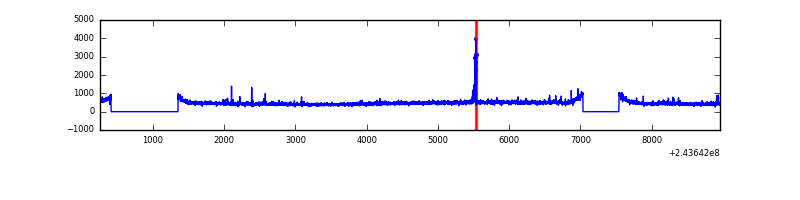 |
| B | 8704 | 7261 | 190 | 190 | 2.18% | 2.62% | 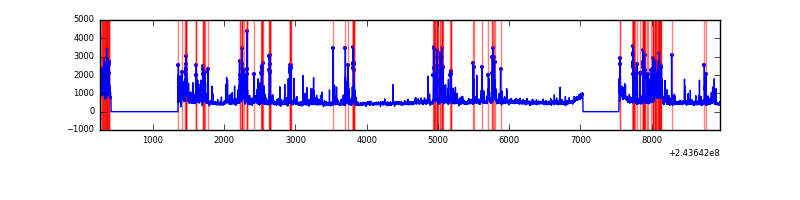 |
| C | 8704 | 7261 | 196 | 196 | 2.25% | 2.70% | 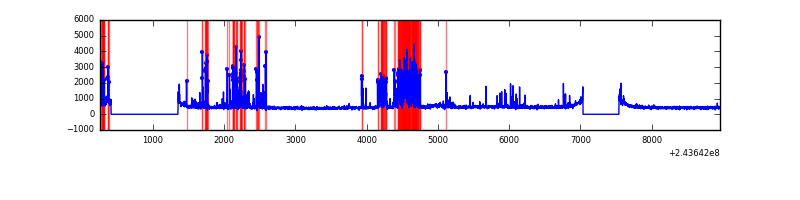 |
| D | 8704 | 7261 | 179 | 179 | 2.06% | 2.47% | 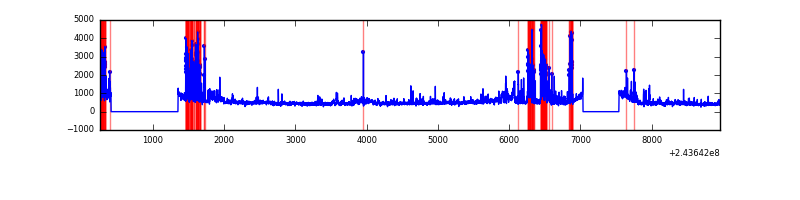 |
Top three noisy pixels from each quadrant. If the there are fewer than three noisy pixels in the level2.evt file, extra rows are filled as -1
| Pixel properties | Quadrant properties | ||||||
|---|---|---|---|---|---|---|---|
| Quadrant | DetID | PixID | Counts | Sigma | Mean | Median | Sigma |
| A | 15 | 174 | 64227 | 358.02 | 861 | 842 | 177.0 |
| A | 1 | 162 | 33200 | 182.77 | 861 | 842 | 177.0 |
| A | 14 | 254 | 17606 | 94.69 | 861 | 842 | 177.0 |
| B | 4 | 239 | 1235170 | 7471.36 | 852 | 831 | 165.2 |
| B | 4 | 81 | 204185 | 1230.88 | 852 | 831 | 165.2 |
| B | 0 | 214 | 51829 | 308.68 | 852 | 831 | 165.2 |
| C | 4 | 254 | 1008637 | 5234.71 | 823 | 826 | 192.5 |
| C | 14 | 234 | 19118 | 95.01 | 823 | 826 | 192.5 |
| C | 4 | 238 | 6601 | 30.0 | 823 | 826 | 192.5 |
| D | 10 | 199 | 691006 | 3450.24 | 815 | 789 | 200.0 |
| D | 8 | 195 | 220607 | 1098.82 | 815 | 789 | 200.0 |
| D | 1 | 52 | 196084 | 976.24 | 815 | 789 | 200.0 |
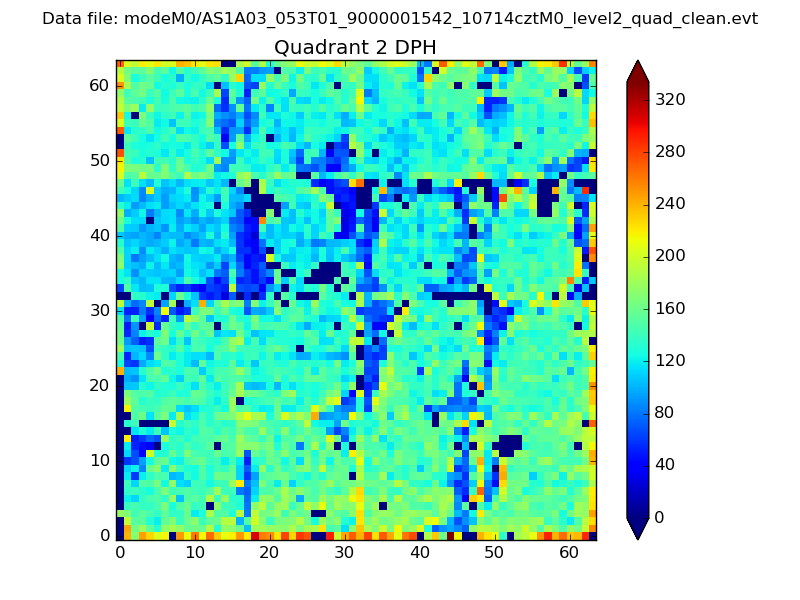
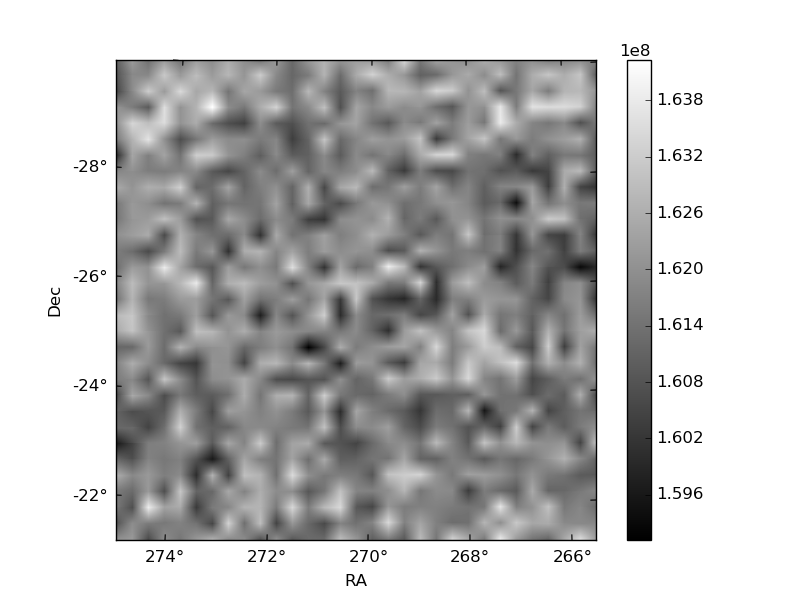
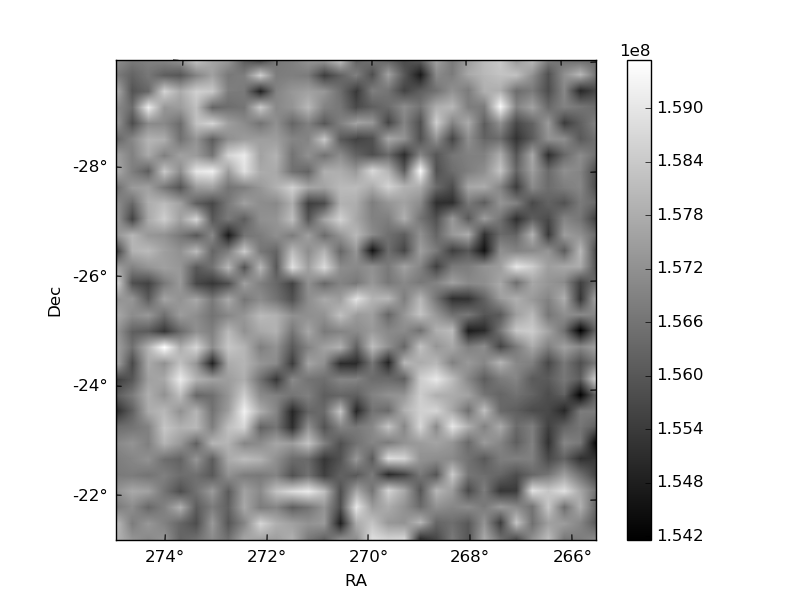
Histogram calculated using DETX and DETY for each event in the final _common_clean file
| Quadrant A | 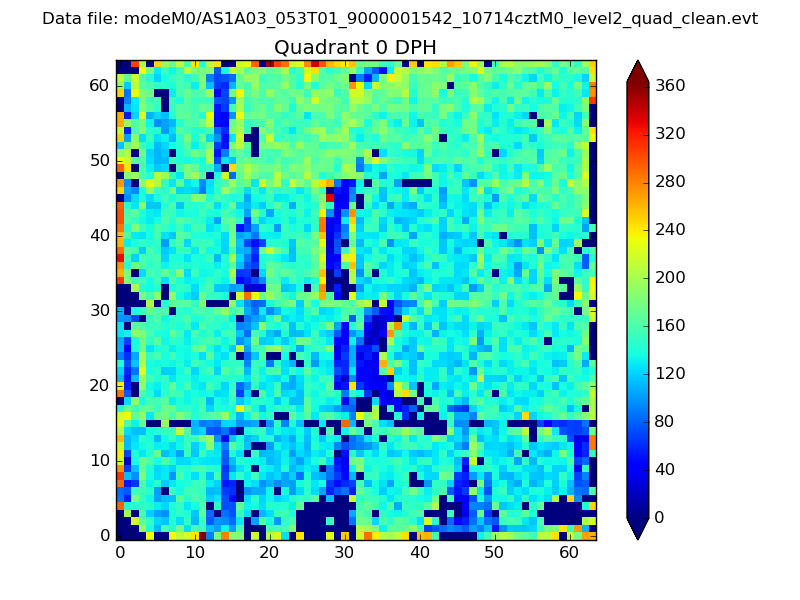 |
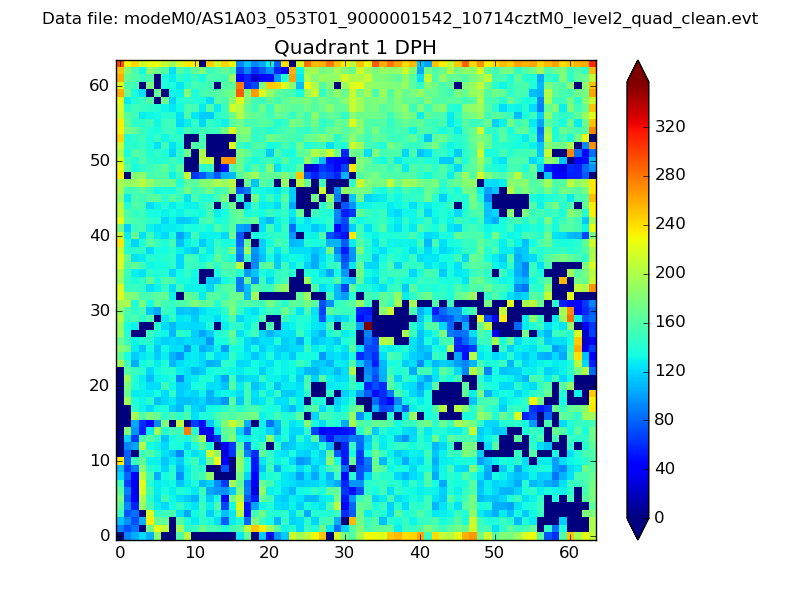 |
Quadrant B |
|---|---|---|---|
| Quadrant D | 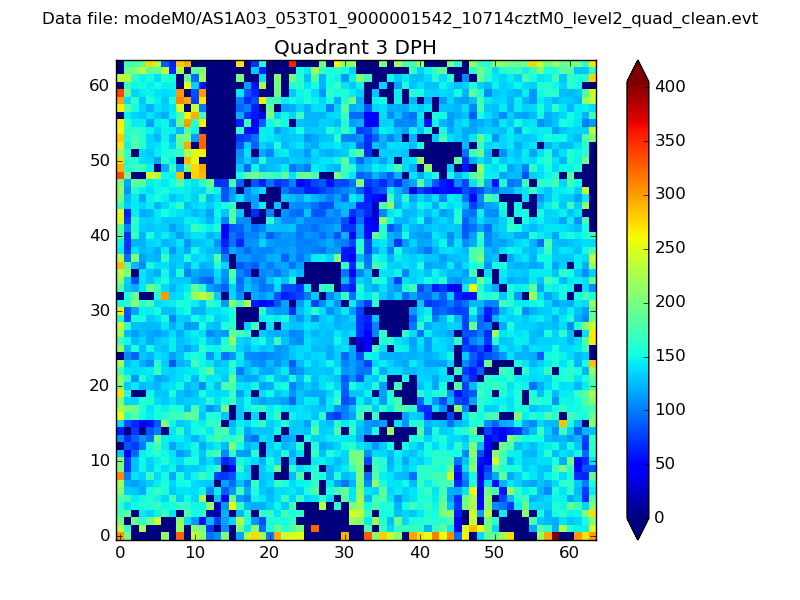 |
 |
Quadrant C |
| Plot type | Count rate plots | Images |
|---|---|---|
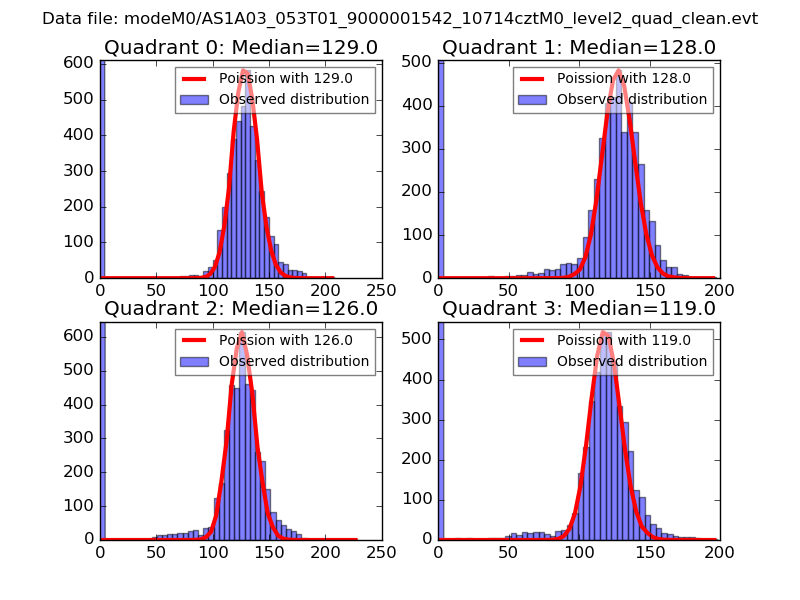
| Comparison with Poisson distribution Blue bars denote a histogram of data divided into 1 sec bins. Red curve is a Poisson curve with rate = median count rate of data. |
 |
 |
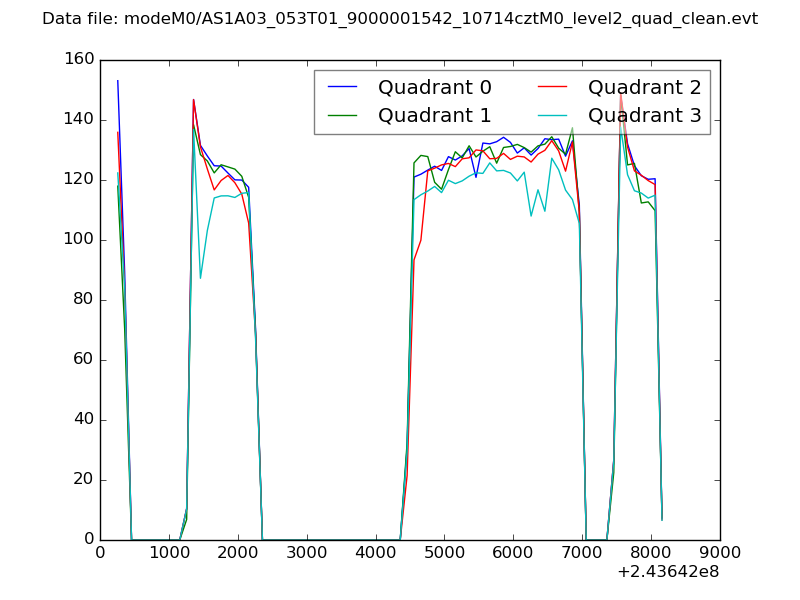
| Quadrant-wise count rates Data is divided into 100 sec bins |
 |
|
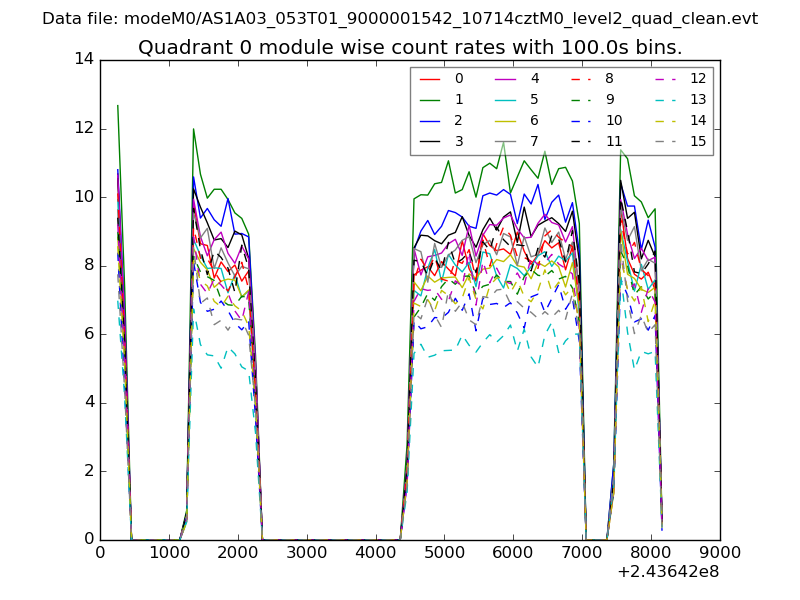
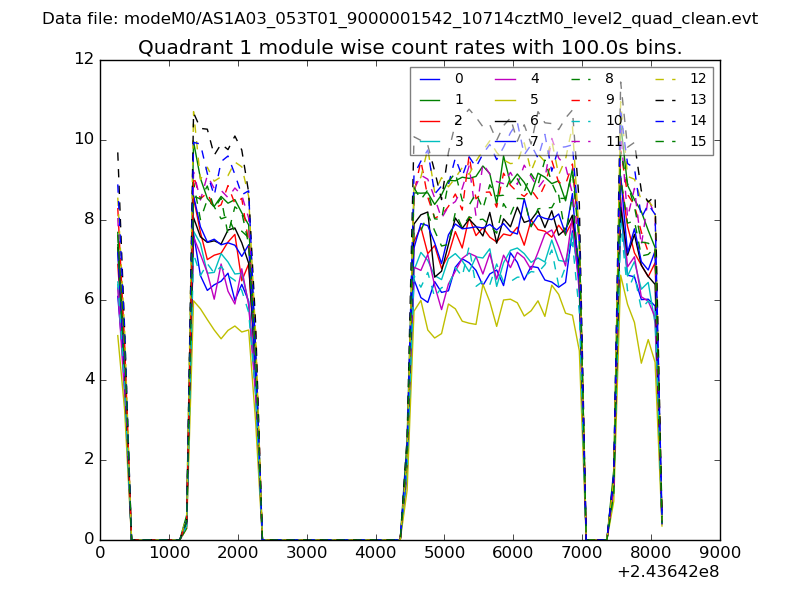
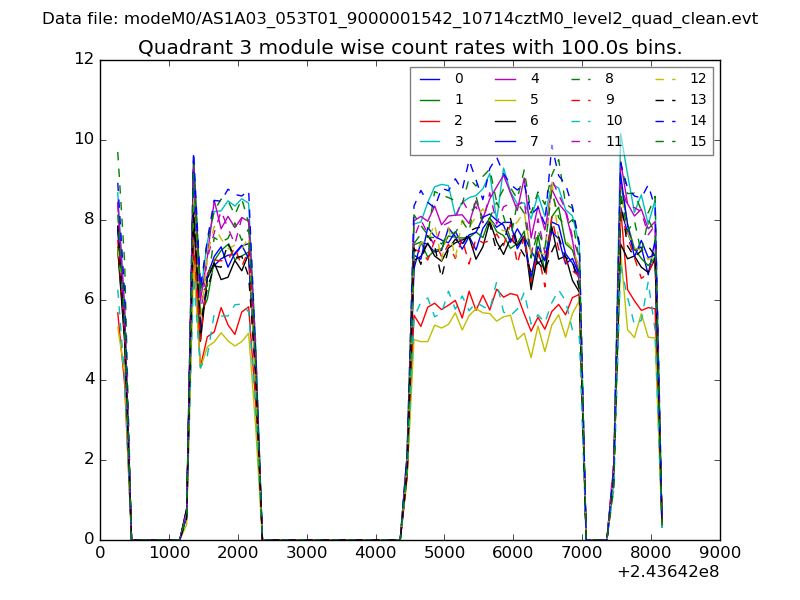
| Module-wise count rates for Quadrant A Data is divided into 100 sec bins |
 |
 |
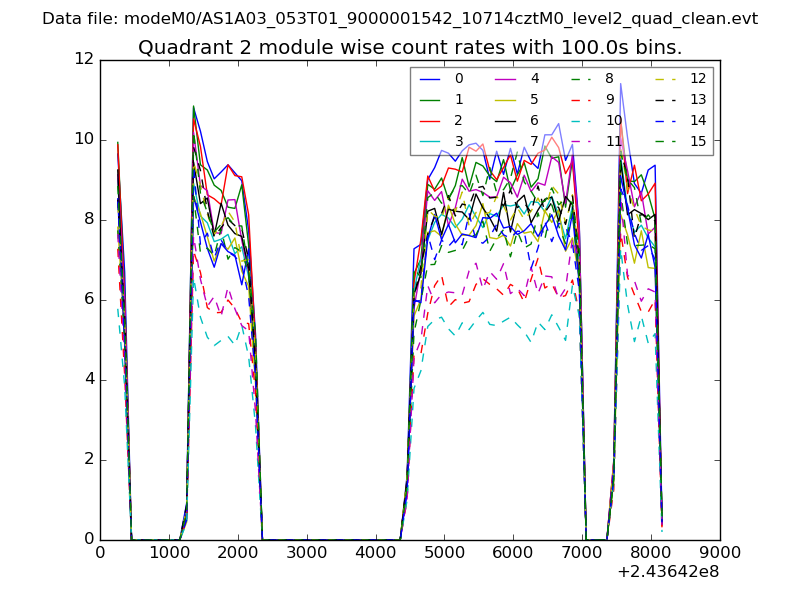
| Module-wise count rates for Quadrant B Data is divided into 100 sec bins |
 |
 |
| Module-wise count rates for Quadrant C Data is divided into 100 sec bins |
 |
 |
| Module-wise count rates for Quadrant D Data is divided into 100 sec bins |
 |
 |
| Parameter | Plot |
|---|---|
| CZT HV Monitor | 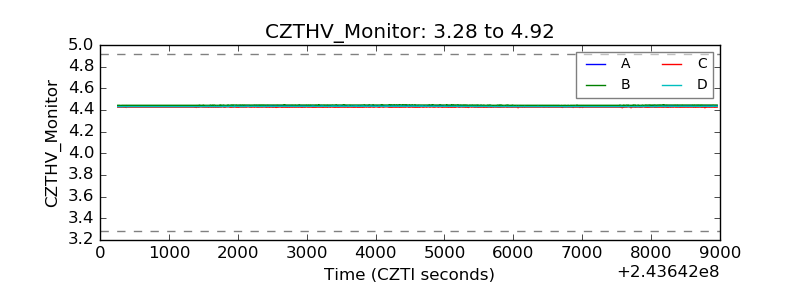 |
| D_VDD | 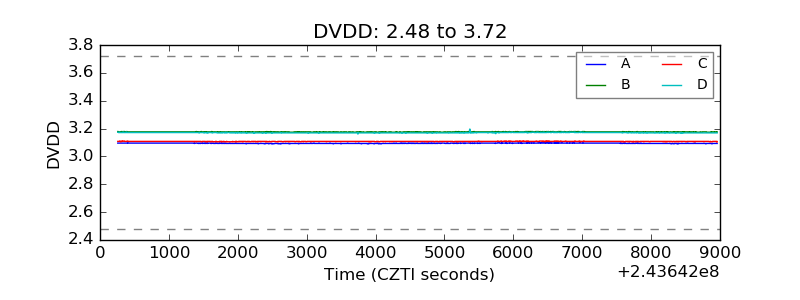 |
| Temperature 1 | 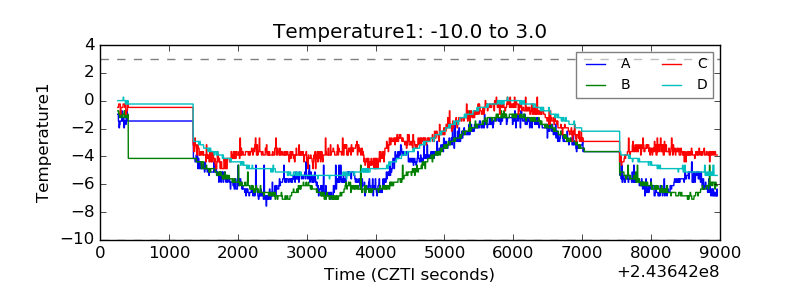 |
| Veto HV Monitor | 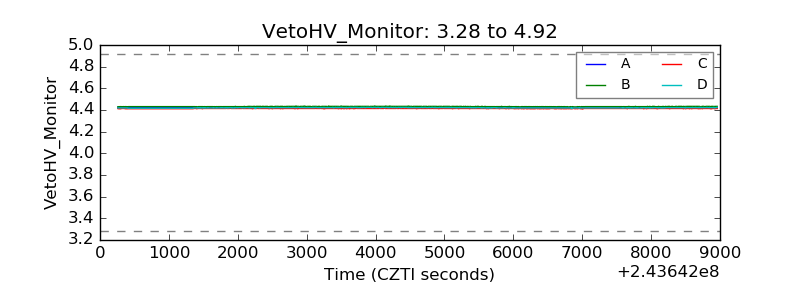 |
| Veto LLD | 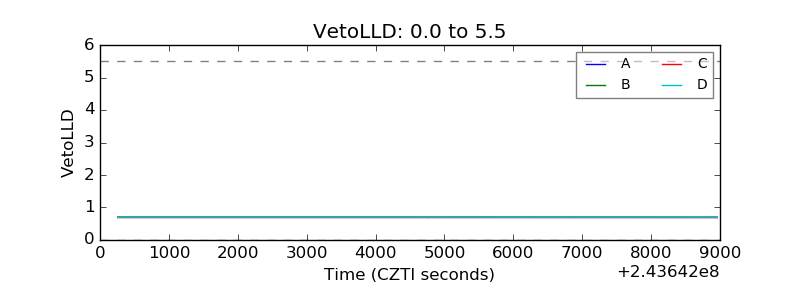 |
| Alpha Counter | 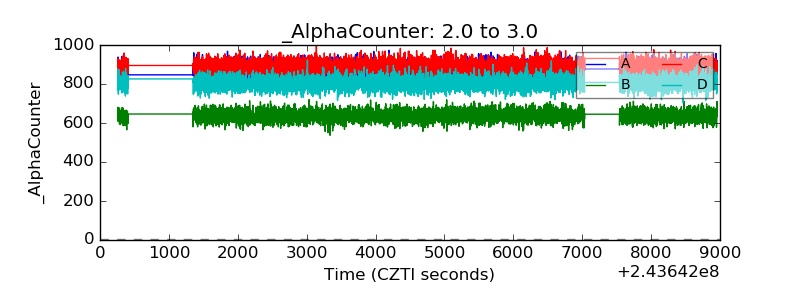 |
| _CPM_Rate | 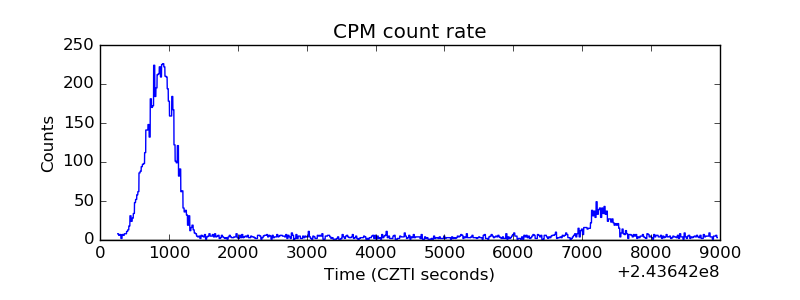 |
| CZT Counter | 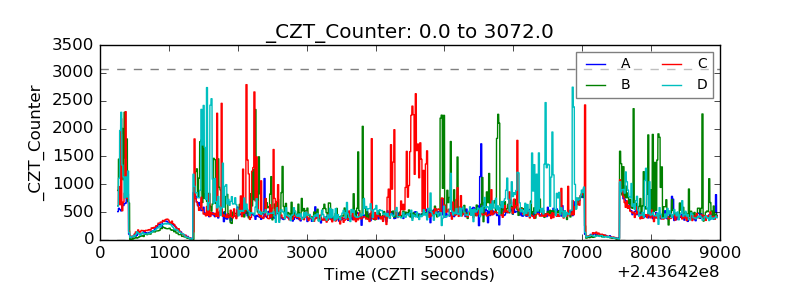 |
| +2.5 Volts monitor | 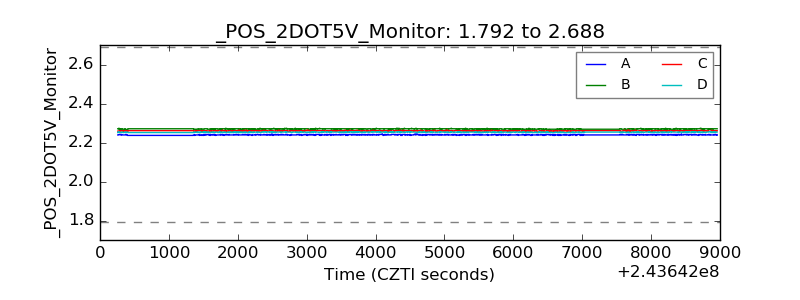 |
| +5 Volts monitor | 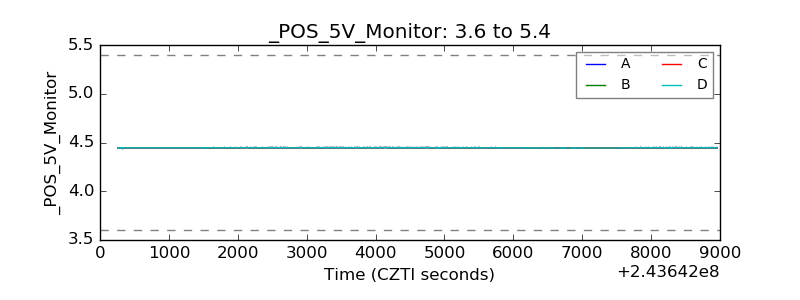 |
| _ROLL_ROT | 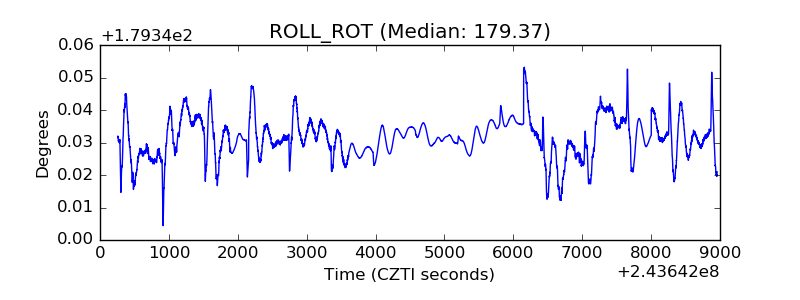 |
| _Roll_DEC | 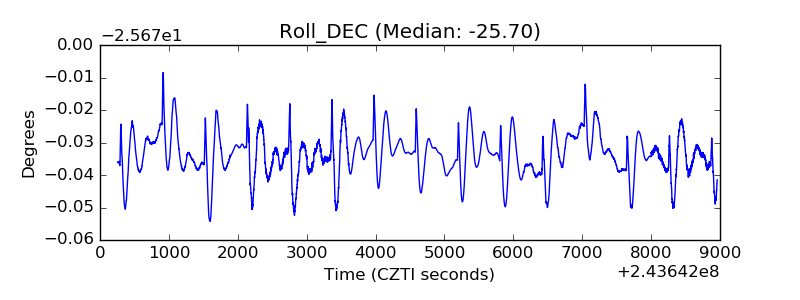 |
| _Roll_RA | 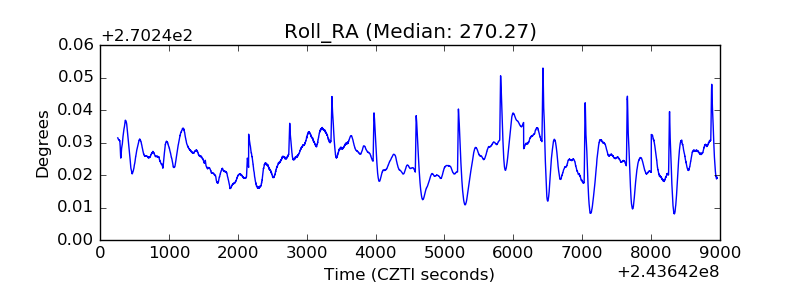 |
| Veto Counter | 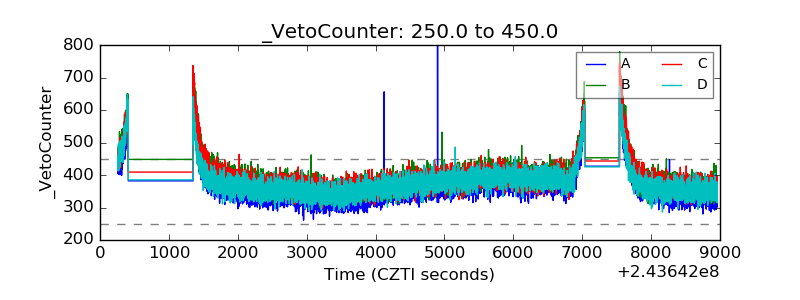 |