| Param | Original file | Final file |
|---|---|---|
| Filename | modeM0/AS1G08_071T02_9000001620_11106cztM0_level2.evt | modeM0/AS1G08_071T02_9000001620_11106cztM0_level2_quad_clean.evt |
| Size (bytes) | 763,073,280 | 86,518,080 |
| Size | 727.7 MB | 82.5 MB |
| Events in quadrant A | 7,067,607 | 494,133 |
| Events in quadrant B | 4,937,630 | 517,895 |
| Events in quadrant C | 4,156,563 | 517,276 |
| Events in quadrant D | 6,362,598 | 490,039 |
| Mode SS | |||
|---|---|---|---|
| Quadrant | BADHDUFLAG | Total packets | Discarded packets |
| A | 0 | 176 | 0 |
| B | 0 | 176 | 0 |
| C | 0 | 176 | 0 |
| D | 0 | 176 | 0 |
| Mode M9 | |||
|---|---|---|---|
| Quadrant | BADHDUFLAG | Total packets | Discarded packets |
| A | 0 | 2 | 0 |
| B | 0 | 2 | 0 |
| C | 0 | 2 | 0 |
| D | 0 | 2 | 0 |
| Mode M0 | |||
|---|---|---|---|
| Quadrant | BADHDUFLAG | Total packets | Discarded packets |
| A | 0 | 26759 | 3 |
| B | 0 | 20087 | 2 |
| C | 0 | 18249 | 2 |
| D | 0 | 24735 | 2 |
| Quadrant | Total seconds | Saturated seconds | Saturation percentage |
|---|---|---|---|
| A | 8642 | 899 | 10.402685% |
| B | 8642 | 633 | 7.324693% |
| C | 8642 | 305 | 3.529276% |
| D | 8642 | 1081 | 12.508679% |
Noise dominated data is calculated using 1-second bins in cleaned event files. If a bin has >2000 counts, and if more than 50% of those come from <1% of pixels, then it is considered to be noise-dominated and hence unusable.
| Quadrant | # 1 sec bins | Bins with >0 counts | Bins with >2000 counts | High rate bins dominated by noise | Noise dominated (total time) | Noise dominated (detector-on time) | Marked lightcurve |
|---|---|---|---|---|---|---|---|
| A | 8907 | 8643 | 273 | 273 | 3.07% | 3.16% | 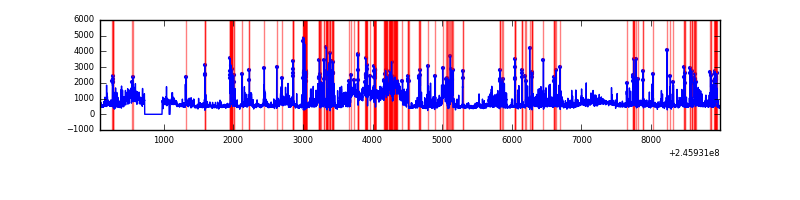 |
| B | 8907 | 8644 | 82 | 82 | 0.92% | 0.95% | 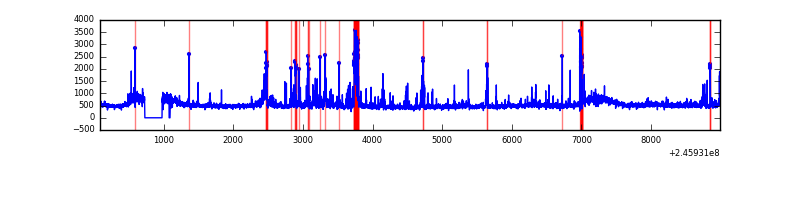 |
| C | 8907 | 8644 | 4 | 4 | 0.04% | 0.05% | 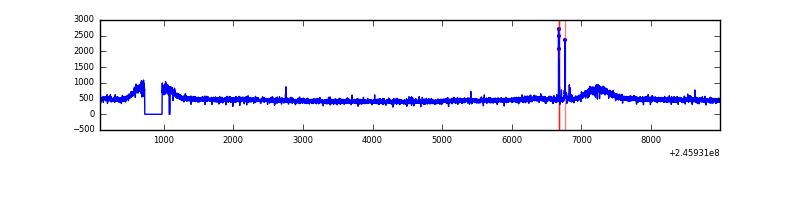 |
| D | 8907 | 8643 | 641 | 641 | 7.20% | 7.42% | 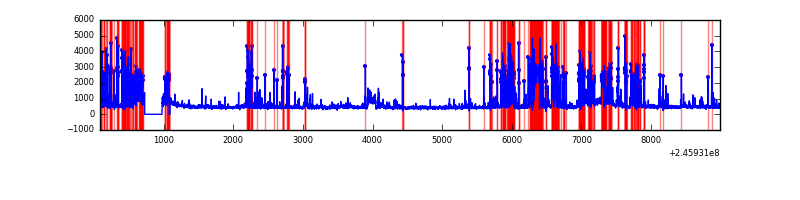 |
Top three noisy pixels from each quadrant. If the there are fewer than three noisy pixels in the level2.evt file, extra rows are filled as -1
| Pixel properties | Quadrant properties | ||||||
|---|---|---|---|---|---|---|---|
| Quadrant | DetID | PixID | Counts | Sigma | Mean | Median | Sigma |
| A | 8 | 5 | 2749092 | 12513.19 | 1058 | 1030 | 219.6 |
| A | 8 | 15 | 98305 | 442.94 | 1058 | 1030 | 219.6 |
| A | 15 | 174 | 70755 | 317.49 | 1058 | 1030 | 219.6 |
| B | 4 | 239 | 368388 | 1768.41 | 1074 | 1044 | 207.7 |
| B | 10 | 16 | 150956 | 721.68 | 1074 | 1044 | 207.7 |
| B | 15 | 204 | 77586 | 368.48 | 1074 | 1044 | 207.7 |
| C | 9 | 54 | 26849 | 104.71 | 1052 | 1054 | 246.3 |
| C | 8 | 128 | 14092 | 52.93 | 1052 | 1054 | 246.3 |
| C | 8 | 112 | 8546 | 30.41 | 1052 | 1054 | 246.3 |
| D | 10 | 253 | 2129802 | 8892.18 | 983 | 951 | 239.4 |
| D | 1 | 52 | 192436 | 799.83 | 983 | 951 | 239.4 |
| D | 10 | 157 | 68926 | 283.93 | 983 | 951 | 239.4 |
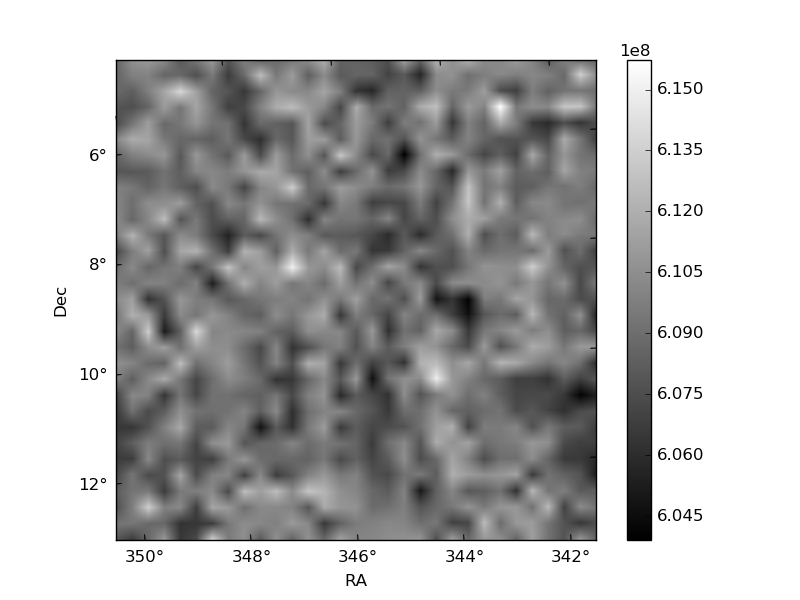
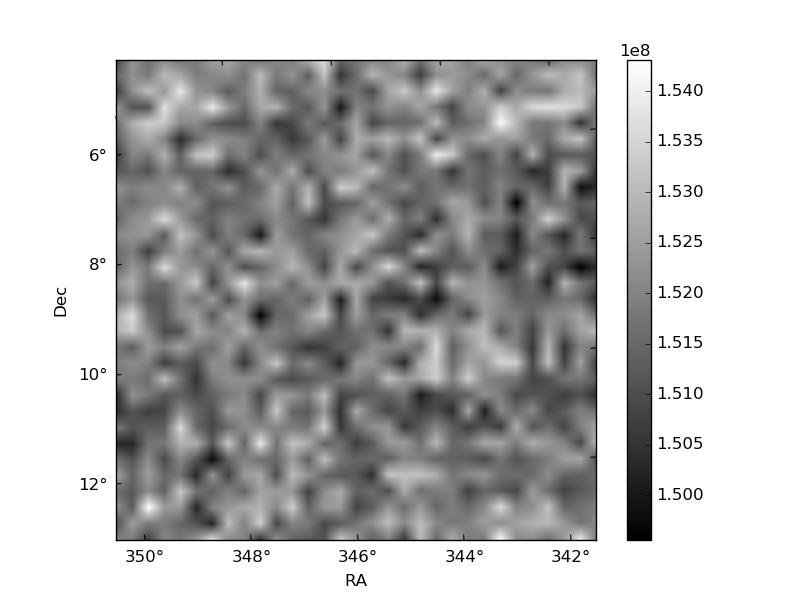
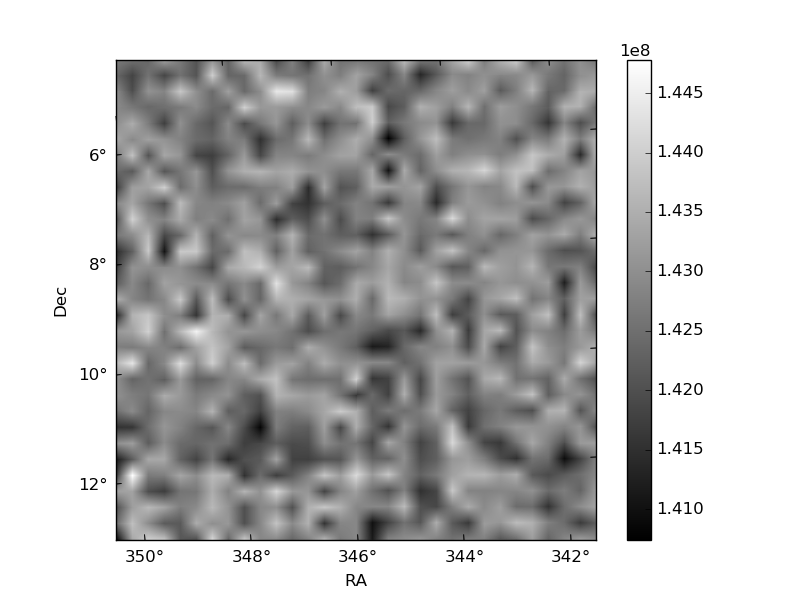
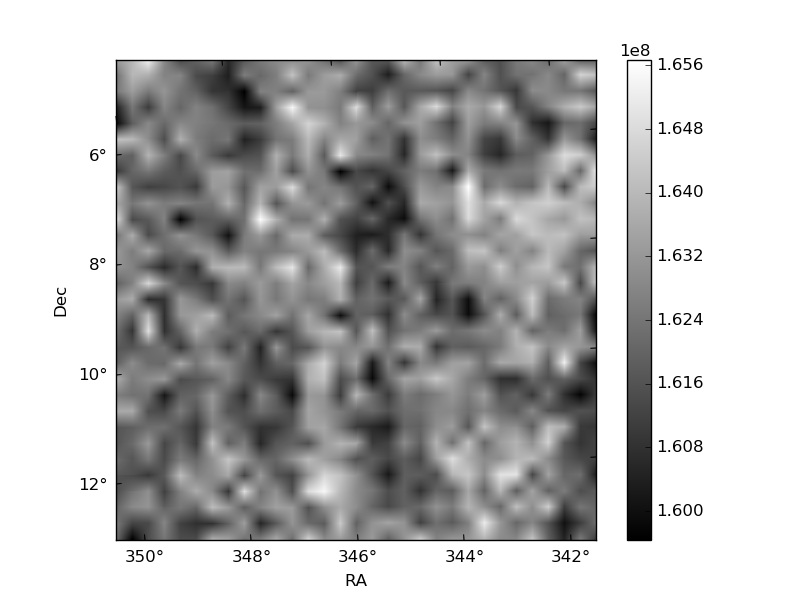
Histogram calculated using DETX and DETY for each event in the final _common_clean file
| Quadrant A | 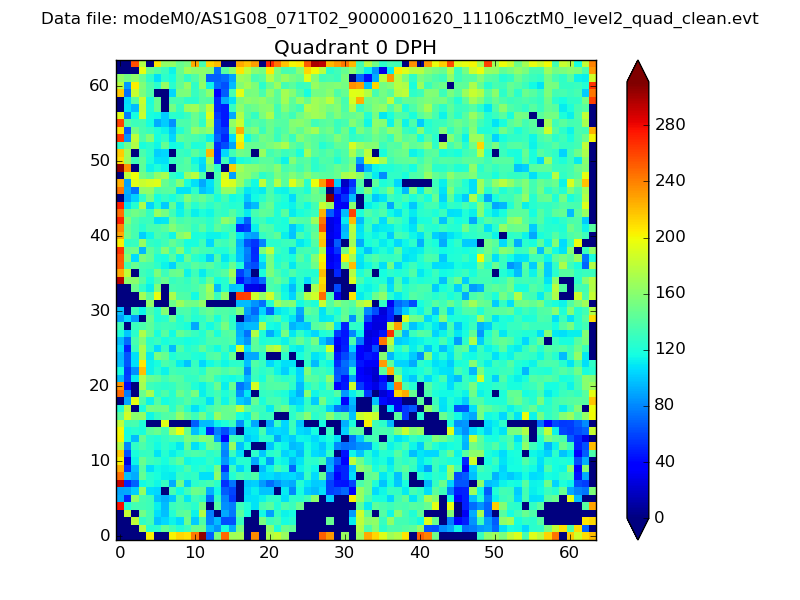 |
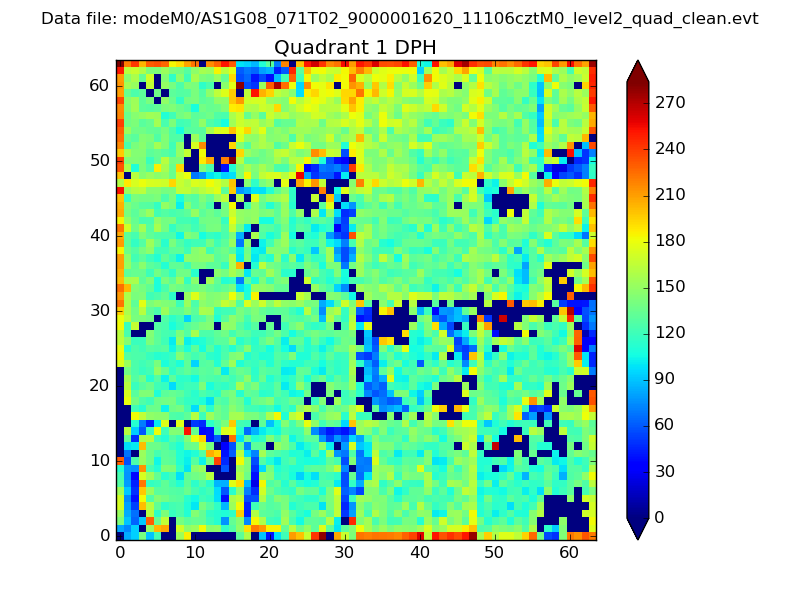 |
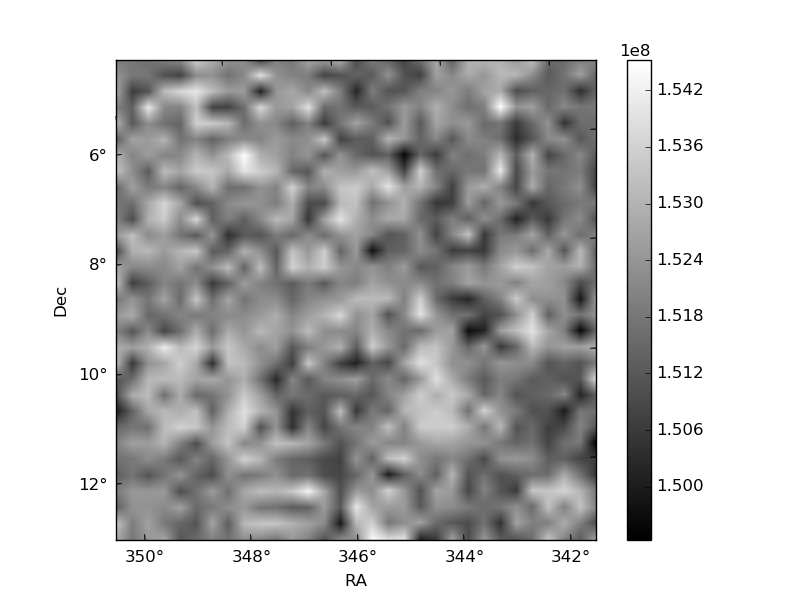
Quadrant B |
|---|---|---|---|
| Quadrant D | 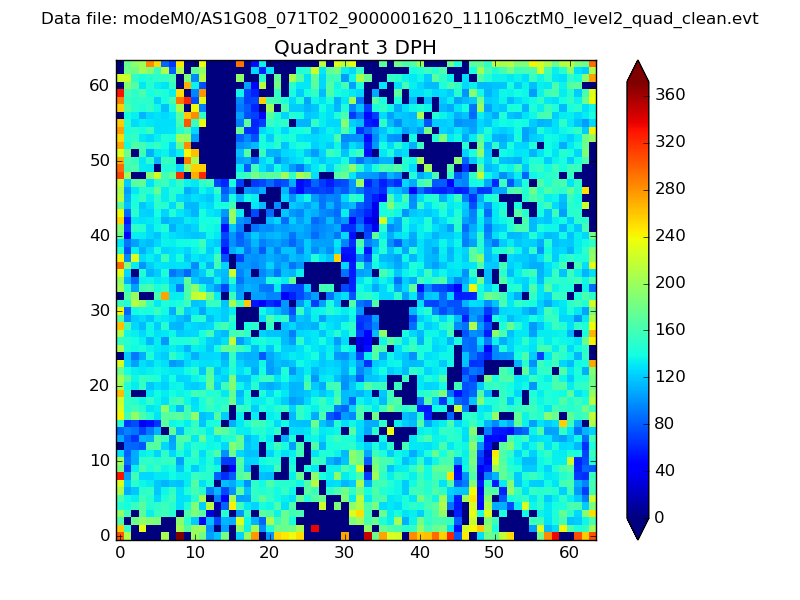 |
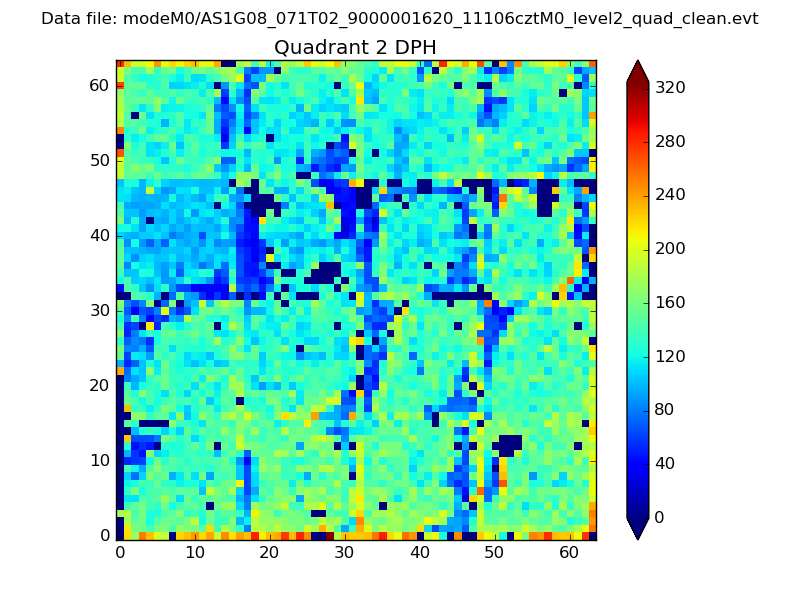 |
Quadrant C |
| Plot type | Count rate plots | Images |
|---|---|---|
| Comparison with Poisson distribution Blue bars denote a histogram of data divided into 1 sec bins. Red curve is a Poisson curve with rate = median count rate of data. |
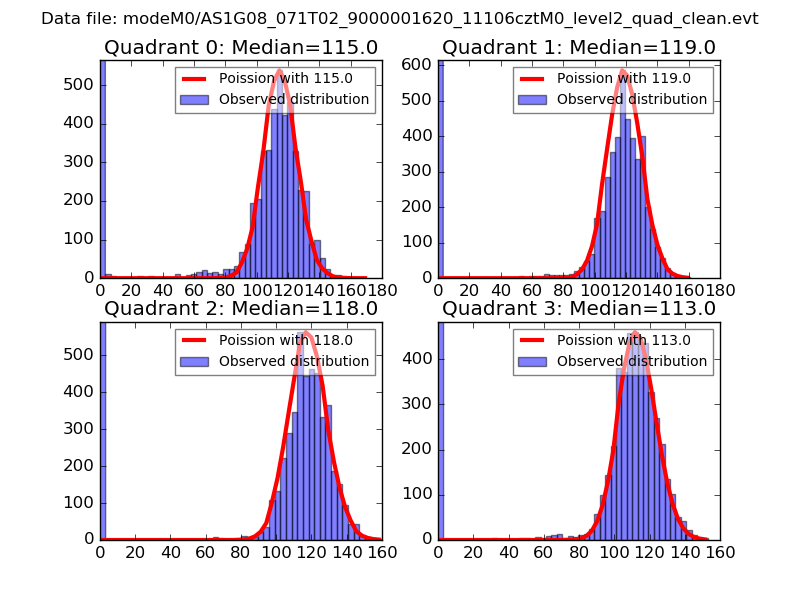 |
 |
| Quadrant-wise count rates Data is divided into 100 sec bins |
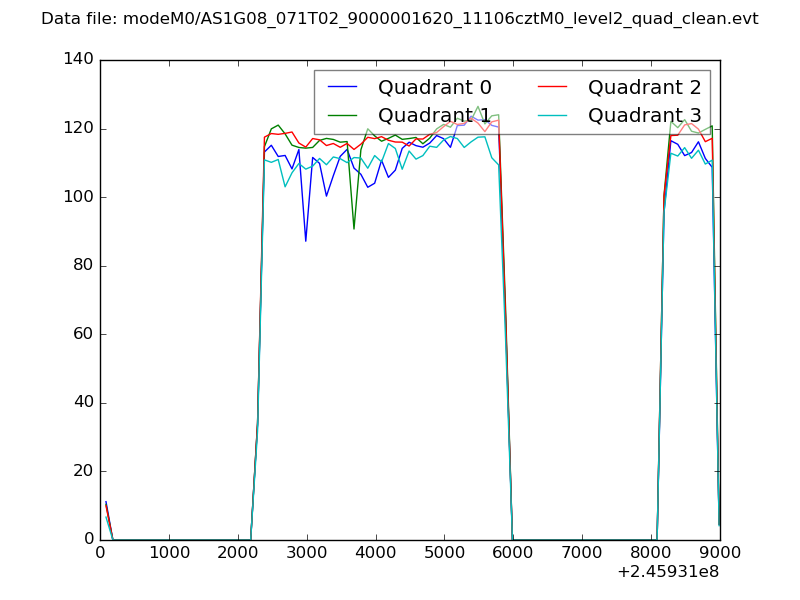 |
|
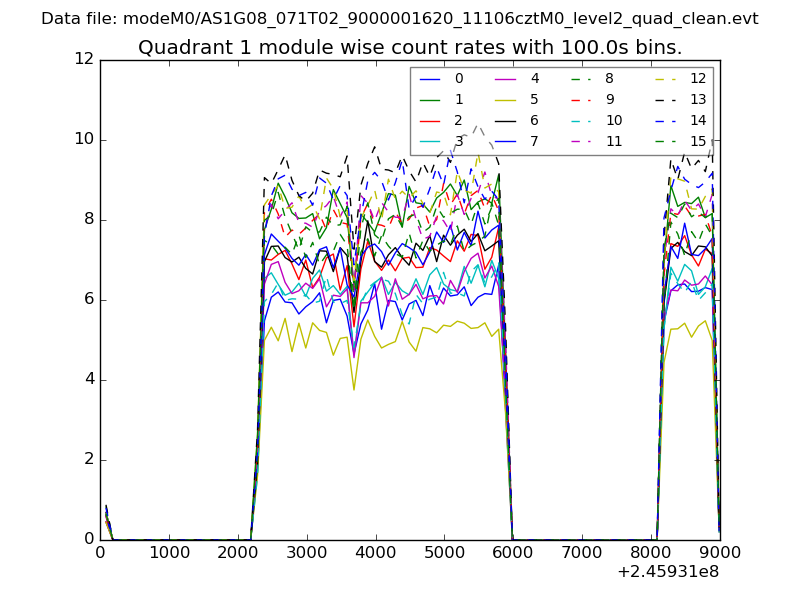
| Module-wise count rates for Quadrant A Data is divided into 100 sec bins |
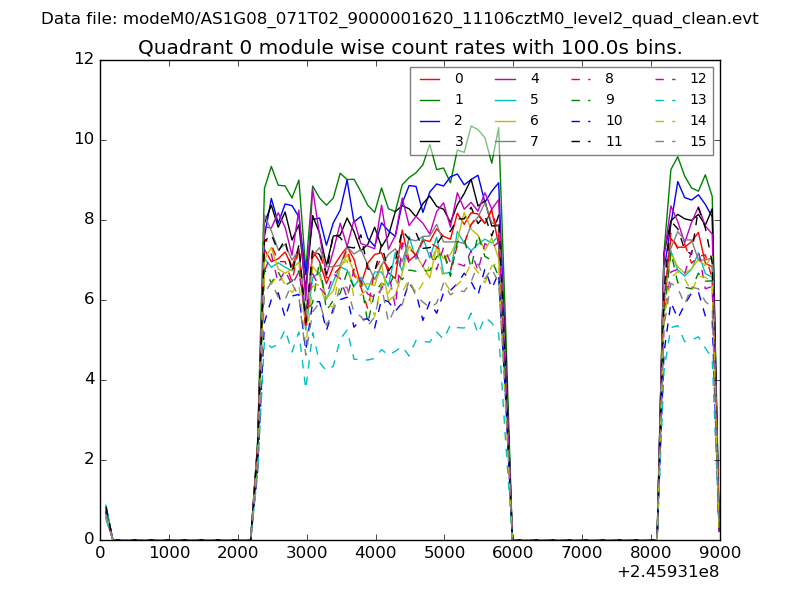 |
 |
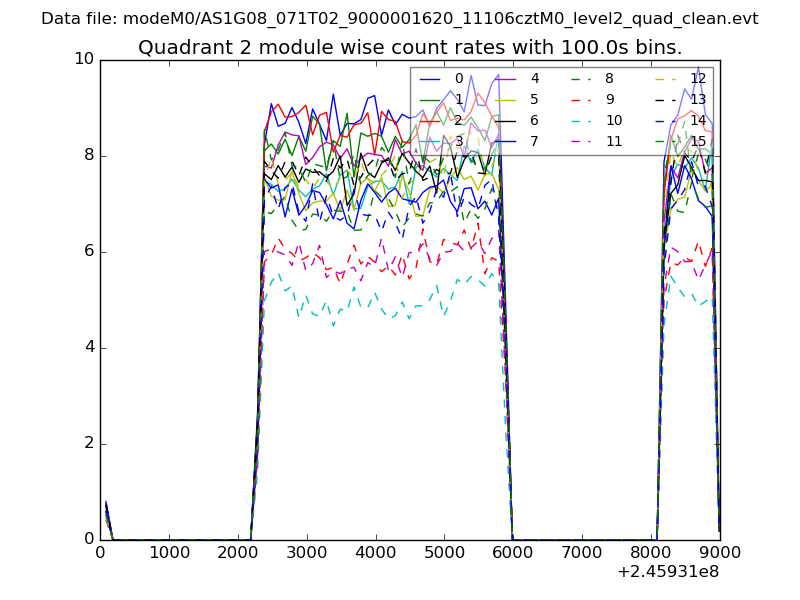
| Module-wise count rates for Quadrant B Data is divided into 100 sec bins |
 |
 |
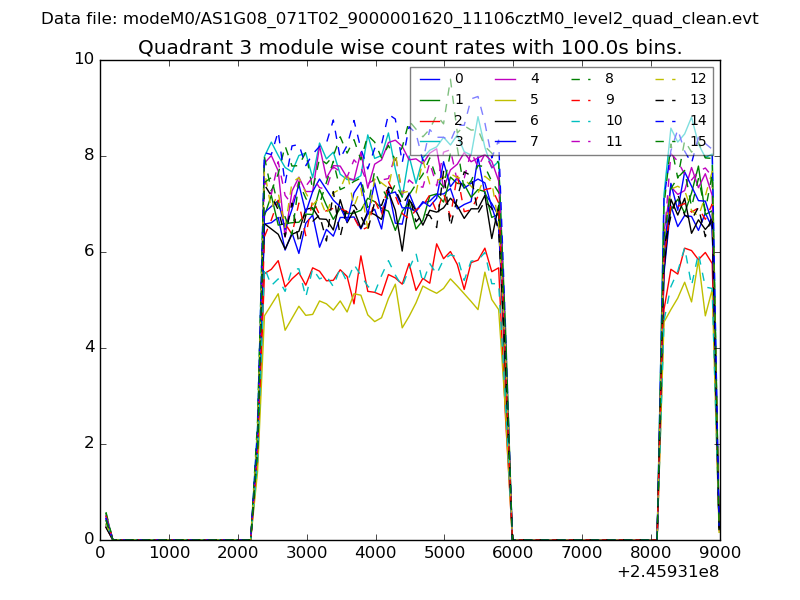
| Module-wise count rates for Quadrant C Data is divided into 100 sec bins |
 |
 |
| Module-wise count rates for Quadrant D Data is divided into 100 sec bins |
 |
 |
| Parameter | Plot |
|---|---|
| CZT HV Monitor | 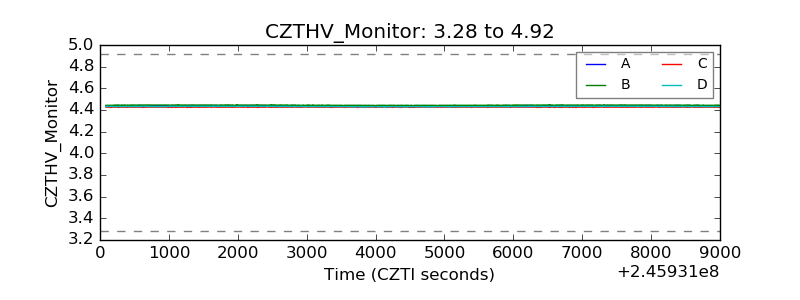 |
| D_VDD | 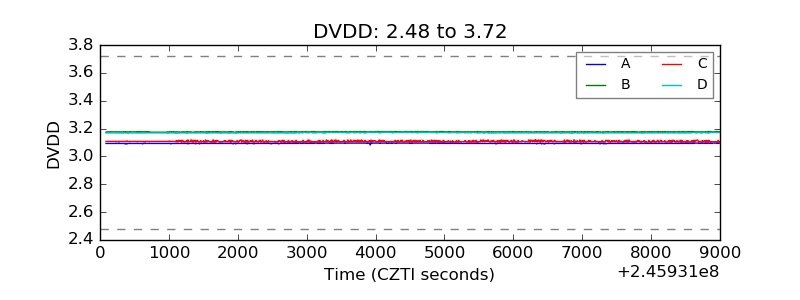 |
| Temperature 1 | 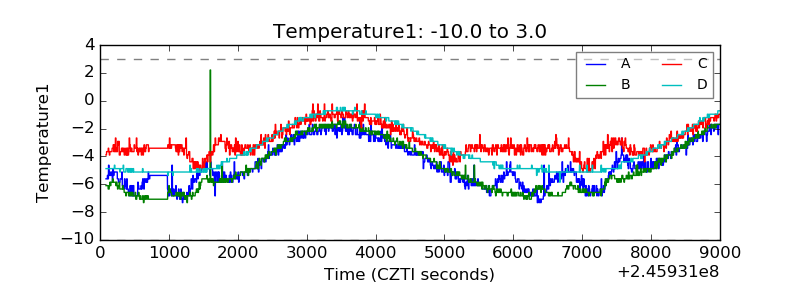 |
| Veto HV Monitor | 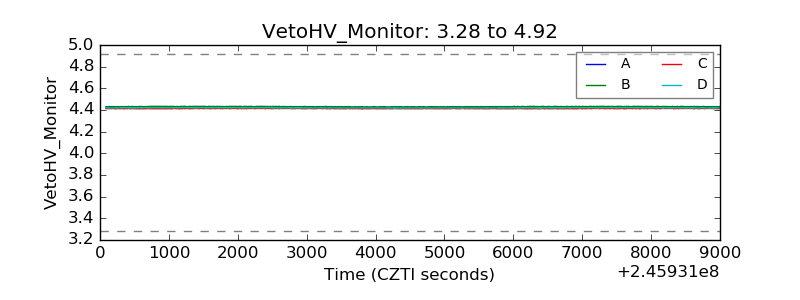 |
| Veto LLD | 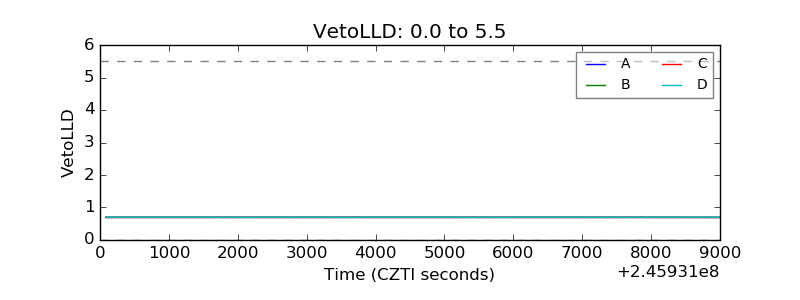 |
| Alpha Counter | 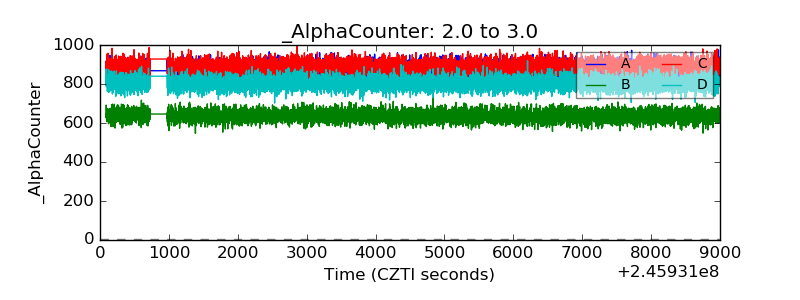 |
| _CPM_Rate | 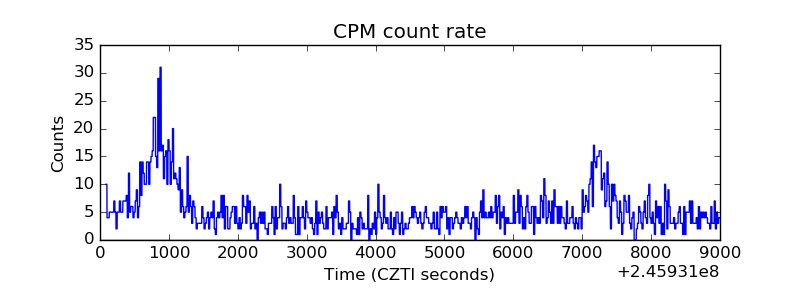 |
| CZT Counter | 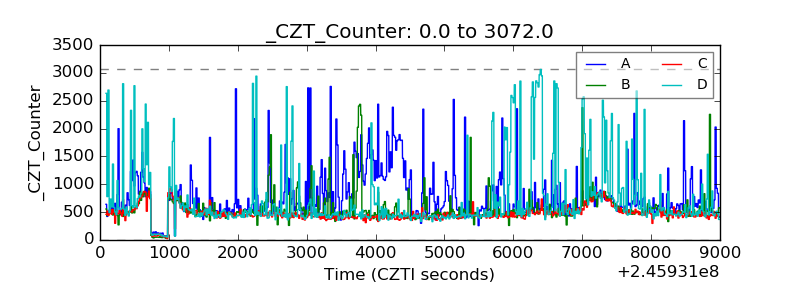 |
| +2.5 Volts monitor | 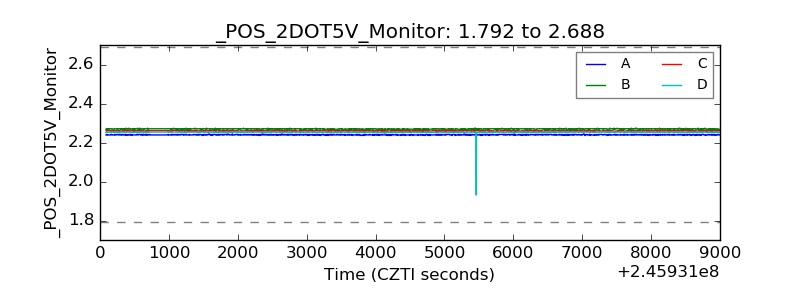 |
| +5 Volts monitor | 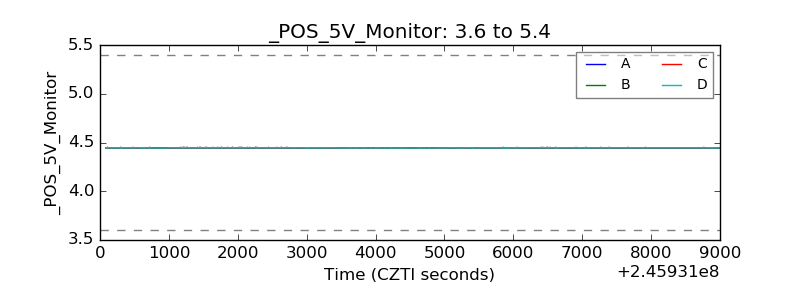 |
| _ROLL_ROT | 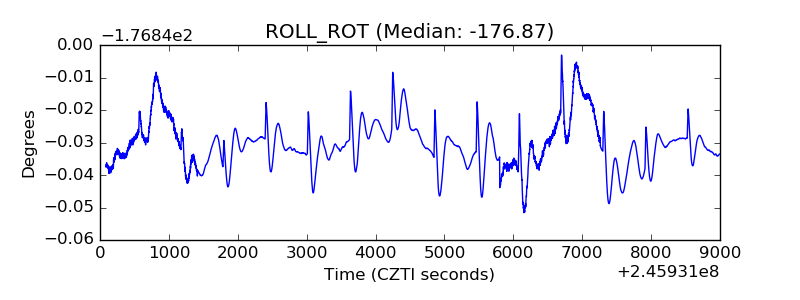 |
| _Roll_DEC | 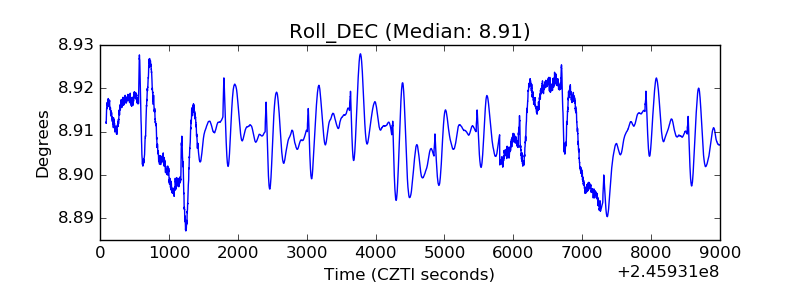 |
| _Roll_RA | 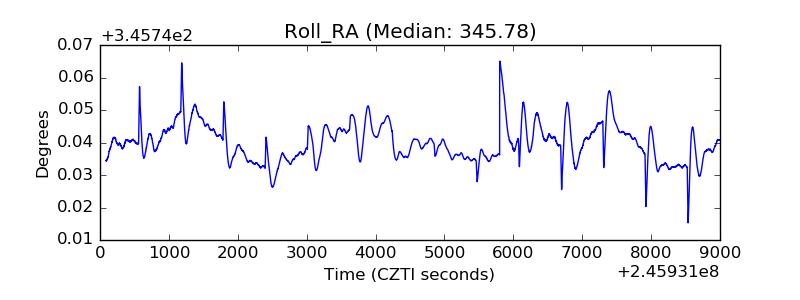 |
| Veto Counter | 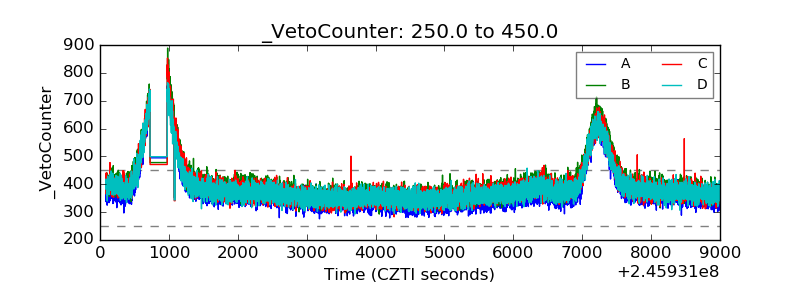 |