| Param | Original file | Final file |
|---|---|---|
| Filename | modeM0/AS1A04_010T02_9000002048_13903cztM0_level2.evt | modeM0/AS1A04_010T02_9000002048_13903cztM0_level2_quad_clean.evt |
| Size (bytes) | 1,046,623,680 | 156,729,600 |
| Size | 998.1 MB | 149.5 MB |
| Events in quadrant A | 7,182,380 | 982,087 |
| Events in quadrant B | 6,864,995 | 983,509 |
| Events in quadrant C | 6,236,103 | 972,837 |
| Events in quadrant D | 10,515,498 | 890,808 |
| Mode M0 | |||
|---|---|---|---|
| Quadrant | BADHDUFLAG | Total packets | Discarded packets |
| A | 0 | 30181 | 4 |
| B | 0 | 28891 | 3 |
| C | 0 | 27227 | 3 |
| D | 0 | 39722 | 3 |
| Mode SS | |||
|---|---|---|---|
| Quadrant | BADHDUFLAG | Total packets | Discarded packets |
| A | 0 | 272 | 0 |
| B | 0 | 272 | 0 |
| C | 0 | 272 | 0 |
| D | 0 | 272 | 0 |
| Mode M9 | |||
|---|---|---|---|
| Quadrant | BADHDUFLAG | Total packets | Discarded packets |
| A | 0 | 15 | 0 |
| B | 0 | 15 | 0 |
| C | 0 | 15 | 0 |
| D | 0 | 15 | 0 |
| Quadrant | Total seconds | Saturated seconds | Saturation percentage |
|---|---|---|---|
| A | 13270 | 588 | 4.431047% |
| B | 13270 | 438 | 3.300678% |
| C | 13270 | 241 | 1.816127% |
| D | 13270 | 1735 | 13.074604% |
Noise dominated data is calculated using 1-second bins in cleaned event files. If a bin has >2000 counts, and if more than 50% of those come from <1% of pixels, then it is considered to be noise-dominated and hence unusable.
| Quadrant | # 1 sec bins | Bins with >0 counts | Bins with >2000 counts | High rate bins dominated by noise | Noise dominated (total time) | Noise dominated (detector-on time) | Marked lightcurve |
|---|---|---|---|---|---|---|---|
| A | 14881 | 13271 | 247 | 247 | 1.66% | 1.86% | 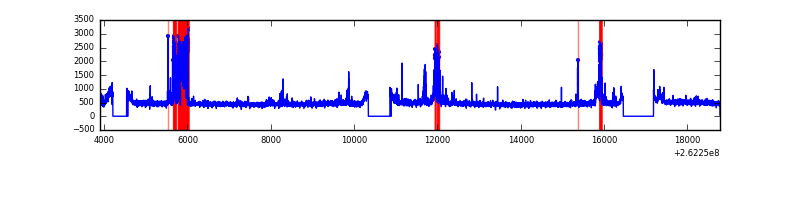 |
| B | 14881 | 13272 | 98 | 98 | 0.66% | 0.74% | 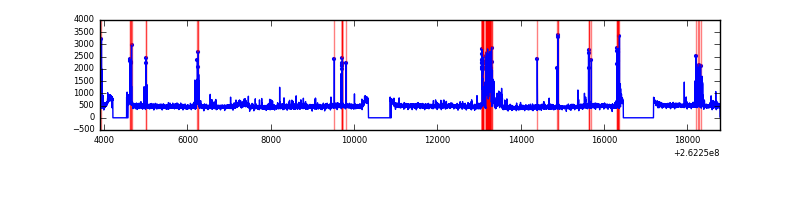 |
| C | 14881 | 13273 | 0 | 0 | 0.00% | 0.00% | 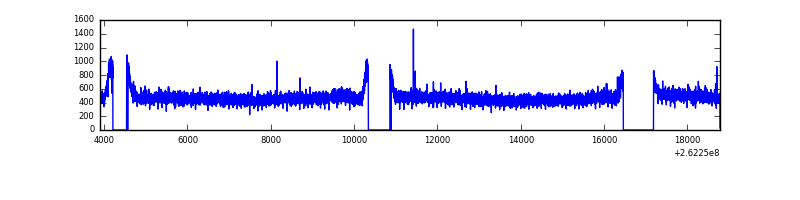 |
| D | 14881 | 13272 | 1389 | 1389 | 9.33% | 10.47% | 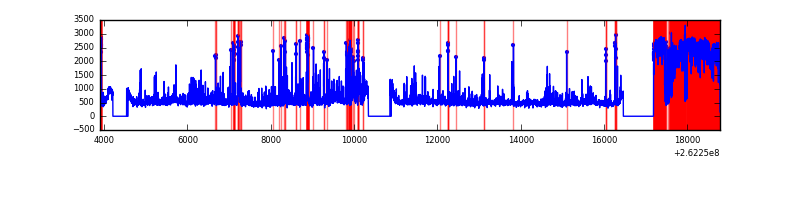 |
Top three noisy pixels from each quadrant. If the there are fewer than three noisy pixels in the level2.evt file, extra rows are filled as -1
| Pixel properties | Quadrant properties | ||||||
|---|---|---|---|---|---|---|---|
| Quadrant | DetID | PixID | Counts | Sigma | Mean | Median | Sigma |
| A | 9 | 143 | 878875 | 2719.29 | 1583 | 1542 | 322.6 |
| A | 15 | 69 | 110814 | 338.69 | 1583 | 1542 | 322.6 |
| A | 14 | 111 | 38270 | 113.84 | 1583 | 1542 | 322.6 |
| B | 10 | 244 | 339639 | 1101.38 | 1583 | 1541 | 307.0 |
| B | 4 | 80 | 175659 | 567.2 | 1583 | 1541 | 307.0 |
| B | 15 | 201 | 45403 | 142.88 | 1583 | 1541 | 307.0 |
| C | 3 | 233 | 179241 | 491.28 | 1552 | 1557 | 361.7 |
| C | 13 | 61 | 10909 | 25.86 | 1552 | 1557 | 361.7 |
| C | 14 | 220 | 5859 | 11.89 | 1552 | 1557 | 361.7 |
| D | 13 | 122 | 3633888 | 10664.13 | 1436 | 1401 | 340.6 |
| D | 1 | 52 | 455543 | 1333.25 | 1436 | 1401 | 340.6 |
| D | 5 | 222 | 405982 | 1187.76 | 1436 | 1401 | 340.6 |
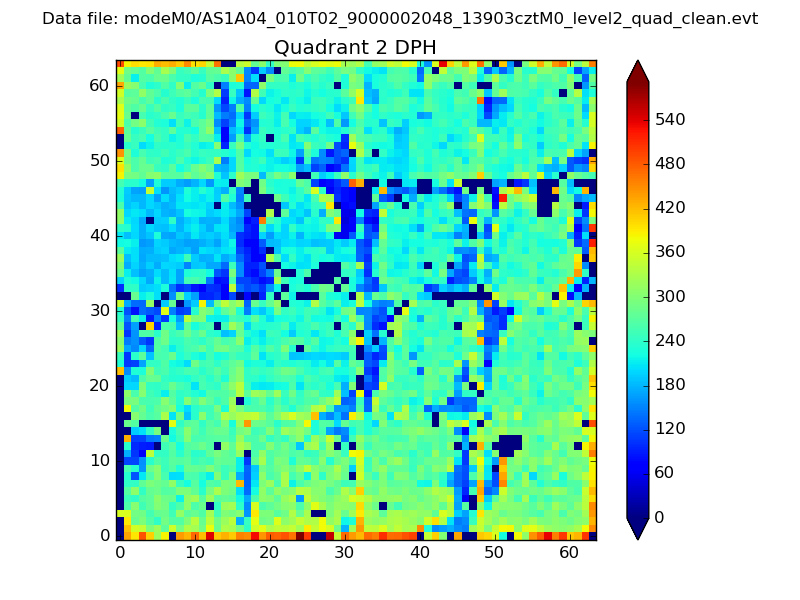
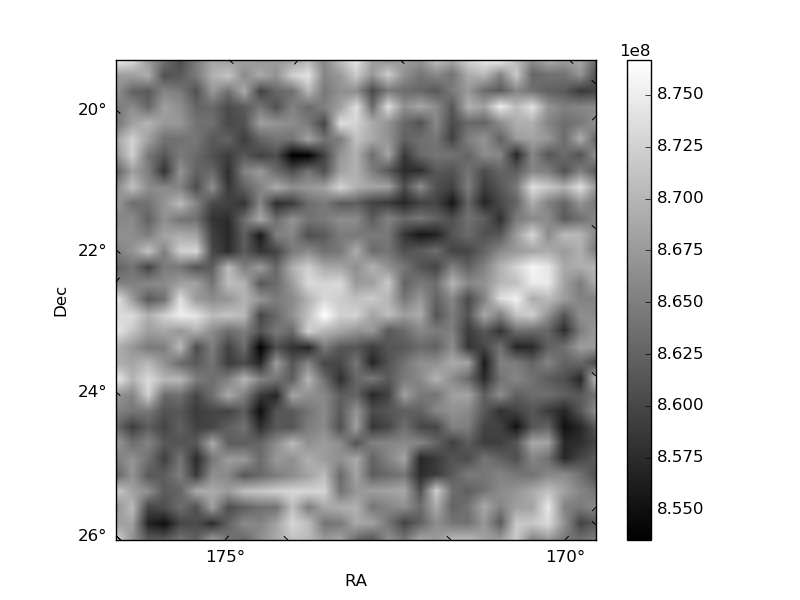
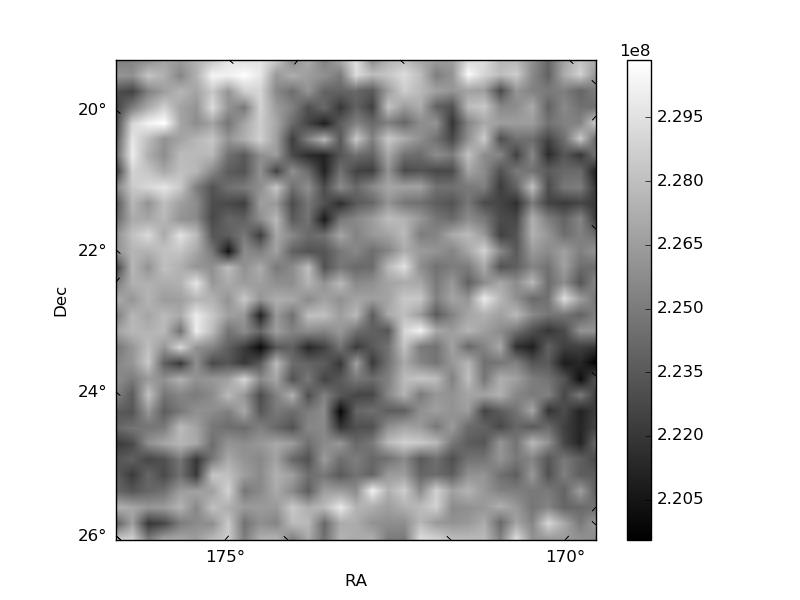
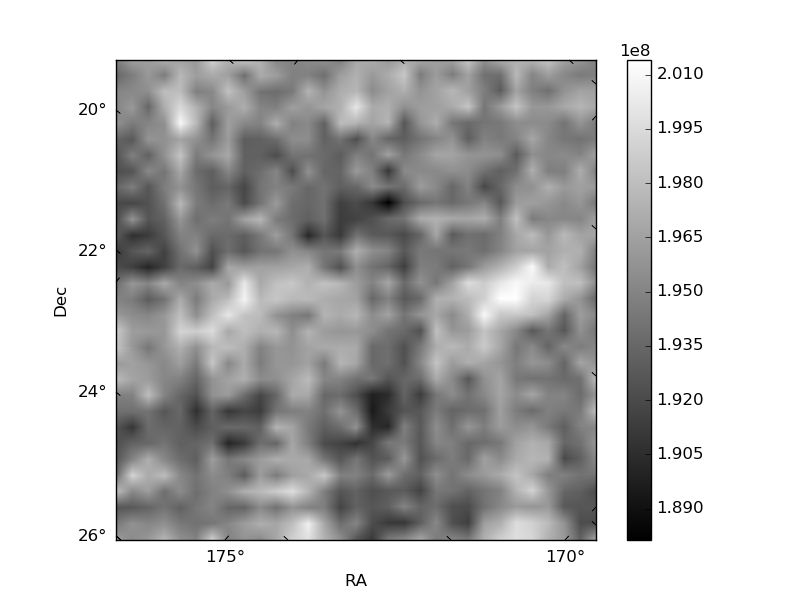
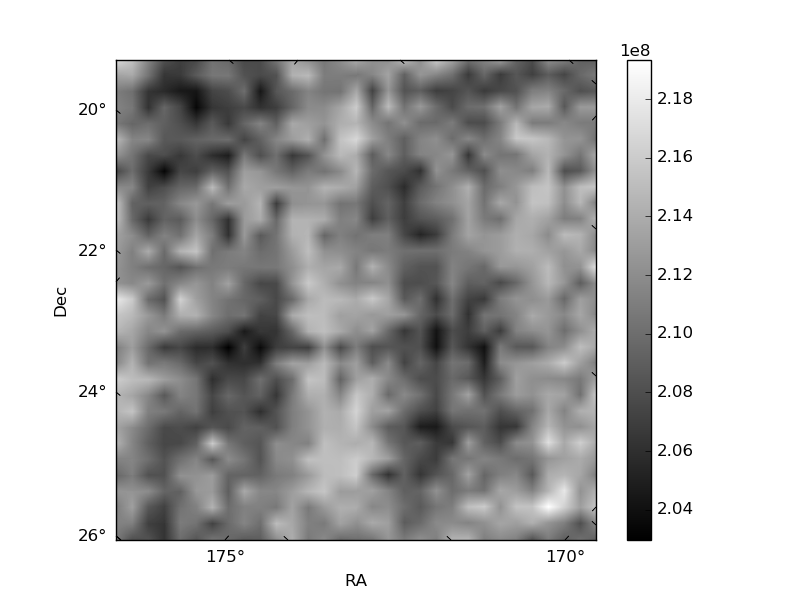
Histogram calculated using DETX and DETY for each event in the final _common_clean file
| Quadrant A | 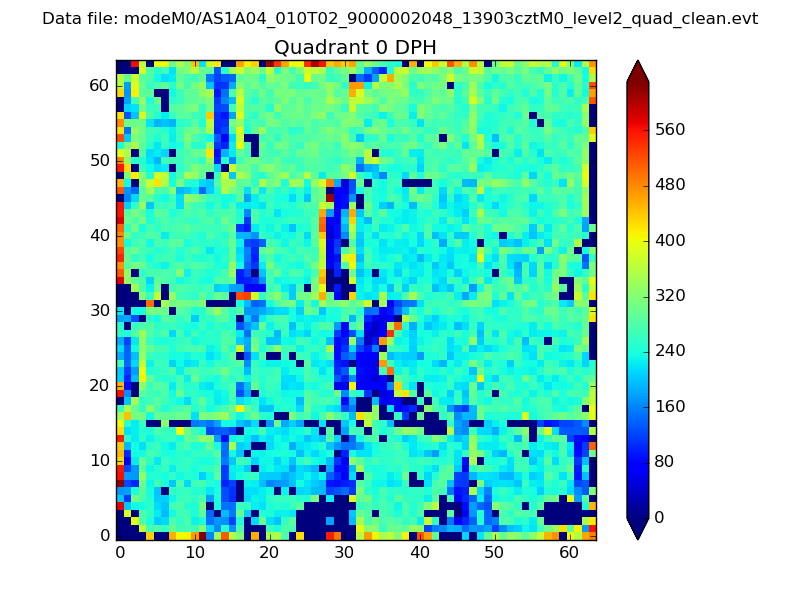 |
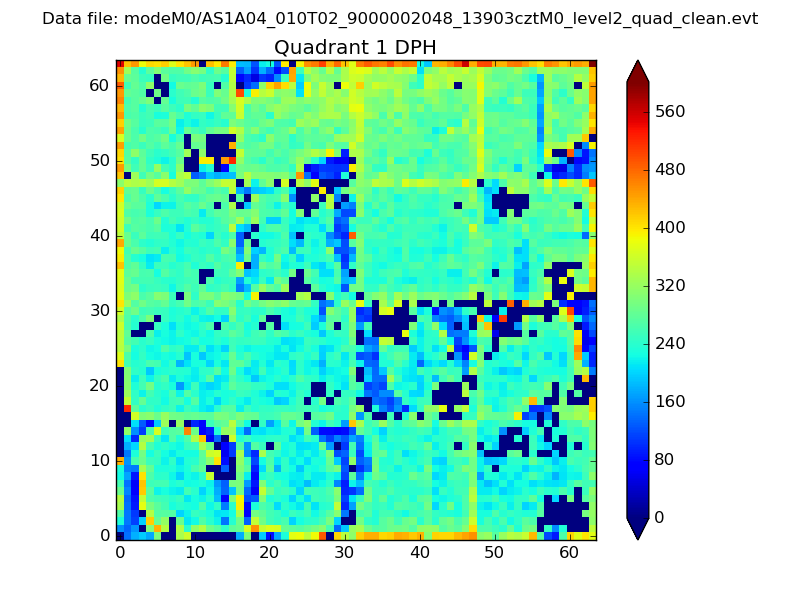 |
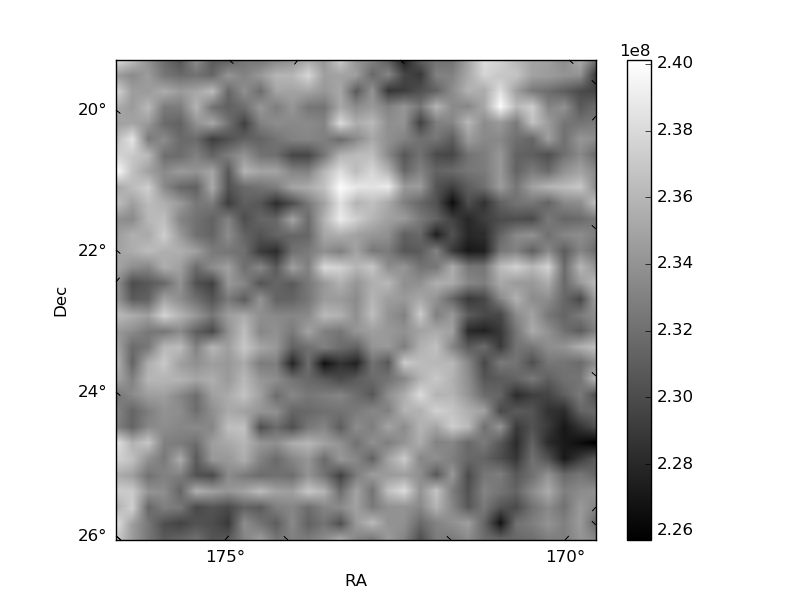
Quadrant B |
|---|---|---|---|
| Quadrant D | 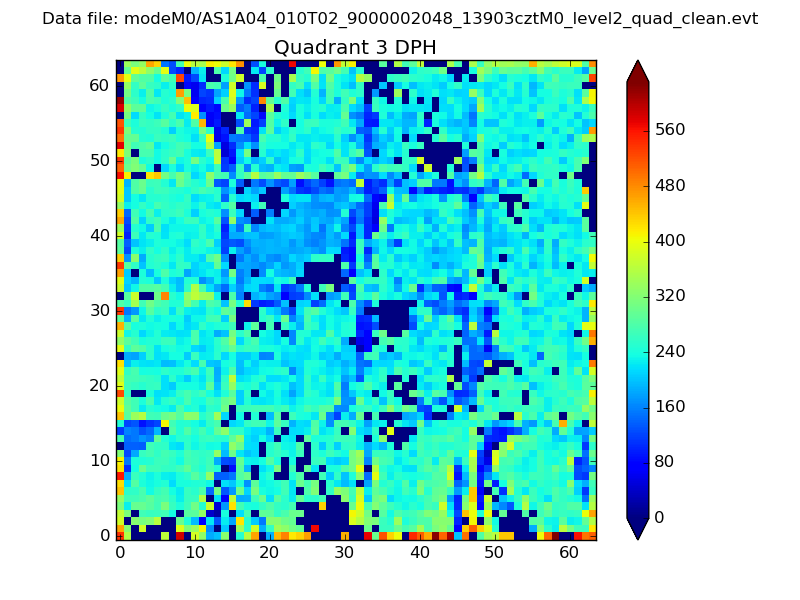 |
 |
Quadrant C |
| Plot type | Count rate plots | Images |
|---|---|---|
| Comparison with Poisson distribution Blue bars denote a histogram of data divided into 1 sec bins. Red curve is a Poisson curve with rate = median count rate of data. |
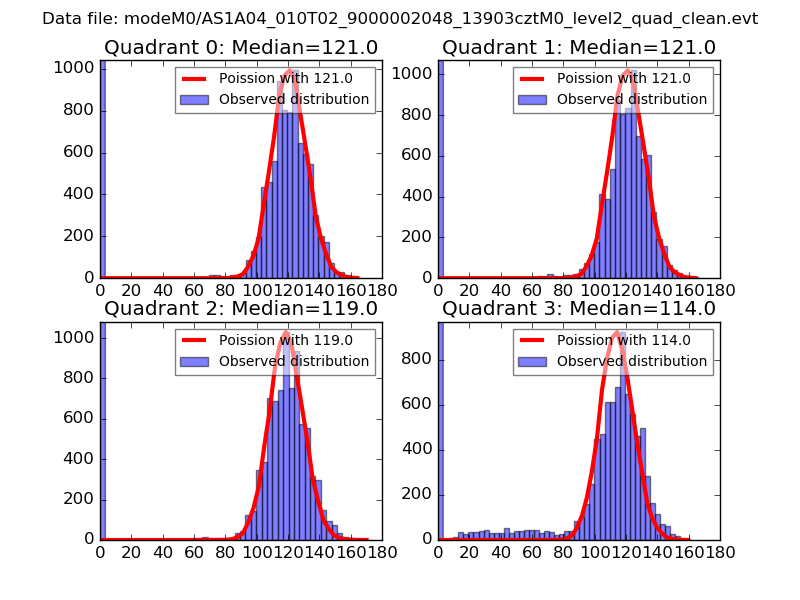 |
 |
| Quadrant-wise count rates Data is divided into 100 sec bins |
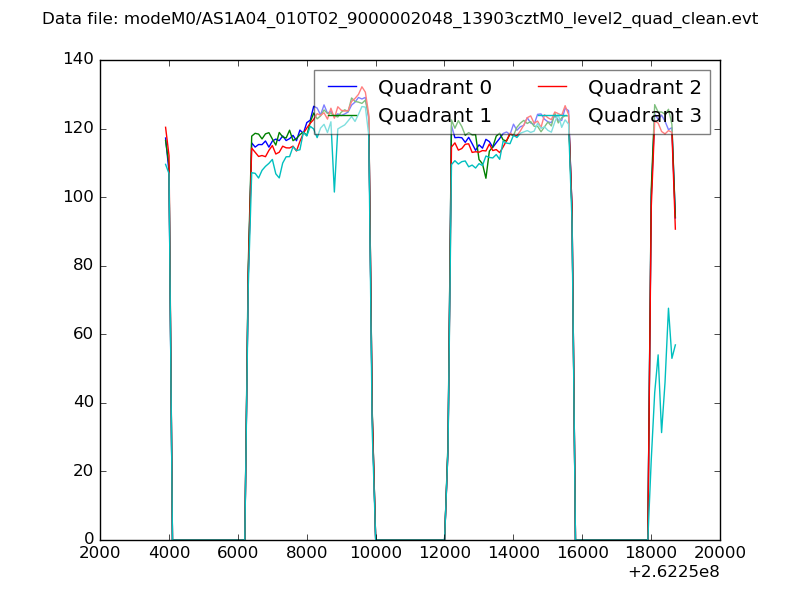 |
|
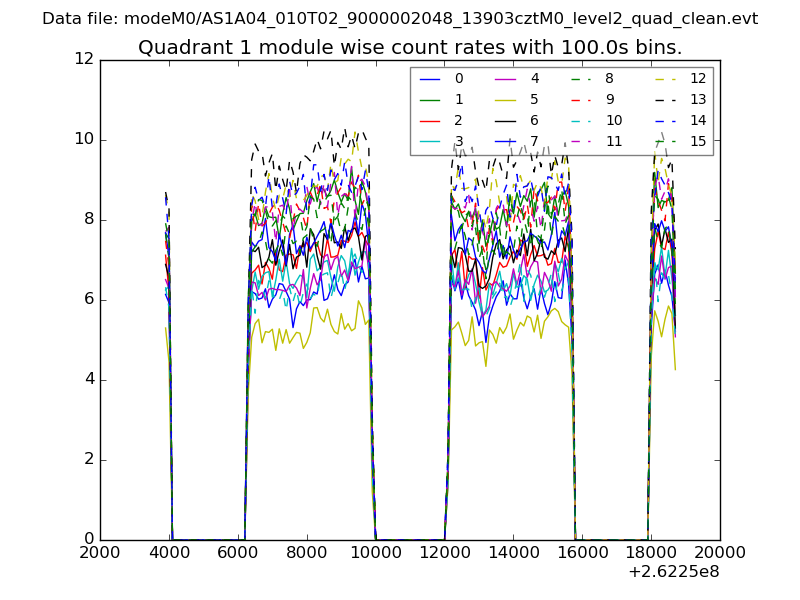
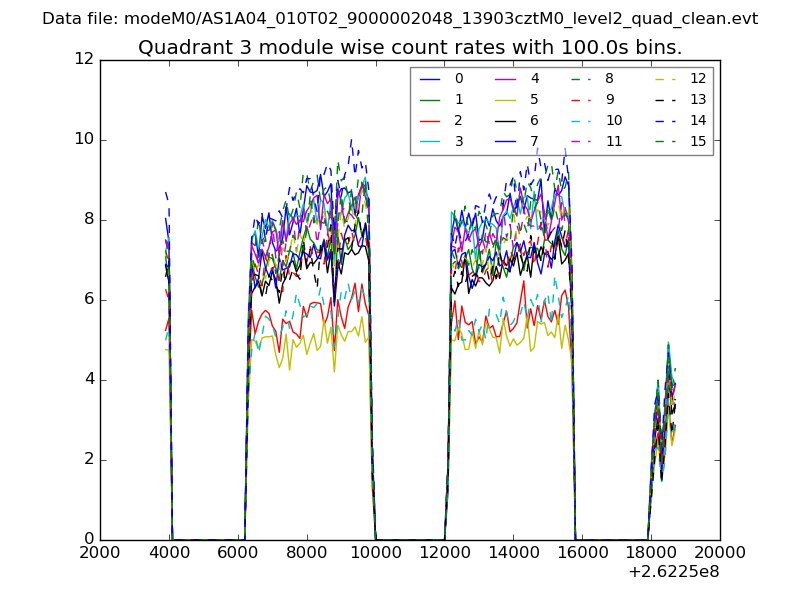
| Module-wise count rates for Quadrant A Data is divided into 100 sec bins |
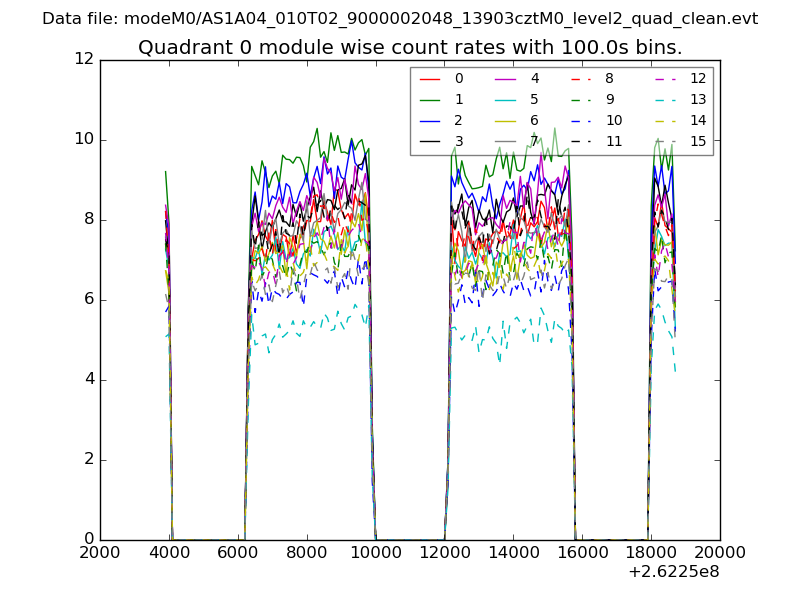 |
 |
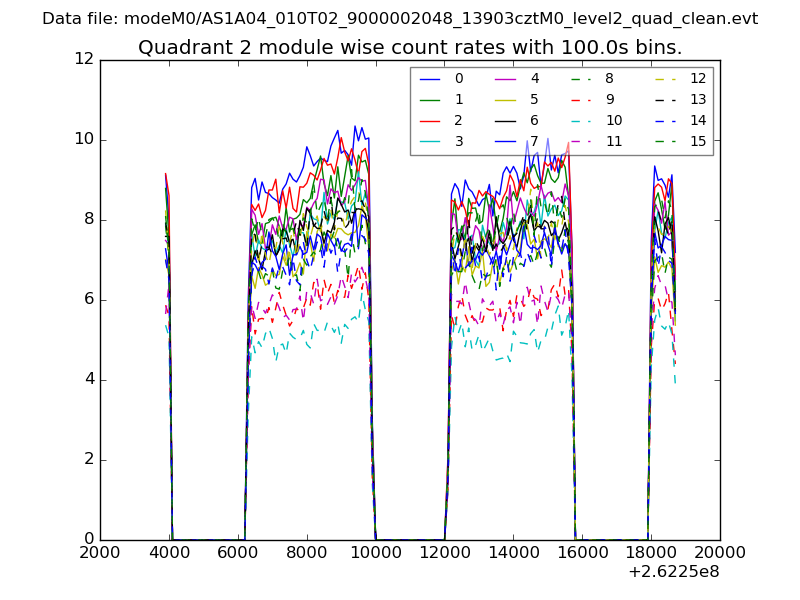
| Module-wise count rates for Quadrant B Data is divided into 100 sec bins |
 |
 |
| Module-wise count rates for Quadrant C Data is divided into 100 sec bins |
 |
 |
| Module-wise count rates for Quadrant D Data is divided into 100 sec bins |
 |
 |
| Parameter | Plot |
|---|---|
| CZT HV Monitor | 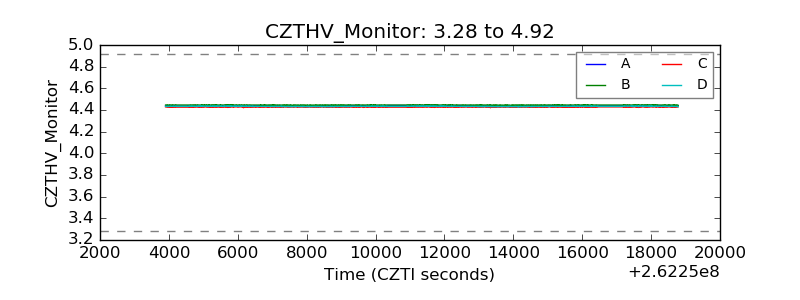 |
| D_VDD | 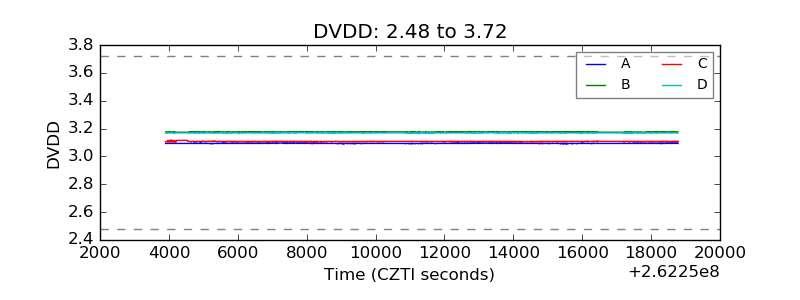 |
| Temperature 1 | 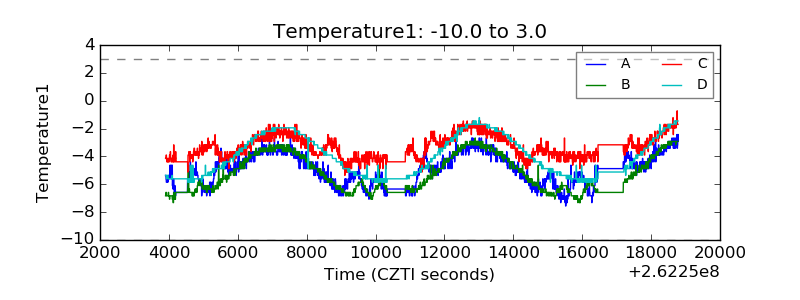 |
| Veto HV Monitor | 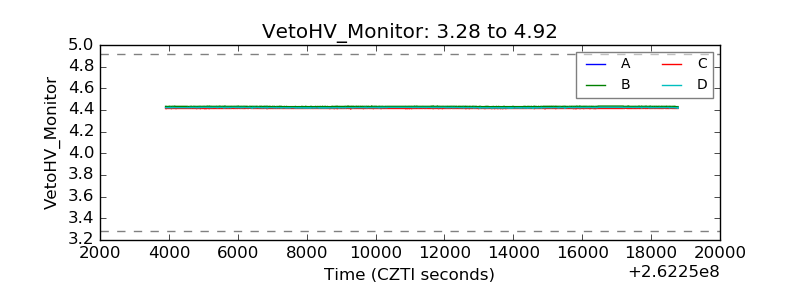 |
| Veto LLD | 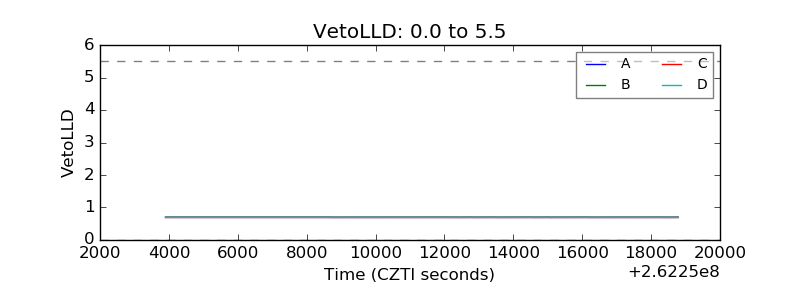 |
| Alpha Counter | 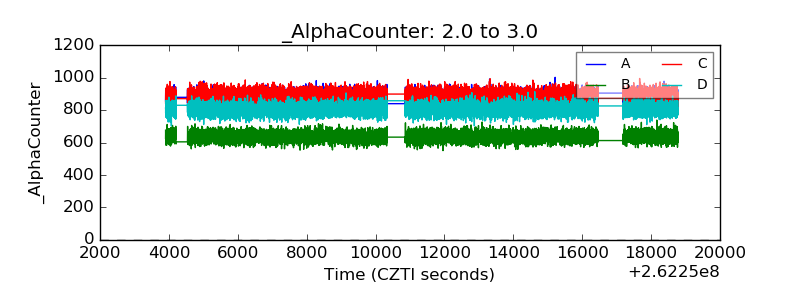 |
| _CPM_Rate | 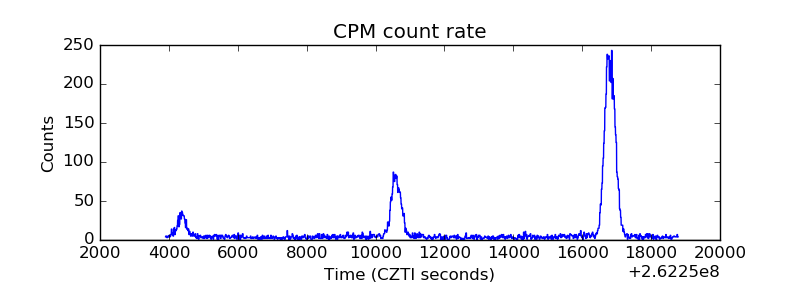 |
| CZT Counter | 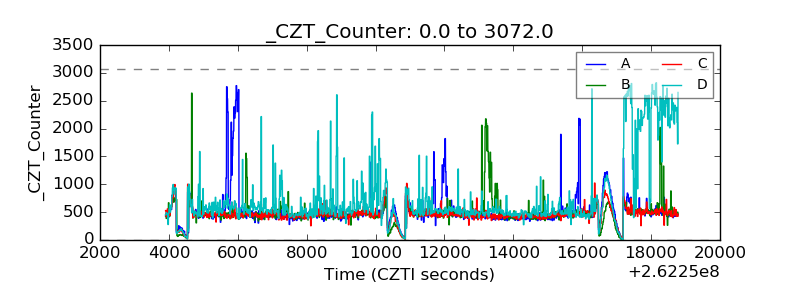 |
| +2.5 Volts monitor | 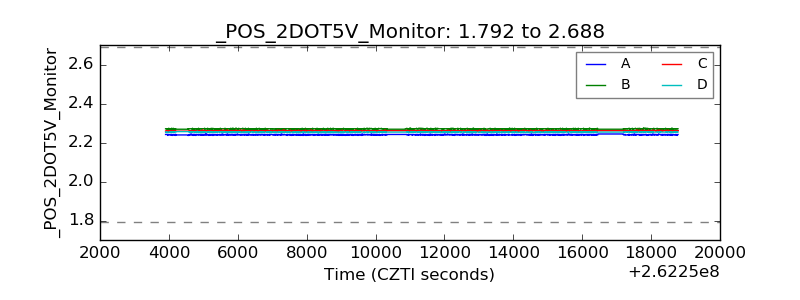 |
| +5 Volts monitor | 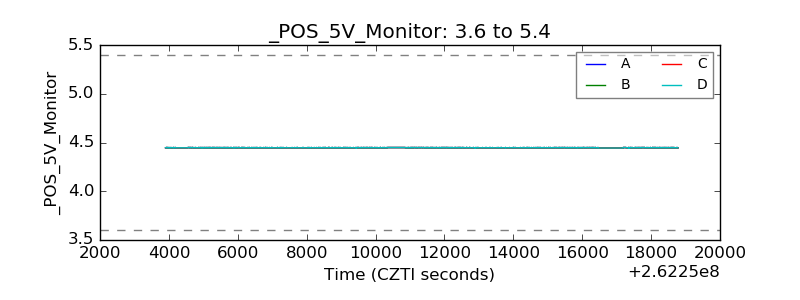 |
| _ROLL_ROT | 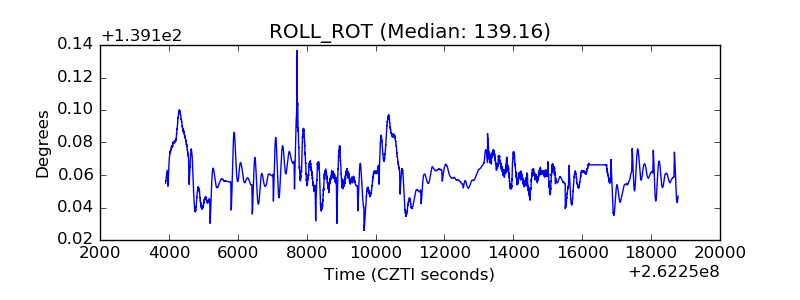 |
| _Roll_DEC | 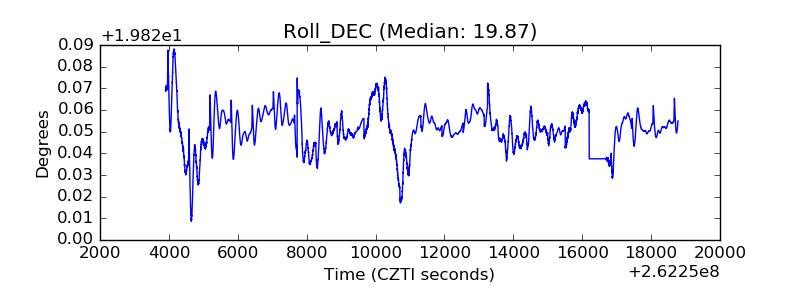 |
| _Roll_RA | 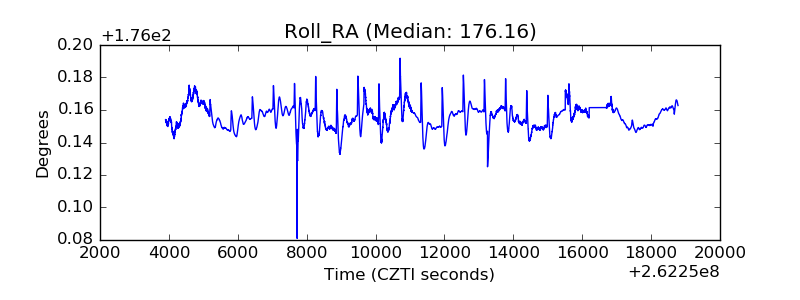 |
| Veto Counter | 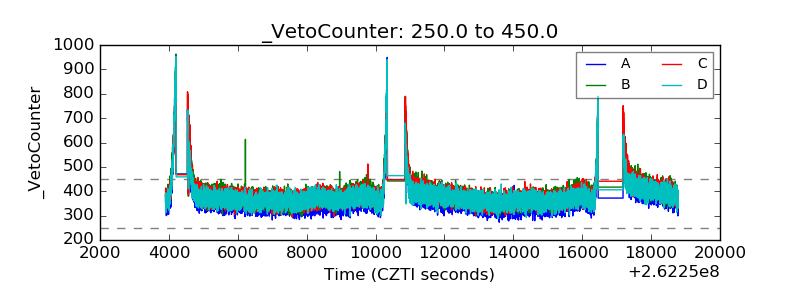 |