| Param | Original file | Final file |
|---|---|---|
| Filename | modeM0/AS1G08_045T01_9000002092_14154cztM0_level2.evt | modeM0/AS1G08_045T01_9000002092_14154cztM0_level2_quad_clean.evt |
| Size (bytes) | 504,469,440 | 68,855,040 |
| Size | 481.1 MB | 65.7 MB |
| Events in quadrant A | 3,235,975 | 421,148 |
| Events in quadrant B | 4,304,296 | 435,206 |
| Events in quadrant C | 3,304,390 | 404,384 |
| Events in quadrant D | 4,010,707 | 389,196 |
| Mode M9 | |||
|---|---|---|---|
| Quadrant | BADHDUFLAG | Total packets | Discarded packets |
| A | 0 | 12 | 0 |
| B | 0 | 12 | 0 |
| C | 0 | 12 | 0 |
| D | 0 | 12 | 0 |
| Mode SS | |||
|---|---|---|---|
| Quadrant | BADHDUFLAG | Total packets | Discarded packets |
| A | 0 | 126 | 0 |
| B | 0 | 126 | 0 |
| C | 0 | 126 | 0 |
| D | 0 | 126 | 0 |
| Mode M0 | |||
|---|---|---|---|
| Quadrant | BADHDUFLAG | Total packets | Discarded packets |
| A | 0 | 13413 | 2 |
| B | 0 | 16667 | 1 |
| C | 0 | 13381 | 1 |
| D | 0 | 16217 | 1 |
| Quadrant | Total seconds | Saturated seconds | Saturation percentage |
|---|---|---|---|
| A | 6233 | 105 | 1.684582% |
| B | 6233 | 415 | 6.658110% |
| C | 6233 | 79 | 1.267447% |
| D | 6233 | 109 | 1.748757% |
Noise dominated data is calculated using 1-second bins in cleaned event files. If a bin has >2000 counts, and if more than 50% of those come from <1% of pixels, then it is considered to be noise-dominated and hence unusable.
| Quadrant | # 1 sec bins | Bins with >0 counts | Bins with >2000 counts | High rate bins dominated by noise | Noise dominated (total time) | Noise dominated (detector-on time) | Marked lightcurve |
|---|---|---|---|---|---|---|---|
| A | 7409 | 6234 | 0 | 0 | 0.00% | 0.00% | 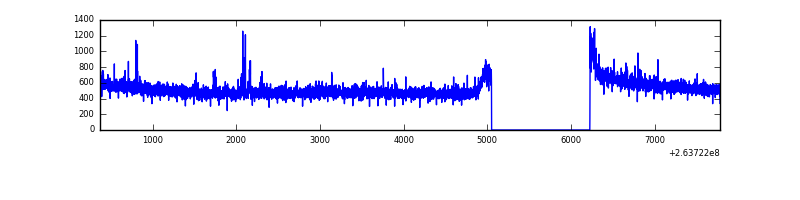 |
| B | 7409 | 6234 | 166 | 166 | 2.24% | 2.66% | 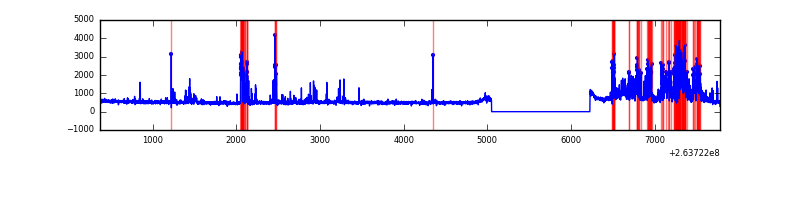 |
| C | 7409 | 6235 | 0 | 0 | 0.00% | 0.00% | 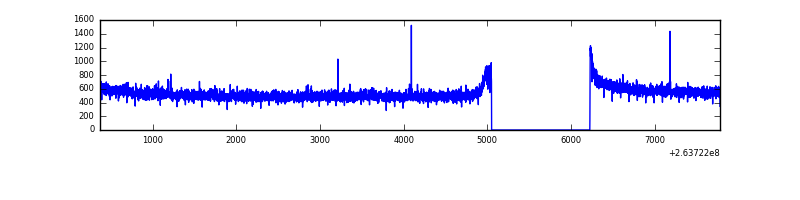 |
| D | 7409 | 6234 | 12 | 12 | 0.16% | 0.19% | 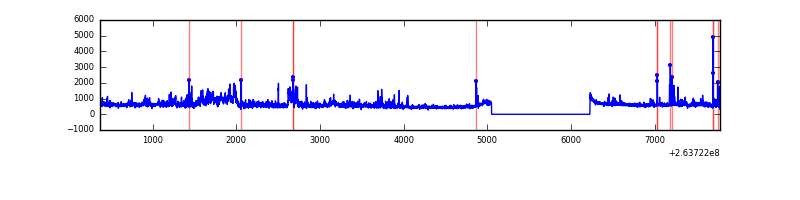 |
Top three noisy pixels from each quadrant. If the there are fewer than three noisy pixels in the level2.evt file, extra rows are filled as -1
| Pixel properties | Quadrant properties | ||||||
|---|---|---|---|---|---|---|---|
| Quadrant | DetID | PixID | Counts | Sigma | Mean | Median | Sigma |
| A | 8 | 15 | 21343 | 123.56 | 830 | 814 | 166.1 |
| A | 9 | 143 | 17985 | 103.35 | 830 | 814 | 166.1 |
| A | 0 | 226 | 7401 | 39.65 | 830 | 814 | 166.1 |
| B | 0 | 85 | 983659 | 6477.42 | 811 | 795 | 151.7 |
| B | 0 | 189 | 63106 | 410.65 | 811 | 795 | 151.7 |
| B | 3 | 209 | 31346 | 201.34 | 811 | 795 | 151.7 |
| C | 3 | 233 | 212041 | 1171.19 | 791 | 796 | 180.4 |
| C | 13 | 61 | 5650 | 26.91 | 791 | 796 | 180.4 |
| C | 10 | 22 | 5518 | 26.18 | 791 | 796 | 180.4 |
| D | 1 | 52 | 336352 | 1789.82 | 794 | 775 | 187.5 |
| D | 12 | 110 | 272882 | 1451.3 | 794 | 775 | 187.5 |
| D | 2 | 152 | 183391 | 974.0 | 794 | 775 | 187.5 |
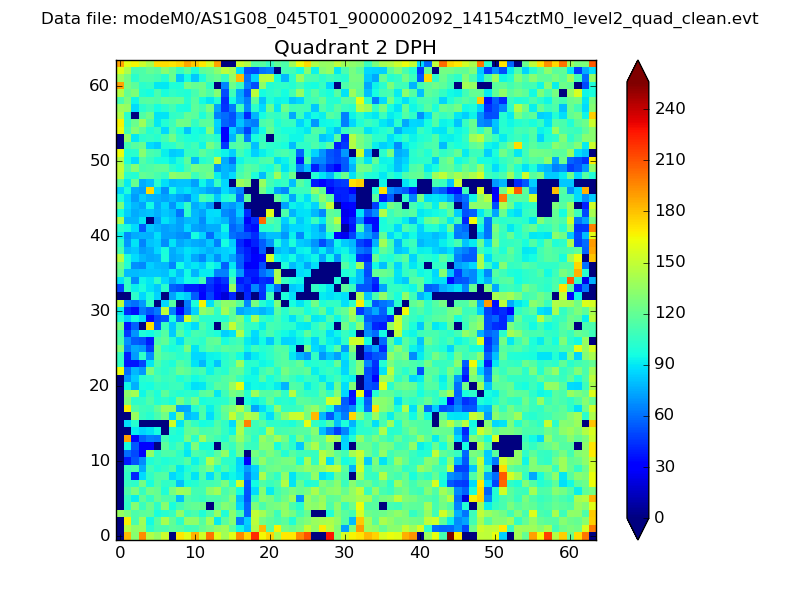
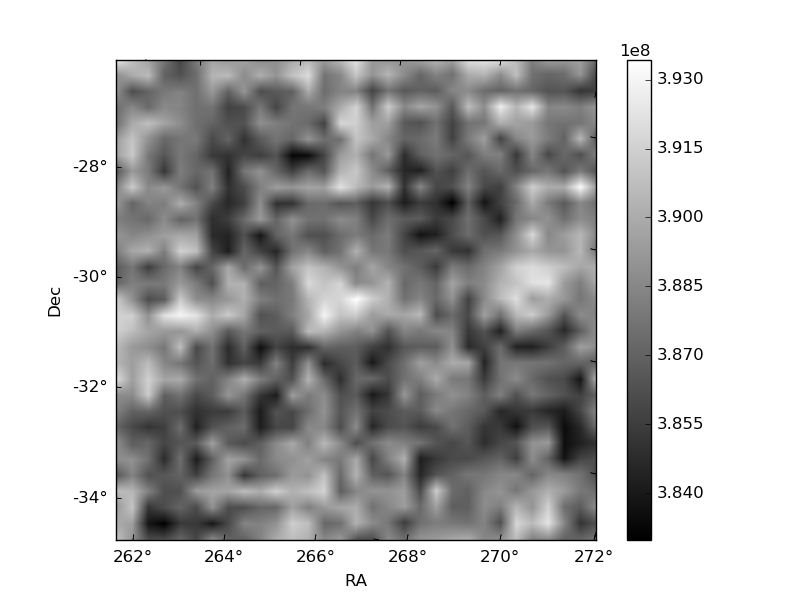
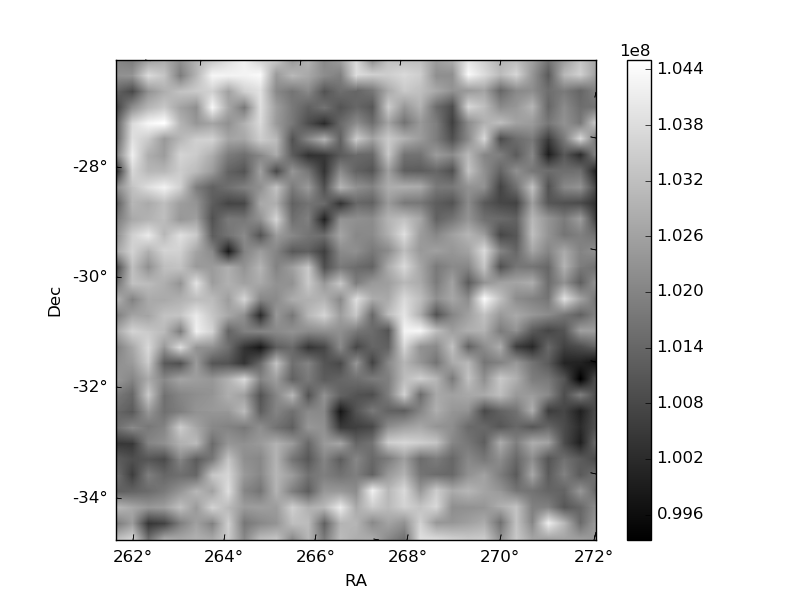
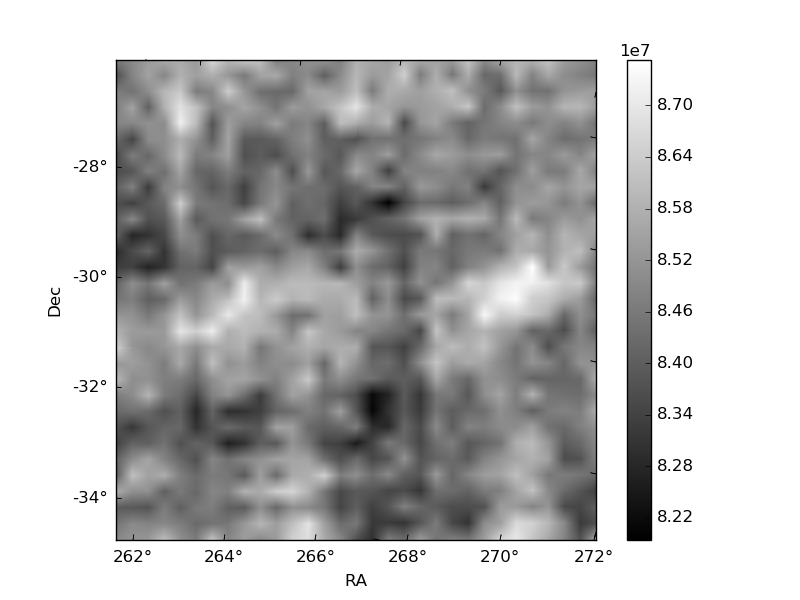
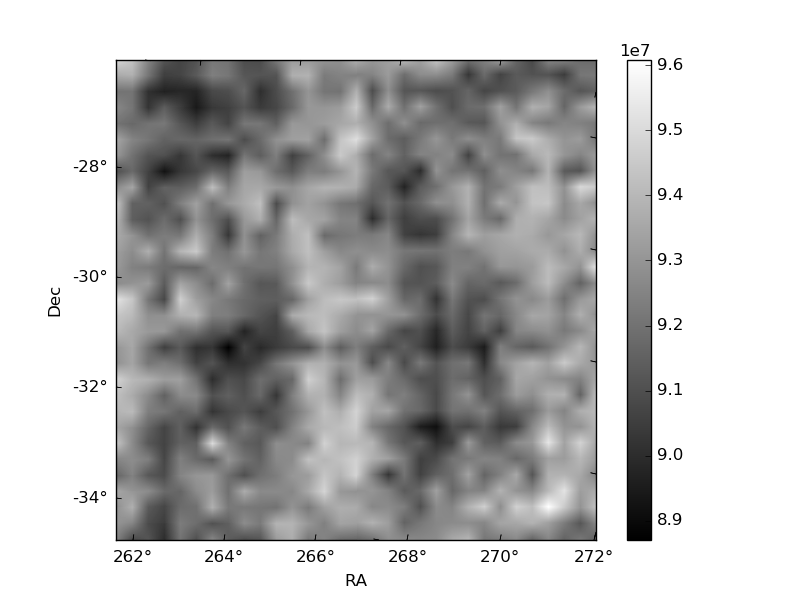
Histogram calculated using DETX and DETY for each event in the final _common_clean file
| Quadrant A | 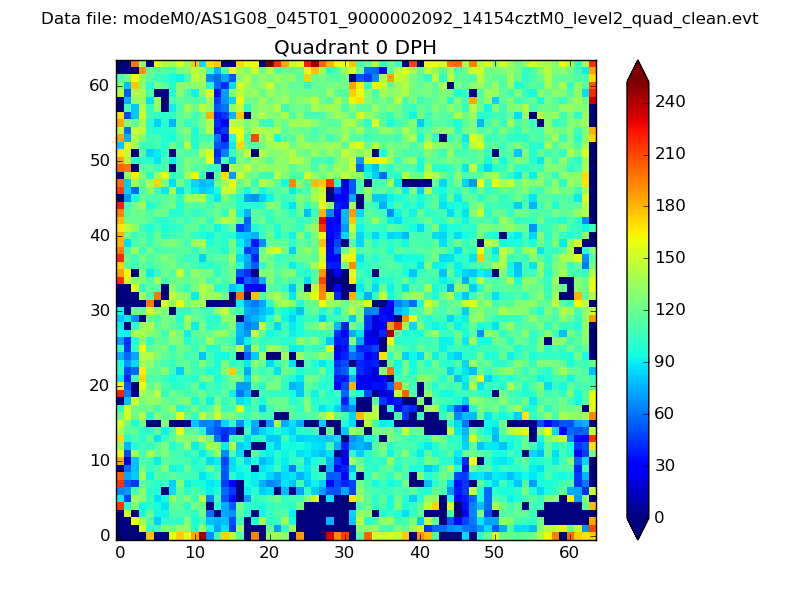 |
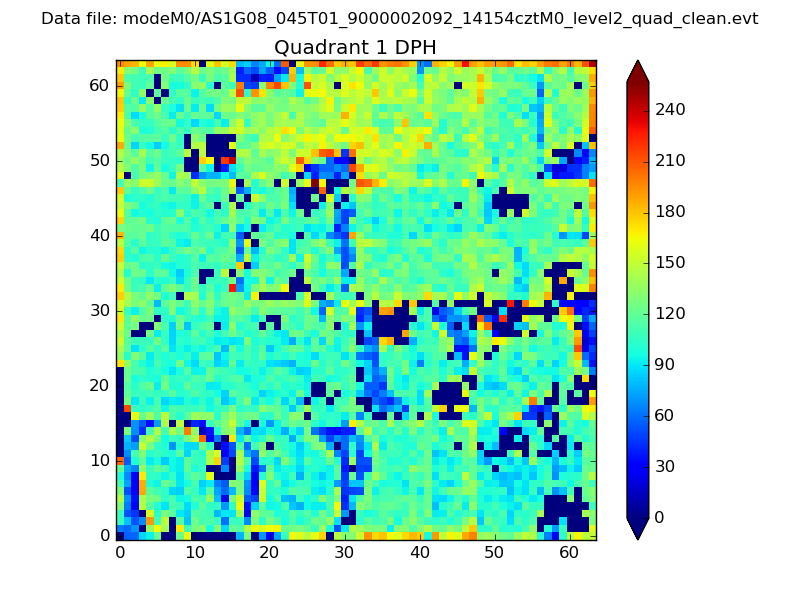 |
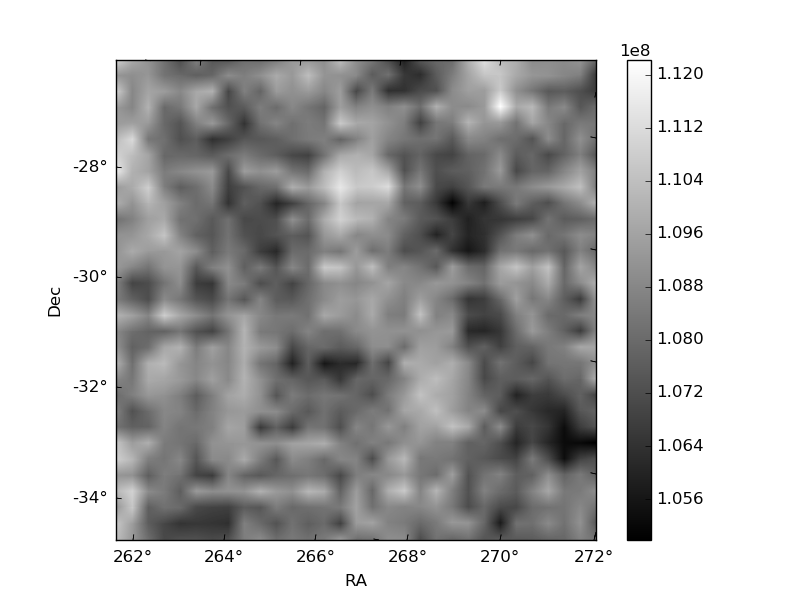
Quadrant B |
|---|---|---|---|
| Quadrant D | 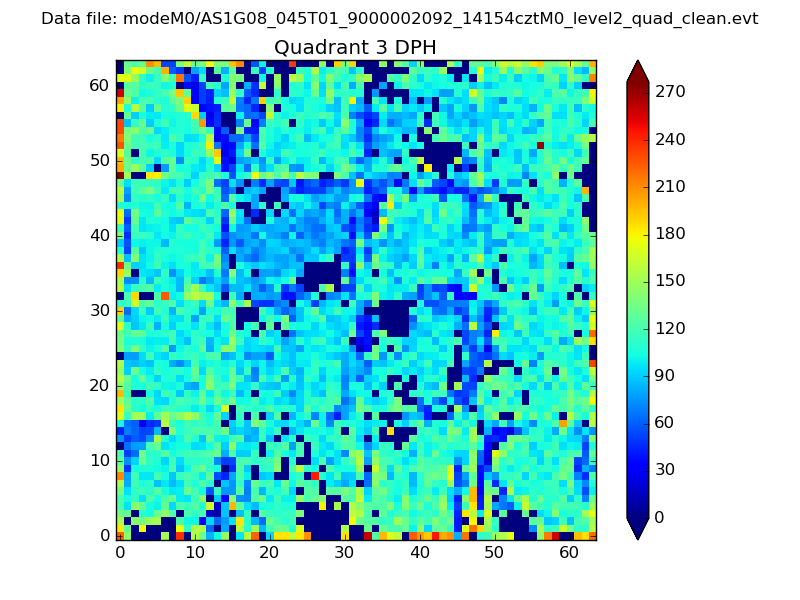 |
 |
Quadrant C |
| Plot type | Count rate plots | Images |
|---|---|---|
| Comparison with Poisson distribution Blue bars denote a histogram of data divided into 1 sec bins. Red curve is a Poisson curve with rate = median count rate of data. |
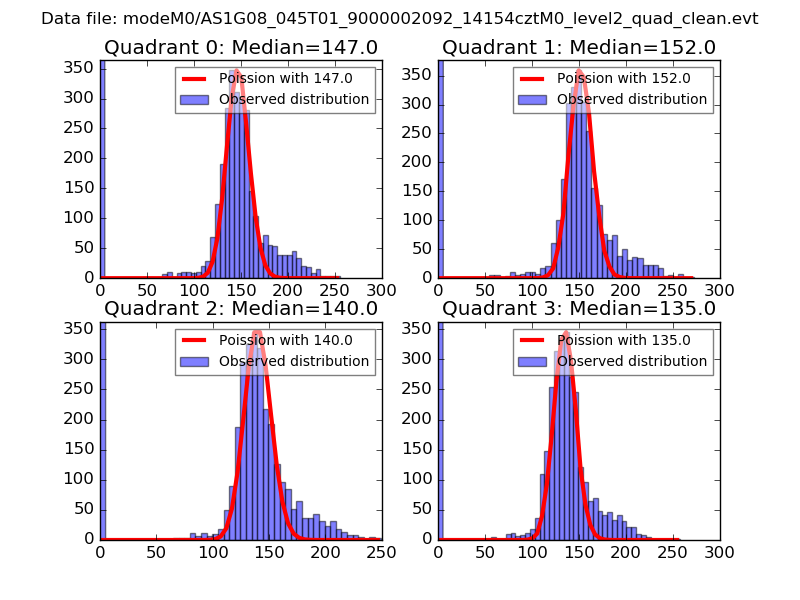 |
 |
| Quadrant-wise count rates Data is divided into 100 sec bins |
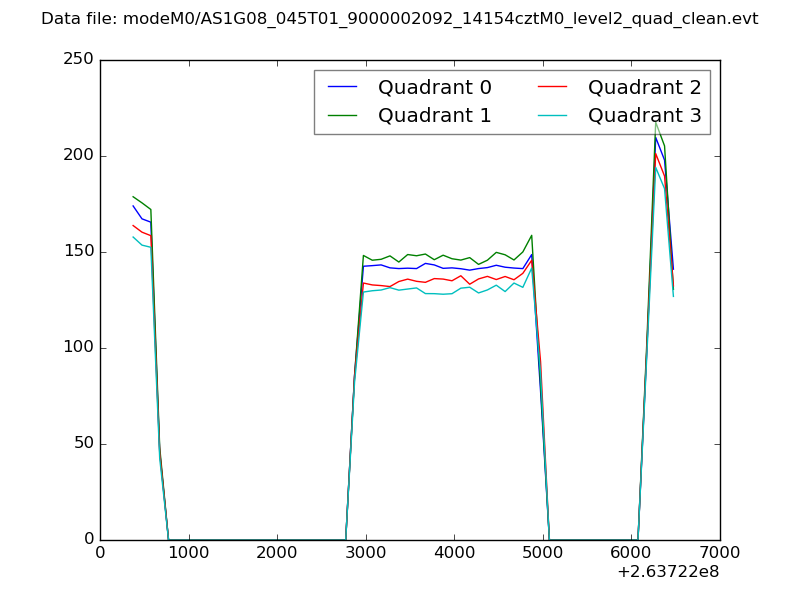 |
|
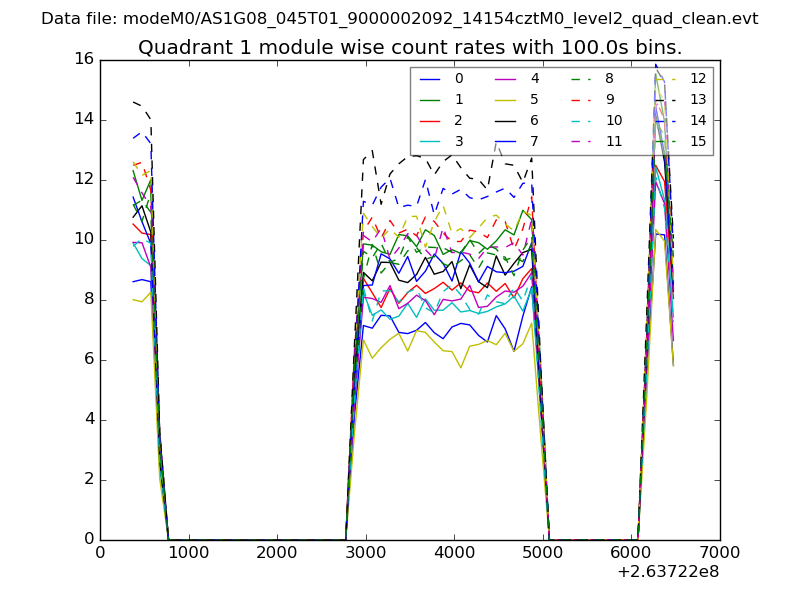
| Module-wise count rates for Quadrant A Data is divided into 100 sec bins |
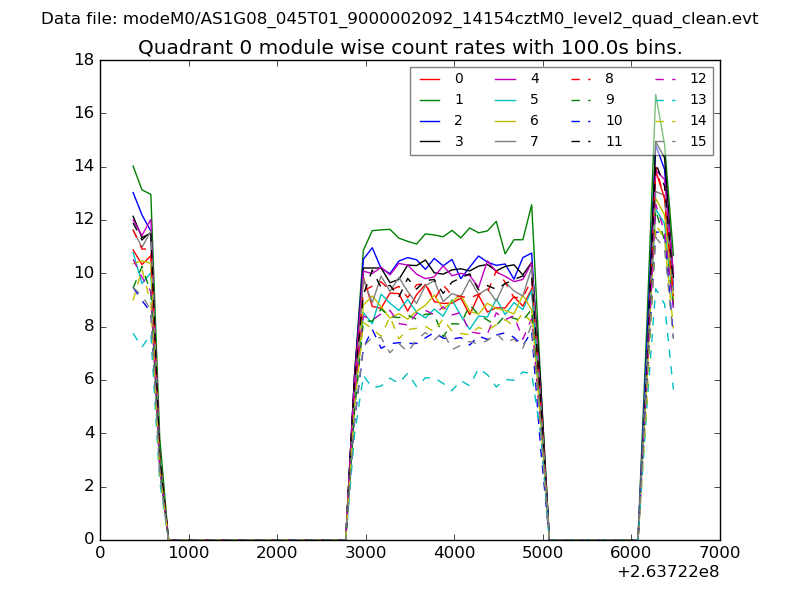 |
 |
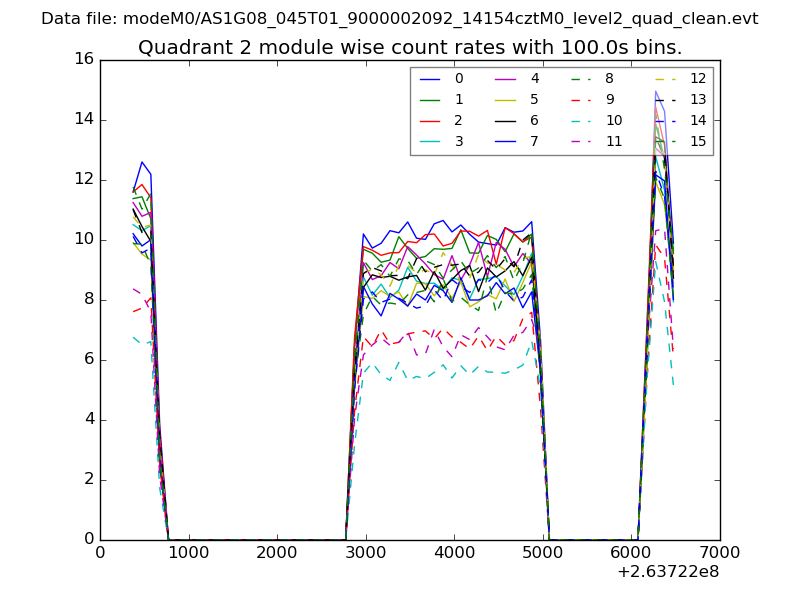
| Module-wise count rates for Quadrant B Data is divided into 100 sec bins |
 |
 |
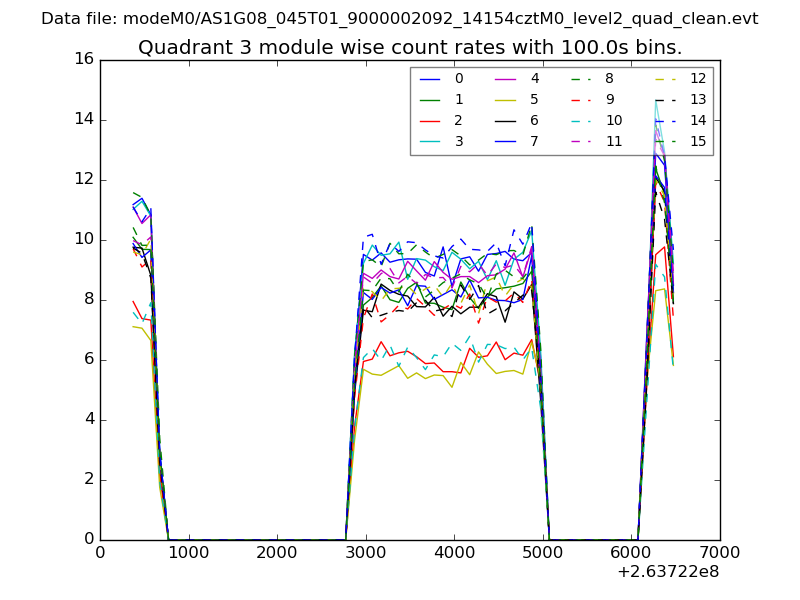
| Module-wise count rates for Quadrant C Data is divided into 100 sec bins |
 |
 |
| Module-wise count rates for Quadrant D Data is divided into 100 sec bins |
 |
 |
| Parameter | Plot |
|---|---|
| CZT HV Monitor | 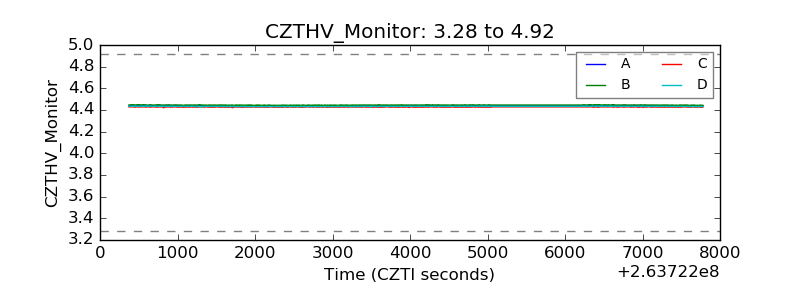 |
| D_VDD | 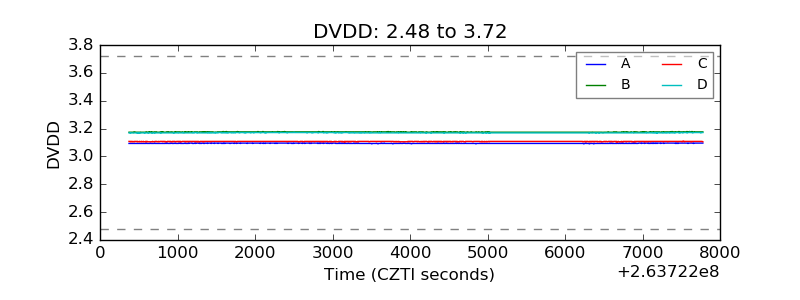 |
| Temperature 1 | 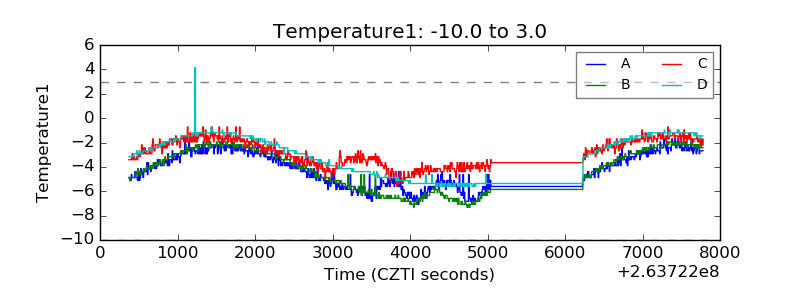 |
| Veto HV Monitor | 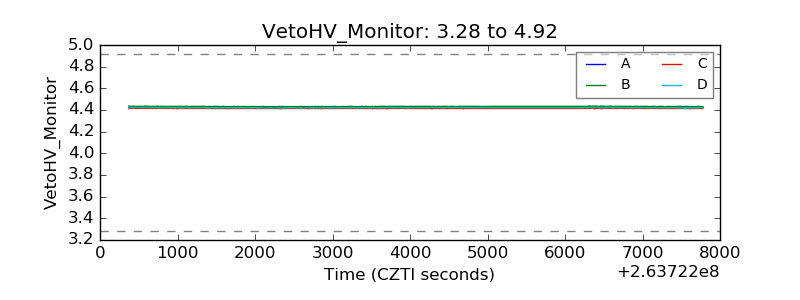 |
| Veto LLD | 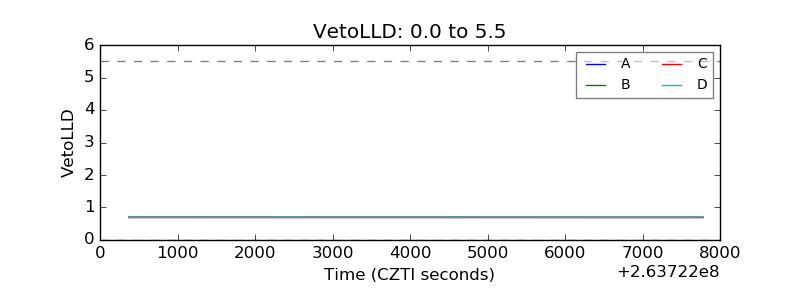 |
| Alpha Counter | 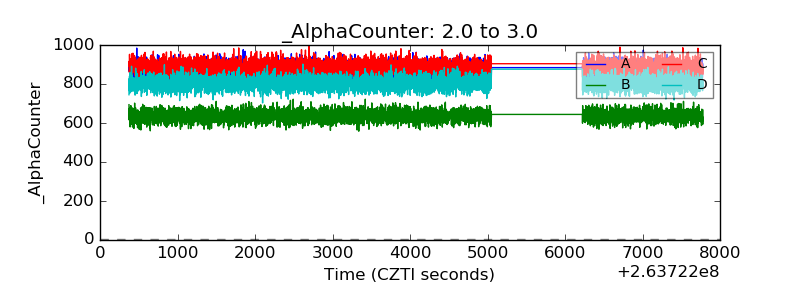 |
| _CPM_Rate | 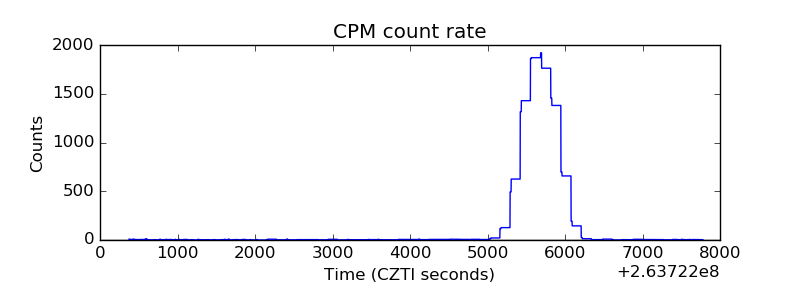 |
| CZT Counter | 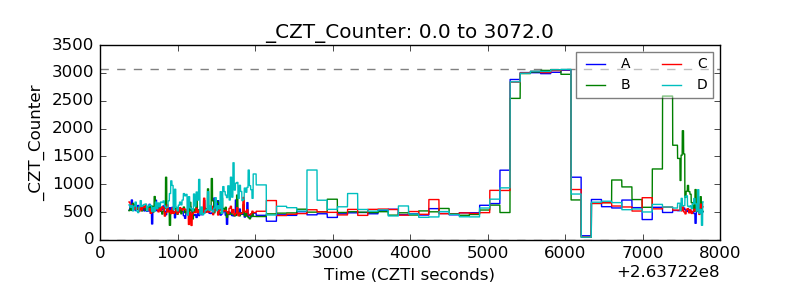 |
| +2.5 Volts monitor | 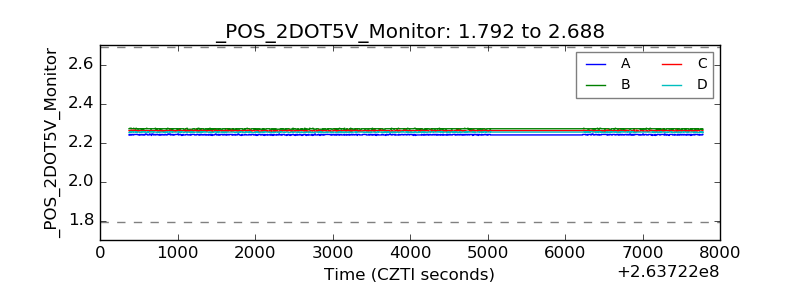 |
| +5 Volts monitor | 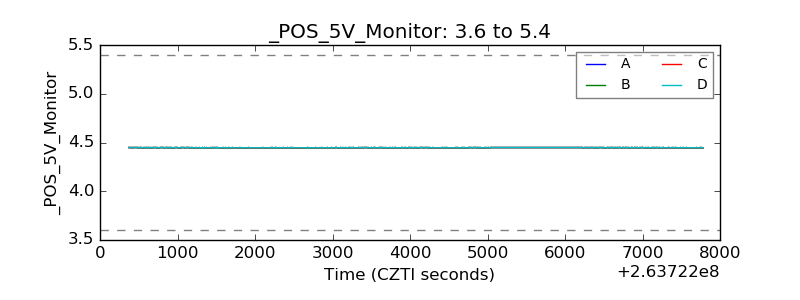 |
| _ROLL_ROT | 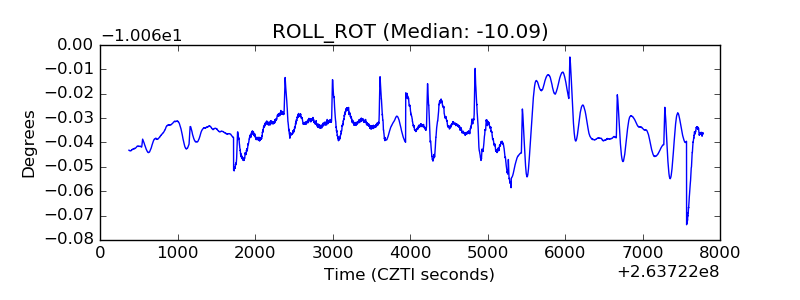 |
| _Roll_DEC | 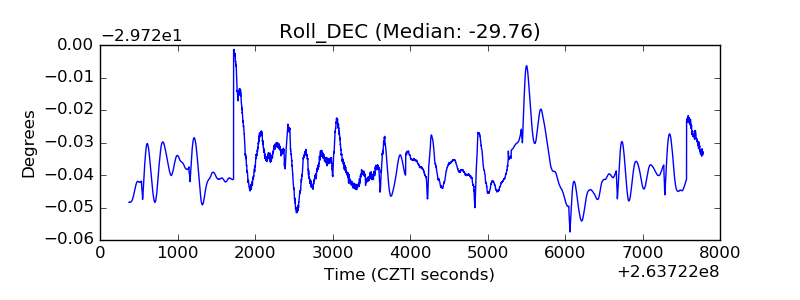 |
| _Roll_RA | 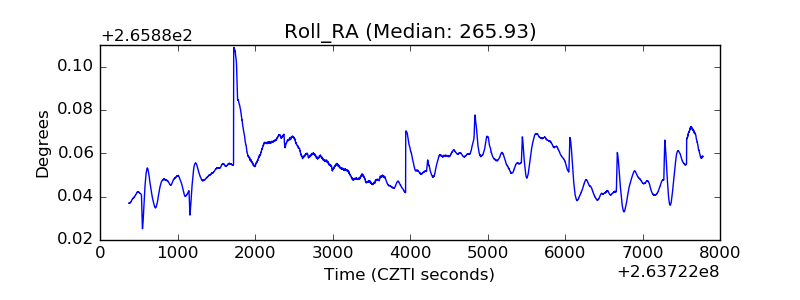 |
| Veto Counter | 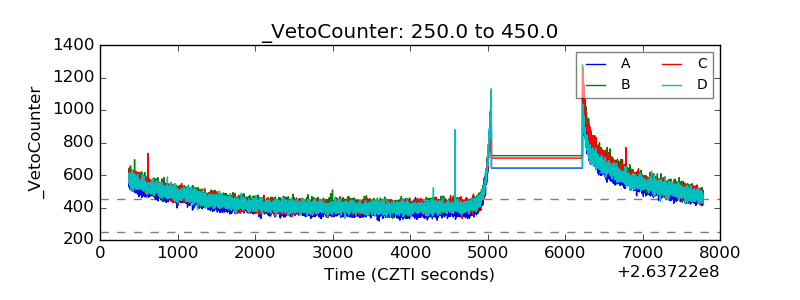 |