| Param | Original file | Final file |
|---|---|---|
| Filename | modeM0/AS1A04_198T01_9000002322_15718cztM0_level2.evt | modeM0/AS1A04_198T01_9000002322_15718cztM0_level2_quad_clean.evt |
| Size (bytes) | 481,127,040 | 104,117,760 |
| Size | 458.8 MB | 99.3 MB |
| Events in quadrant A | 3,055,124 | 675,779 |
| Events in quadrant B | 3,218,818 | 706,042 |
| Events in quadrant C | 4,235,523 | 681,427 |
| Events in quadrant D | 3,635,823 | 652,265 |
| Mode M0 | |||
|---|---|---|---|
| Quadrant | BADHDUFLAG | Total packets | Discarded packets |
| A | 0 | 13065 | 3 |
| B | 0 | 13449 | 2 |
| C | 0 | 16962 | 2 |
| D | 0 | 14872 | 2 |
| Mode SS | |||
|---|---|---|---|
| Quadrant | BADHDUFLAG | Total packets | Discarded packets |
| A | 0 | 128 | 0 |
| B | 0 | 128 | 0 |
| C | 0 | 128 | 0 |
| D | 0 | 128 | 0 |
| Mode M9 | |||
|---|---|---|---|
| Quadrant | BADHDUFLAG | Total packets | Discarded packets |
| A | 0 | 17 | 0 |
| B | 0 | 17 | 0 |
| C | 0 | 17 | 0 |
| D | 0 | 18 | 0 |
| Quadrant | Total seconds | Saturated seconds | Saturation percentage |
|---|---|---|---|
| A | 6268 | 23 | 0.366943% |
| B | 6268 | 43 | 0.686024% |
| C | 6268 | 118 | 1.882578% |
| D | 6268 | 192 | 3.063178% |
Noise dominated data is calculated using 1-second bins in cleaned event files. If a bin has >2000 counts, and if more than 50% of those come from <1% of pixels, then it is considered to be noise-dominated and hence unusable.
| Quadrant | # 1 sec bins | Bins with >0 counts | Bins with >2000 counts | High rate bins dominated by noise | Noise dominated (total time) | Noise dominated (detector-on time) | Marked lightcurve |
|---|---|---|---|---|---|---|---|
| A | 7569 | 6270 | 3 | 3 | 0.04% | 0.05% | 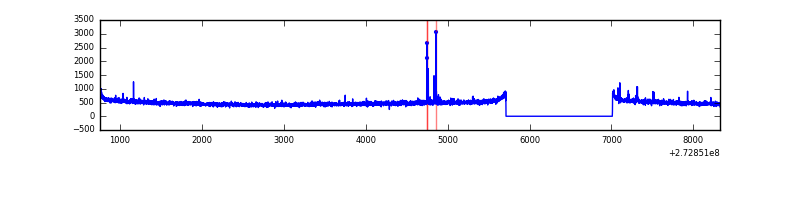 |
| B | 7569 | 6270 | 8 | 8 | 0.11% | 0.13% | 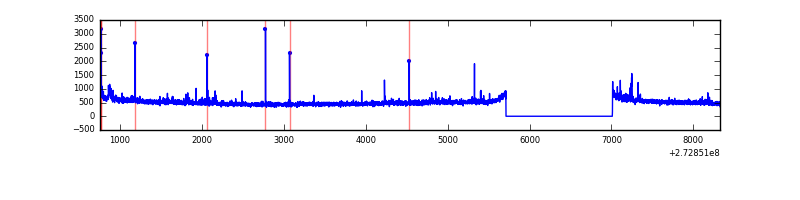 |
| C | 7569 | 6270 | 30 | 30 | 0.40% | 0.48% | 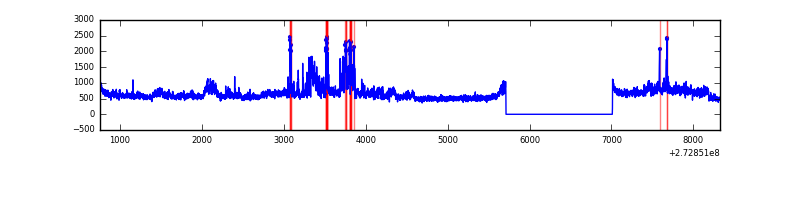 |
| D | 7569 | 6270 | 132 | 132 | 1.74% | 2.11% | 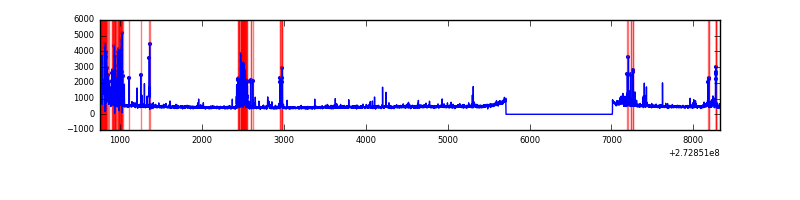 |
Top three noisy pixels from each quadrant. If the there are fewer than three noisy pixels in the level2.evt file, extra rows are filled as -1
| Pixel properties | Quadrant properties | ||||||
|---|---|---|---|---|---|---|---|
| Quadrant | DetID | PixID | Counts | Sigma | Mean | Median | Sigma |
| A | 9 | 143 | 36887 | 230.34 | 784 | 768 | 156.8 |
| A | 0 | 226 | 6891 | 39.05 | 784 | 768 | 156.8 |
| A | 12 | 194 | 5798 | 32.08 | 784 | 768 | 156.8 |
| B | 5 | 236 | 35594 | 234.73 | 795 | 776 | 148.3 |
| B | 4 | 173 | 35165 | 231.84 | 795 | 776 | 148.3 |
| B | 12 | 111 | 16760 | 107.76 | 795 | 776 | 148.3 |
| C | 3 | 233 | 656975 | 3599.96 | 782 | 790 | 182.3 |
| C | 15 | 127 | 317525 | 1737.67 | 782 | 790 | 182.3 |
| C | 14 | 238 | 119812 | 652.98 | 782 | 790 | 182.3 |
| D | 1 | 52 | 322604 | 1642.09 | 767 | 750 | 196.0 |
| D | 10 | 70 | 263358 | 1339.82 | 767 | 750 | 196.0 |
| D | 12 | 144 | 81965 | 414.36 | 767 | 750 | 196.0 |
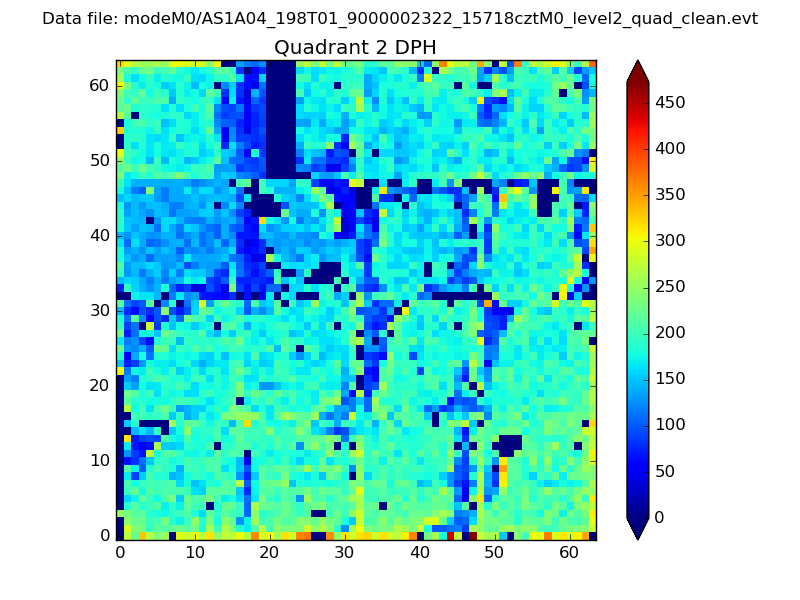
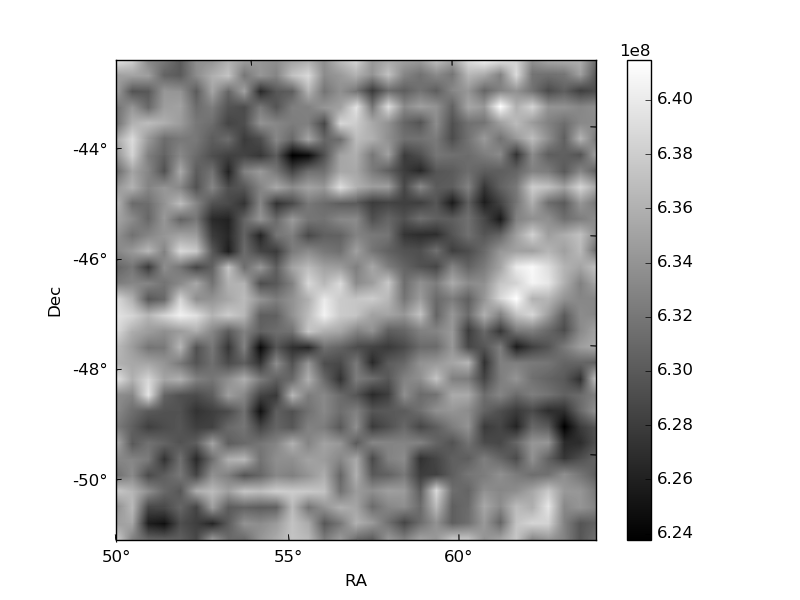
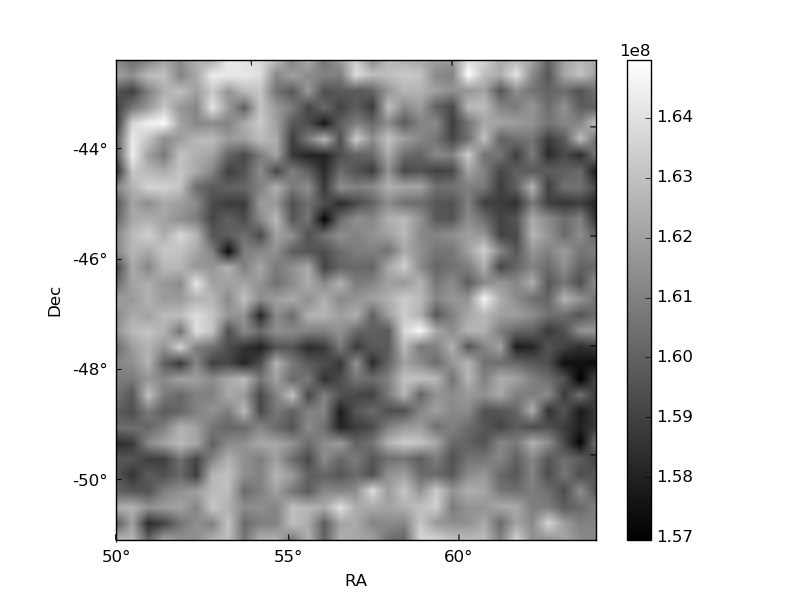
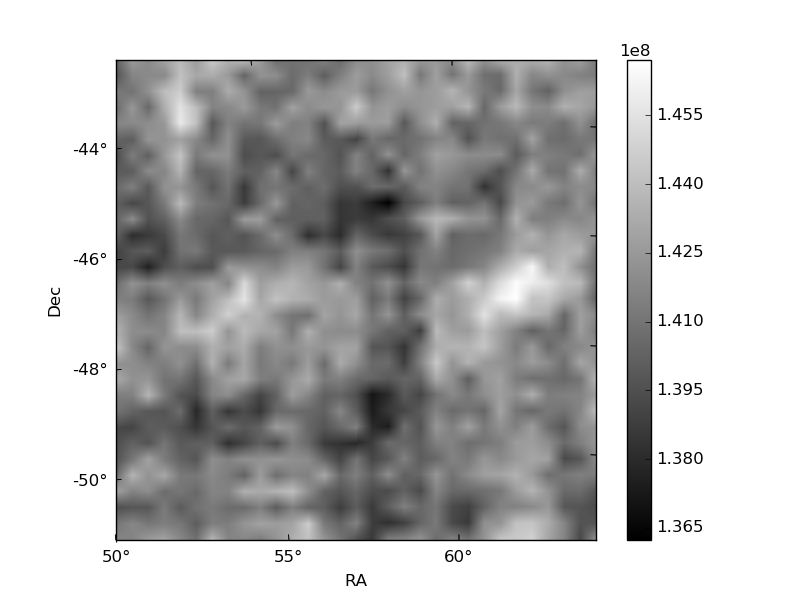
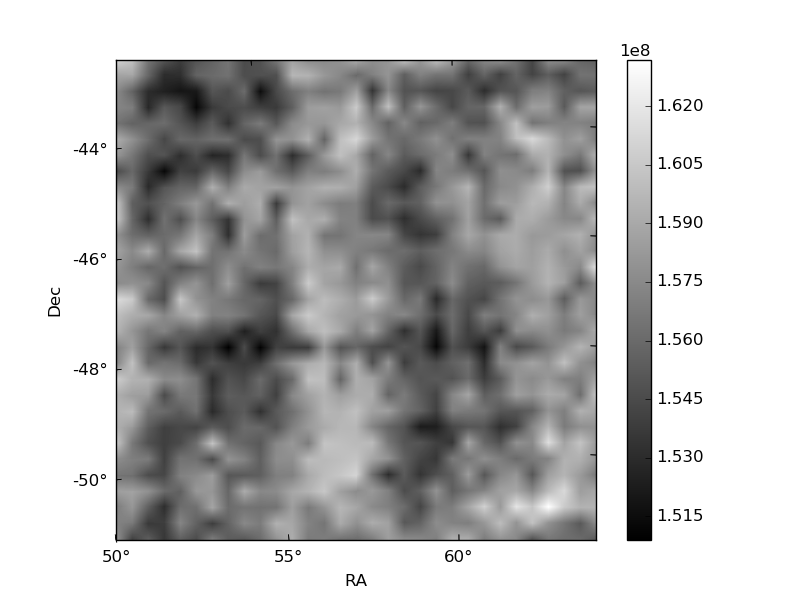
Histogram calculated using DETX and DETY for each event in the final _common_clean file
| Quadrant A | 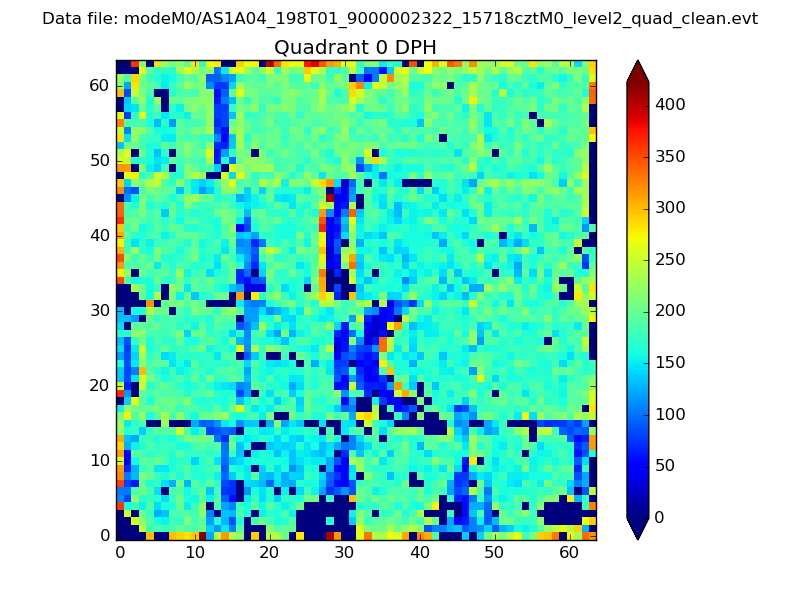 |
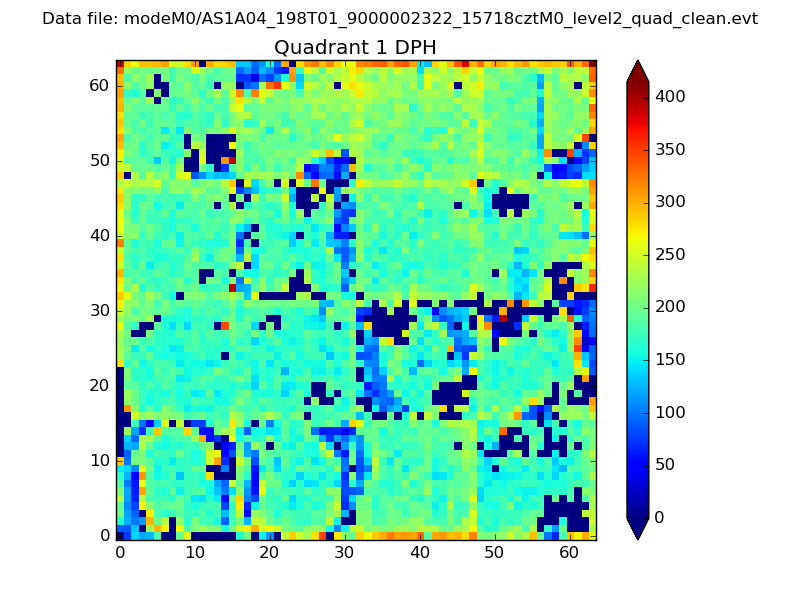 |
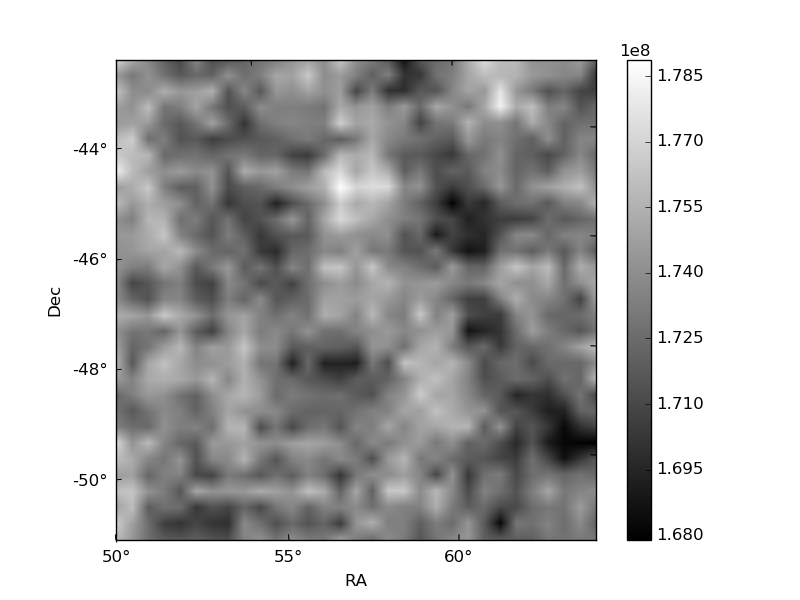
Quadrant B |
|---|---|---|---|
| Quadrant D | 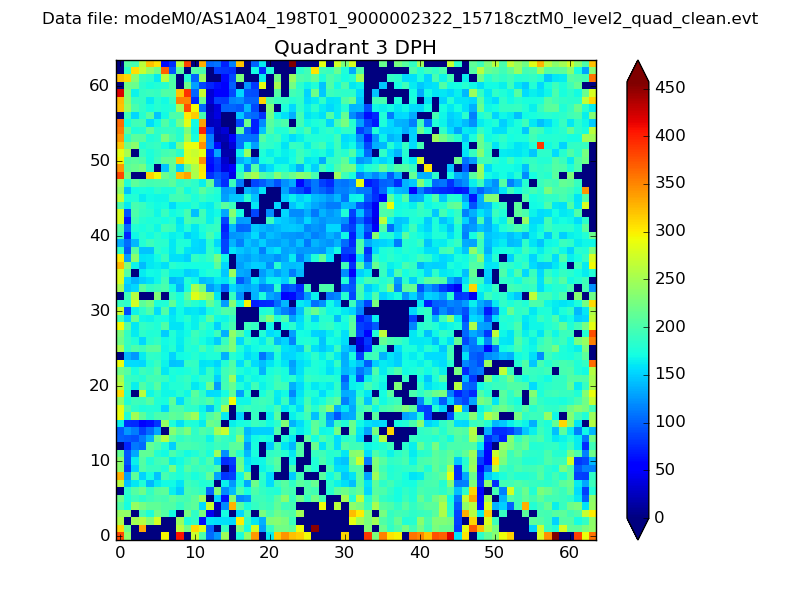 |
 |
Quadrant C |
| Plot type | Count rate plots | Images |
|---|---|---|
| Comparison with Poisson distribution Blue bars denote a histogram of data divided into 1 sec bins. Red curve is a Poisson curve with rate = median count rate of data. |
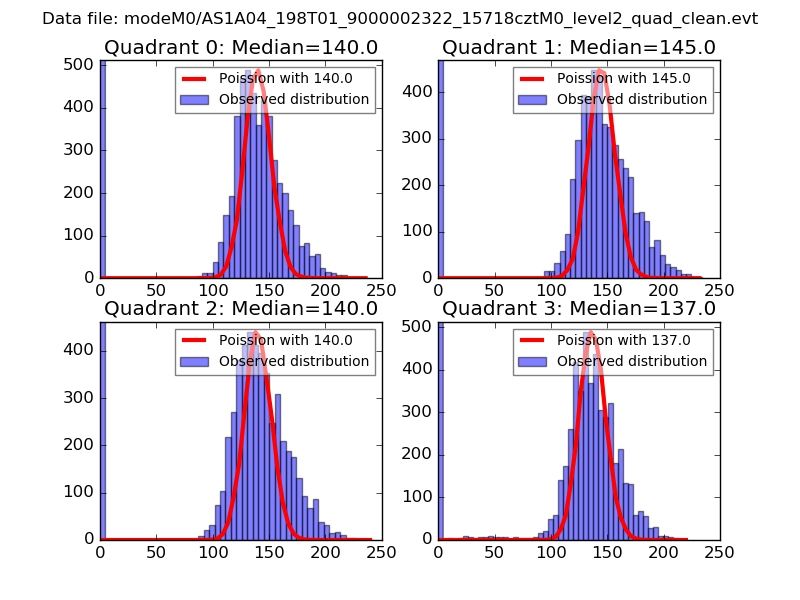 |
 |
| Quadrant-wise count rates Data is divided into 100 sec bins |
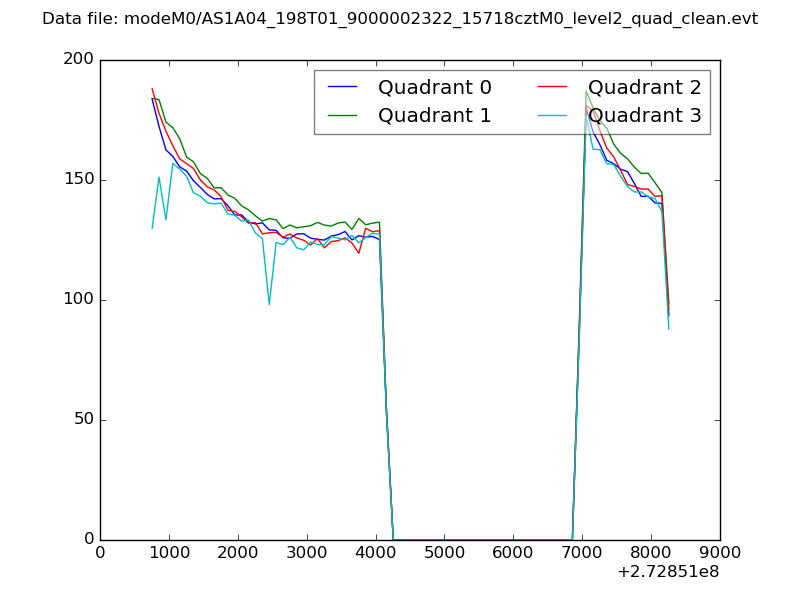 |
|
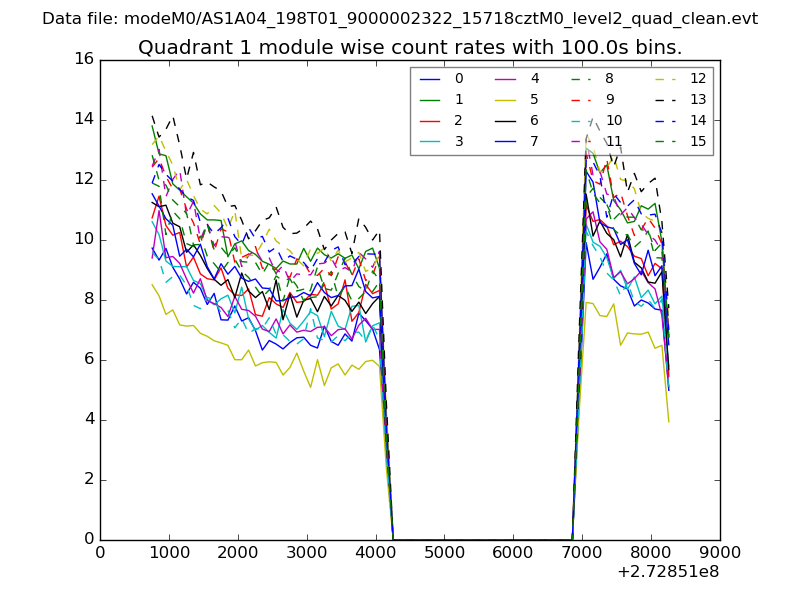
| Module-wise count rates for Quadrant A Data is divided into 100 sec bins |
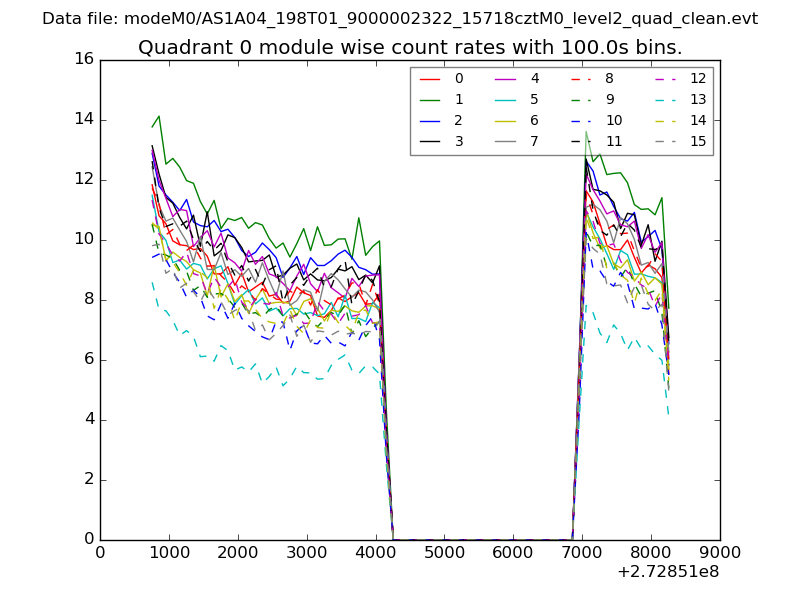 |
 |
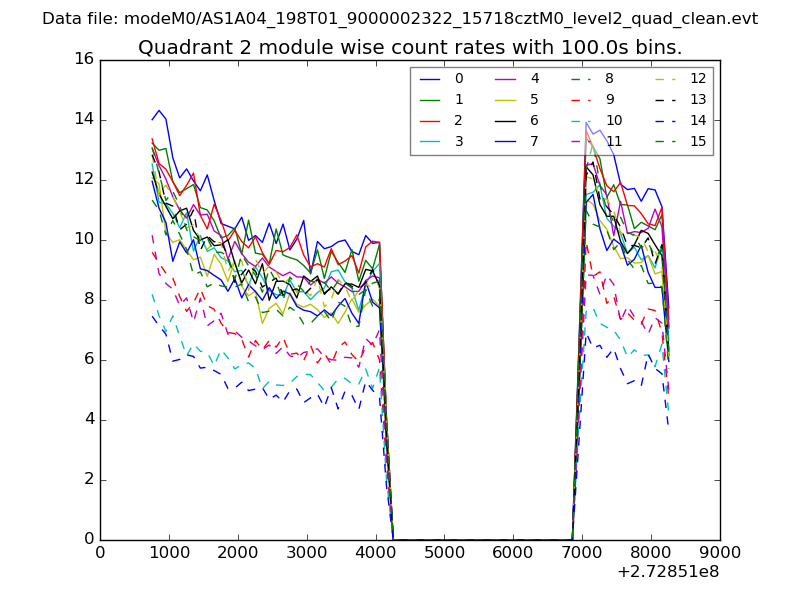
| Module-wise count rates for Quadrant B Data is divided into 100 sec bins |
 |
 |
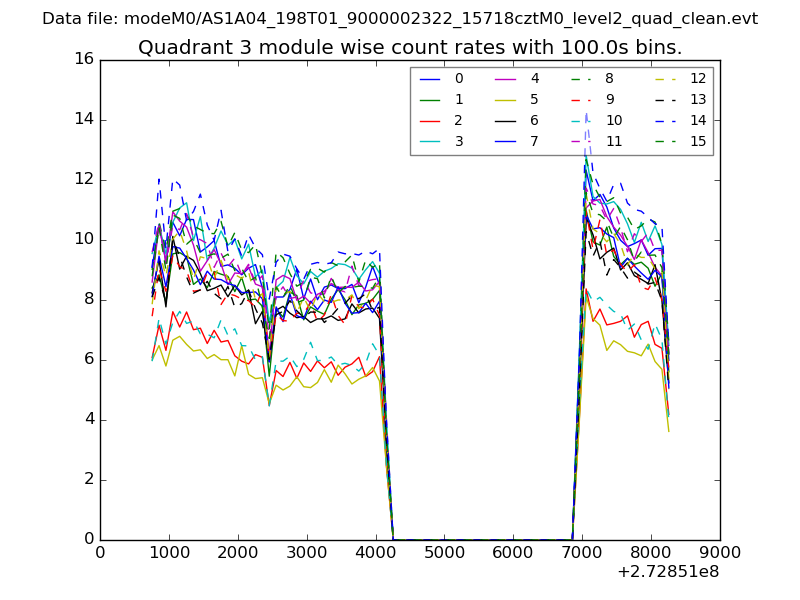
| Module-wise count rates for Quadrant C Data is divided into 100 sec bins |
 |
 |
| Module-wise count rates for Quadrant D Data is divided into 100 sec bins |
 |
 |
| Parameter | Plot |
|---|---|
| CZT HV Monitor | 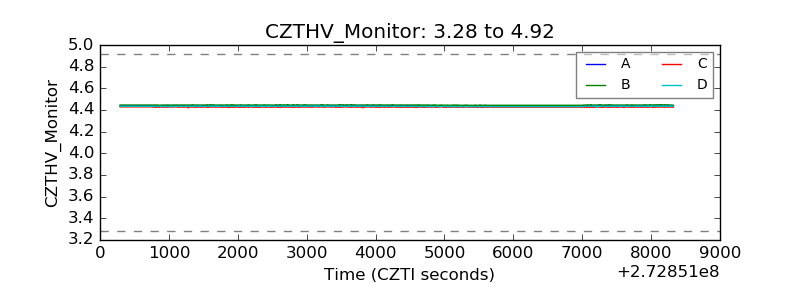 |
| D_VDD | 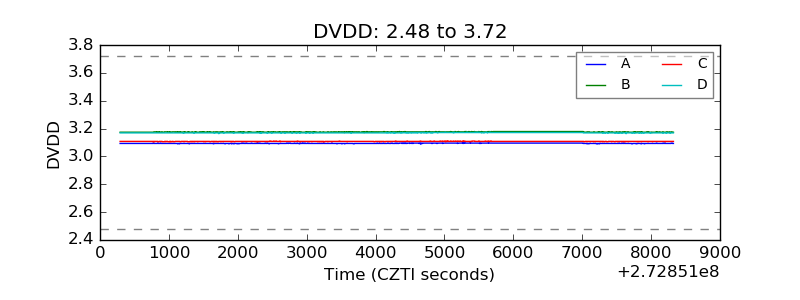 |
| Temperature 1 | 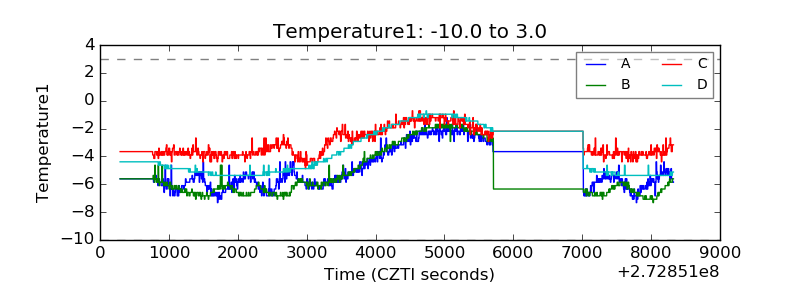 |
| Veto HV Monitor | 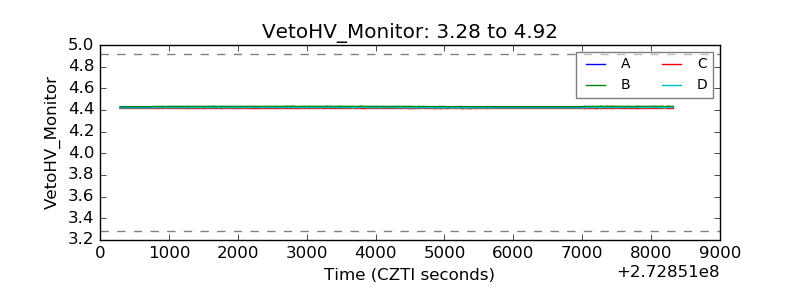 |
| Veto LLD | 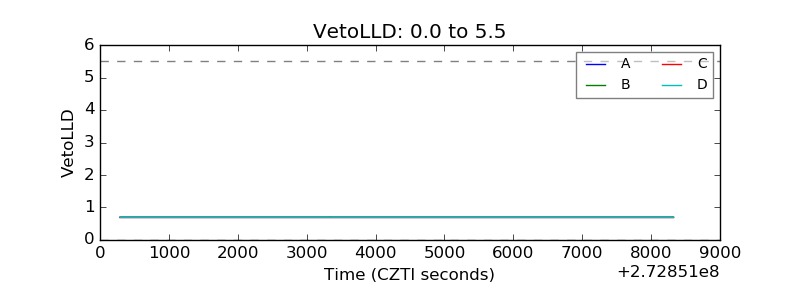 |
| Alpha Counter | 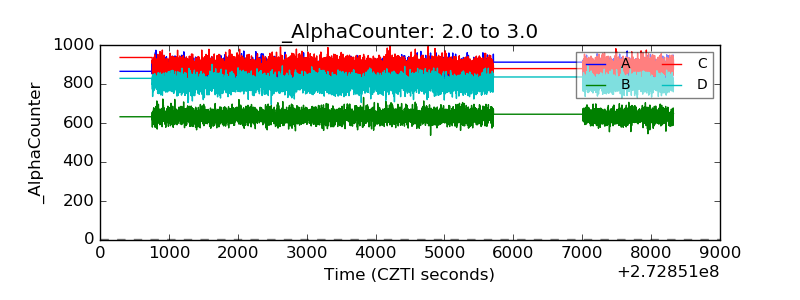 |
| _CPM_Rate | 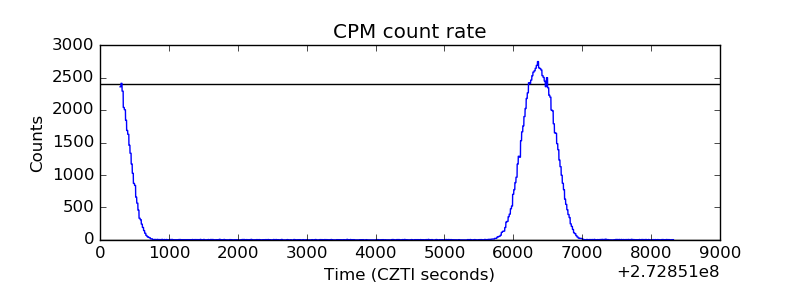 |
| CZT Counter | 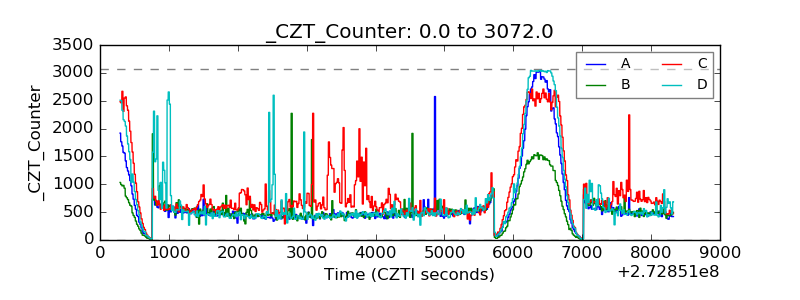 |
| +2.5 Volts monitor | 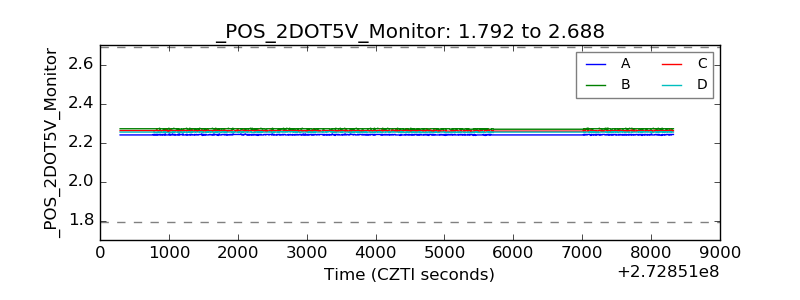 |
| +5 Volts monitor | 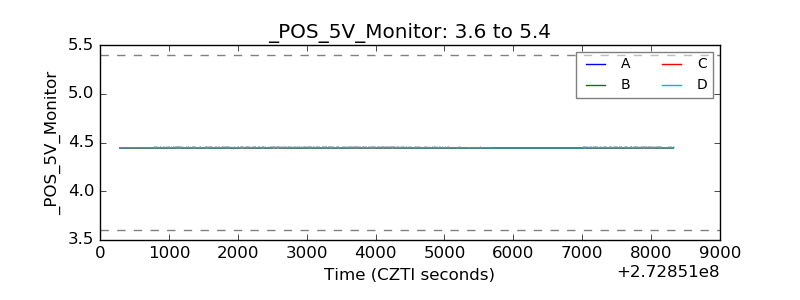 |
| _ROLL_ROT | 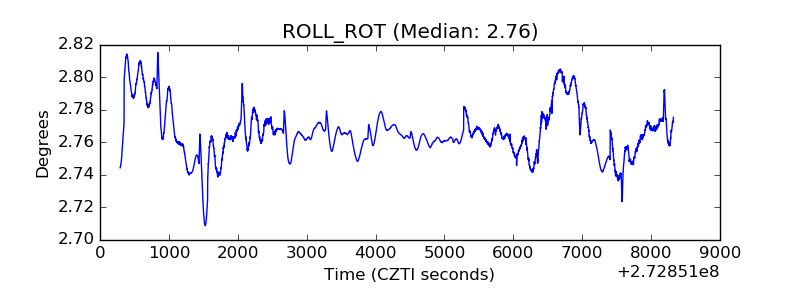 |
| _Roll_DEC | 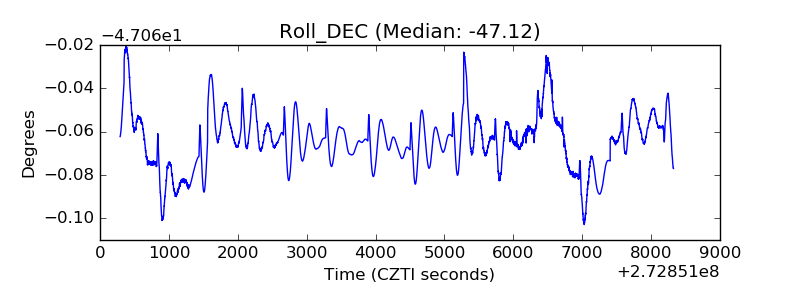 |
| _Roll_RA | 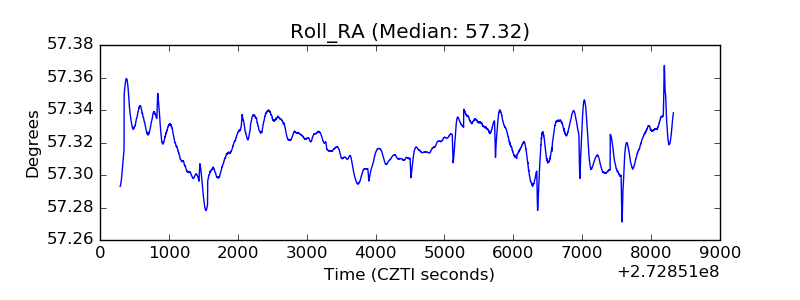 |
| Veto Counter | 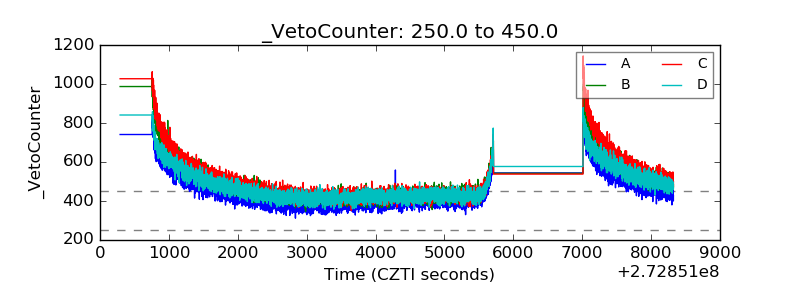 |