| Param | Original file | Final file |
|---|---|---|
| Filename | modeM0/AS1T02_090T01_9000002360_15992cztM0_level2.evt | modeM0/AS1T02_090T01_9000002360_15992cztM0_level2_quad_clean.evt |
| Size (bytes) | 138,962,880 | 5,791,680 |
| Size | 132.5 MB | 5.5 MB |
| Events in quadrant A | 938,029 | 15,631 |
| Events in quadrant B | 1,169,378 | 15,387 |
| Events in quadrant C | 954,867 | 14,947 |
| Events in quadrant D | 1,039,110 | 14,555 |
| Mode M0 | |||
|---|---|---|---|
| Quadrant | BADHDUFLAG | Total packets | Discarded packets |
| A | 0 | 3798 | 2 |
| B | 0 | 4698 | 1 |
| C | 0 | 3951 | 1 |
| D | 0 | 4231 | 1 |
| Mode SS | |||
|---|---|---|---|
| Quadrant | BADHDUFLAG | Total packets | Discarded packets |
| A | 0 | 32 | 0 |
| B | 0 | 32 | 0 |
| C | 0 | 32 | 0 |
| D | 0 | 32 | 0 |
| Mode M9 | |||
|---|---|---|---|
| Quadrant | BADHDUFLAG | Total packets | Discarded packets |
| A | 0 | 11 | 0 |
| B | 0 | 11 | 0 |
| C | 0 | 11 | 0 |
| D | 0 | 11 | 0 |
| Quadrant | Total seconds | Saturated seconds | Saturation percentage |
|---|---|---|---|
| A | 1536 | 21 | 1.367188% |
| B | 1536 | 41 | 2.669271% |
| C | 1536 | 33 | 2.148438% |
| D | 1536 | 24 | 1.562500% |
Noise dominated data is calculated using 1-second bins in cleaned event files. If a bin has >2000 counts, and if more than 50% of those come from <1% of pixels, then it is considered to be noise-dominated and hence unusable.
| Quadrant | # 1 sec bins | Bins with >0 counts | Bins with >2000 counts | High rate bins dominated by noise | Noise dominated (total time) | Noise dominated (detector-on time) | Marked lightcurve |
|---|---|---|---|---|---|---|---|
| A | 1537 | 1537 | 1 | 1 | 0.07% | 0.07% | 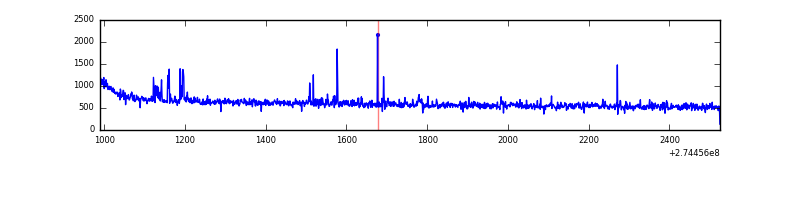 |
| B | 1537 | 1537 | 15 | 15 | 0.98% | 0.98% | 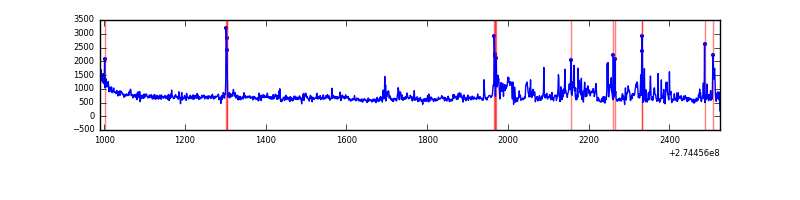 |
| C | 1537 | 1537 | 0 | 0 | 0.00% | 0.00% | 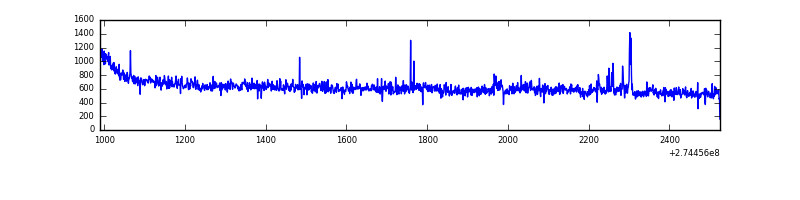 |
| D | 1537 | 1537 | 3 | 3 | 0.20% | 0.20% | 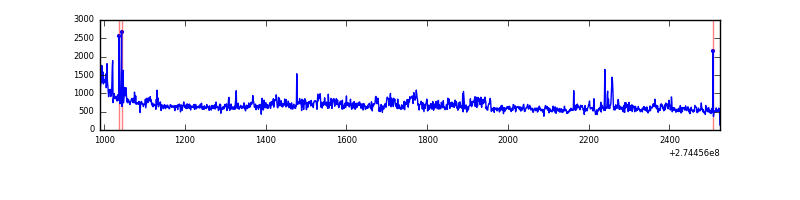 |
Top three noisy pixels from each quadrant. If the there are fewer than three noisy pixels in the level2.evt file, extra rows are filled as -1
| Pixel properties | Quadrant properties | ||||||
|---|---|---|---|---|---|---|---|
| Quadrant | DetID | PixID | Counts | Sigma | Mean | Median | Sigma |
| A | 15 | 157 | 12298 | 249.73 | 238 | 234 | 48.3 |
| A | 12 | 96 | 5029 | 99.26 | 238 | 234 | 48.3 |
| A | 15 | 174 | 4512 | 88.56 | 238 | 234 | 48.3 |
| B | 10 | 245 | 106491 | 2346.94 | 232 | 228 | 45.3 |
| B | 7 | 220 | 63627 | 1400.24 | 232 | 228 | 45.3 |
| B | 0 | 245 | 23907 | 522.98 | 232 | 228 | 45.3 |
| C | 14 | 238 | 35367 | 668.51 | 224 | 226 | 52.6 |
| C | 9 | 236 | 22883 | 431.02 | 224 | 226 | 52.6 |
| C | 3 | 233 | 11784 | 219.87 | 224 | 226 | 52.6 |
| D | 12 | 110 | 73743 | 1255.7 | 232 | 224 | 58.5 |
| D | 2 | 152 | 41285 | 701.32 | 232 | 224 | 58.5 |
| D | 9 | 85 | 19029 | 321.19 | 232 | 224 | 58.5 |
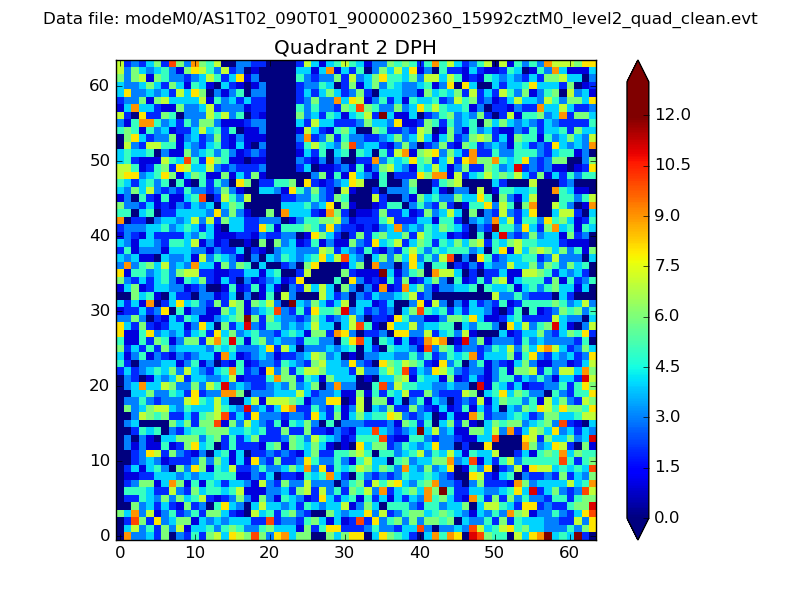
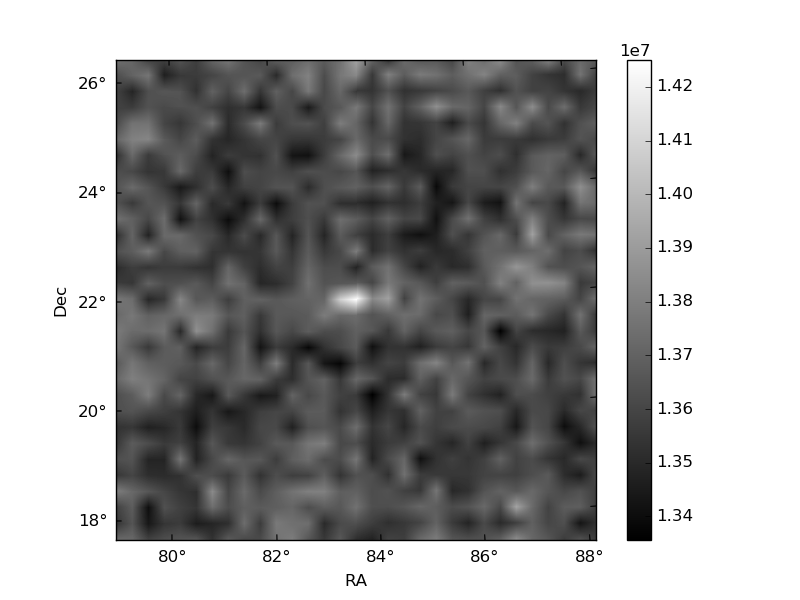
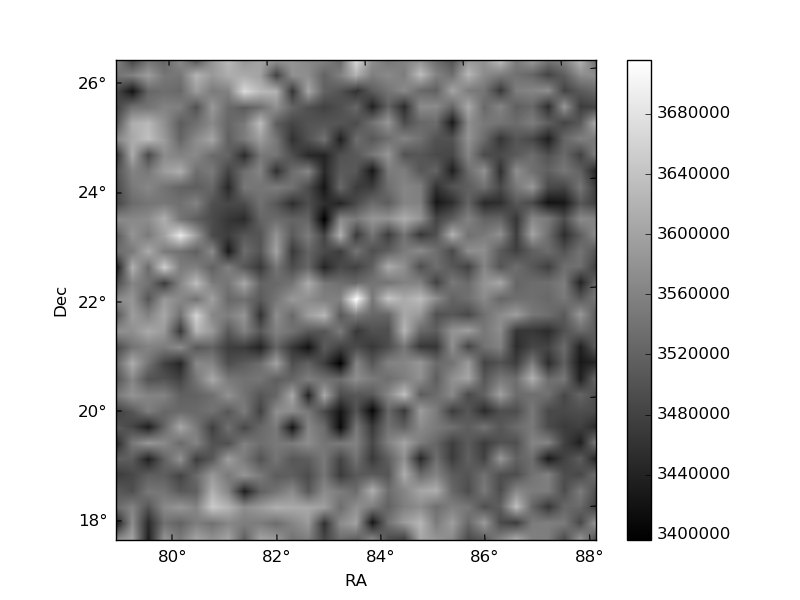
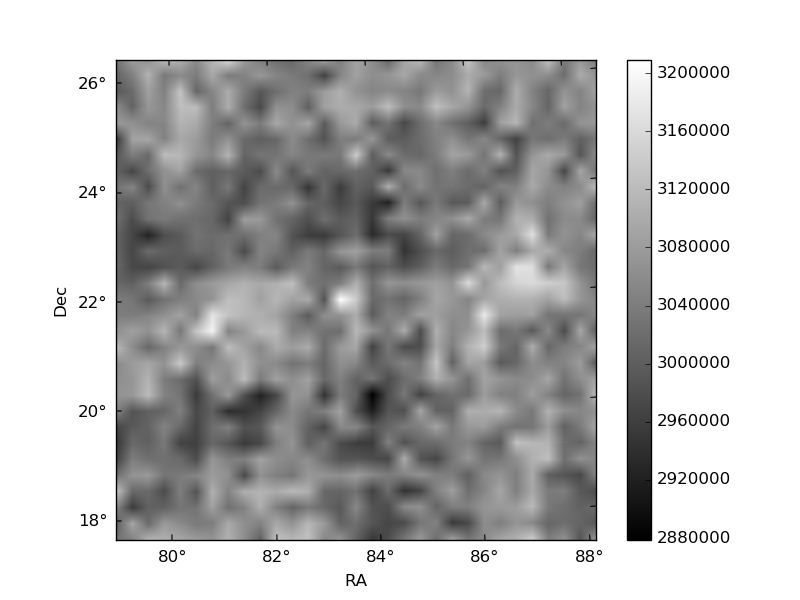
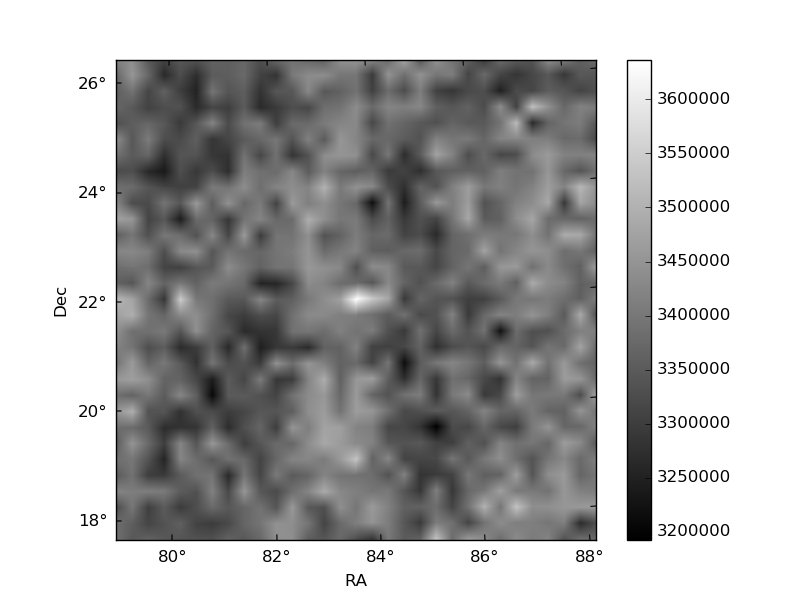
Histogram calculated using DETX and DETY for each event in the final _common_clean file
| Quadrant A | 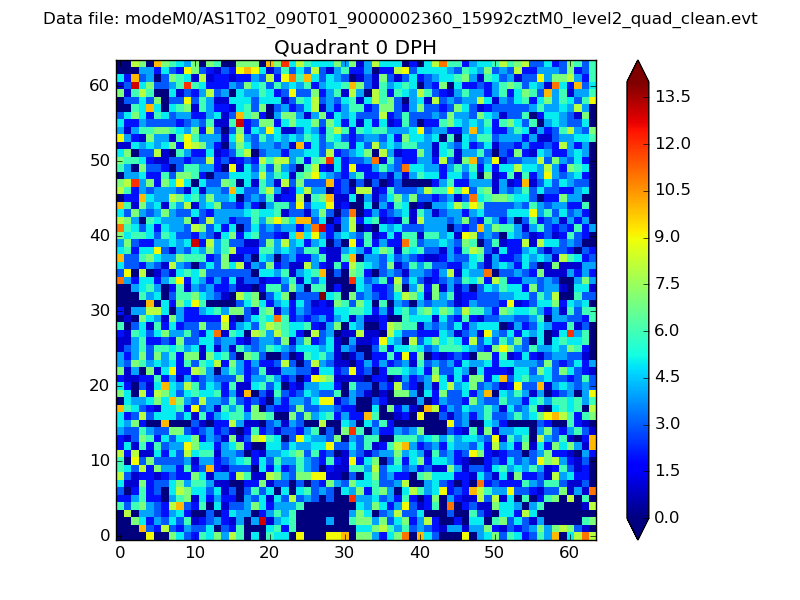 |
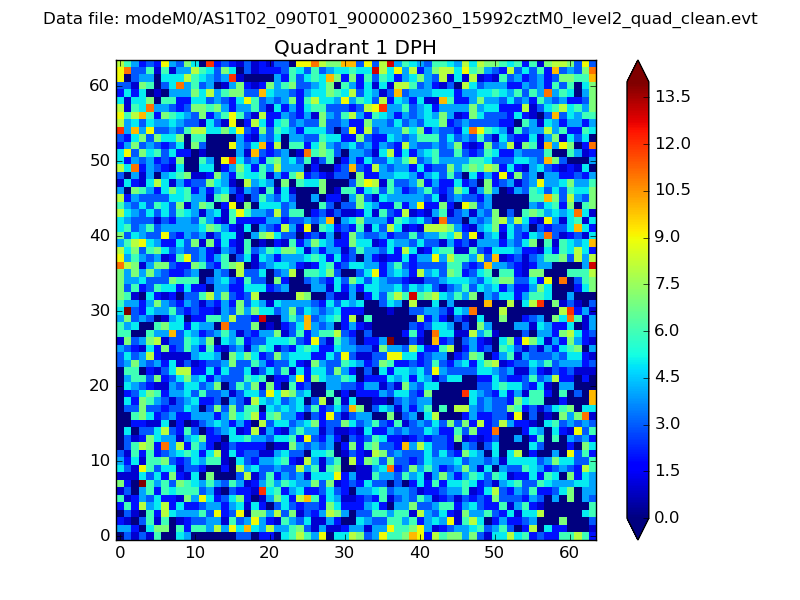 |
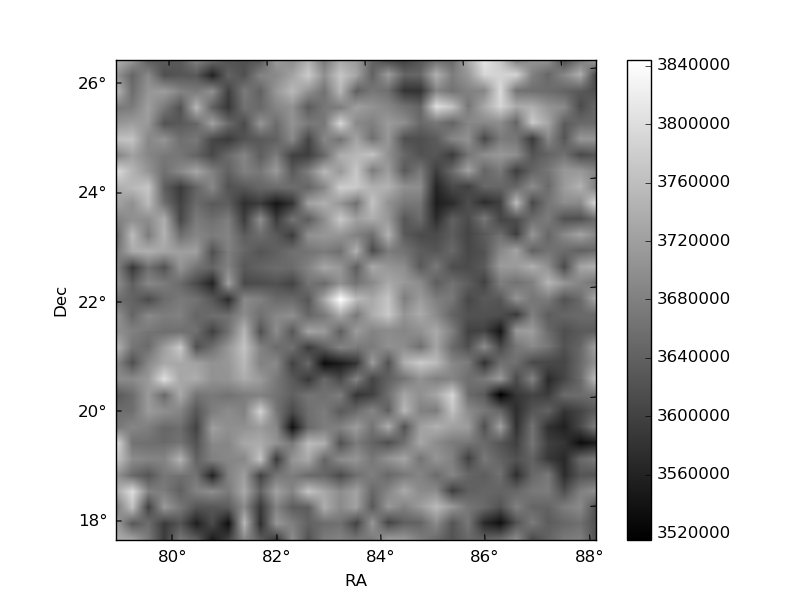
Quadrant B |
|---|---|---|---|
| Quadrant D | 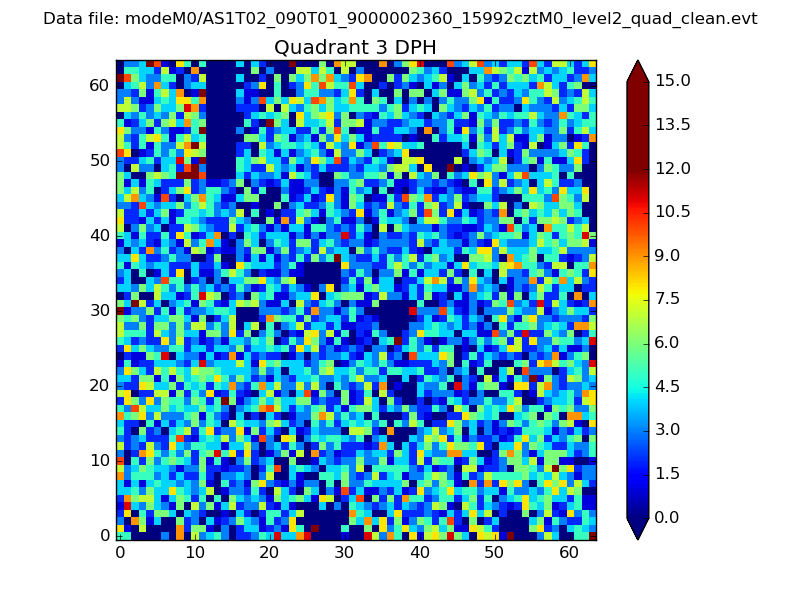 |
 |
Quadrant C |
| Plot type | Count rate plots | Images |
|---|---|---|
| Comparison with Poisson distribution Blue bars denote a histogram of data divided into 1 sec bins. Red curve is a Poisson curve with rate = median count rate of data. |
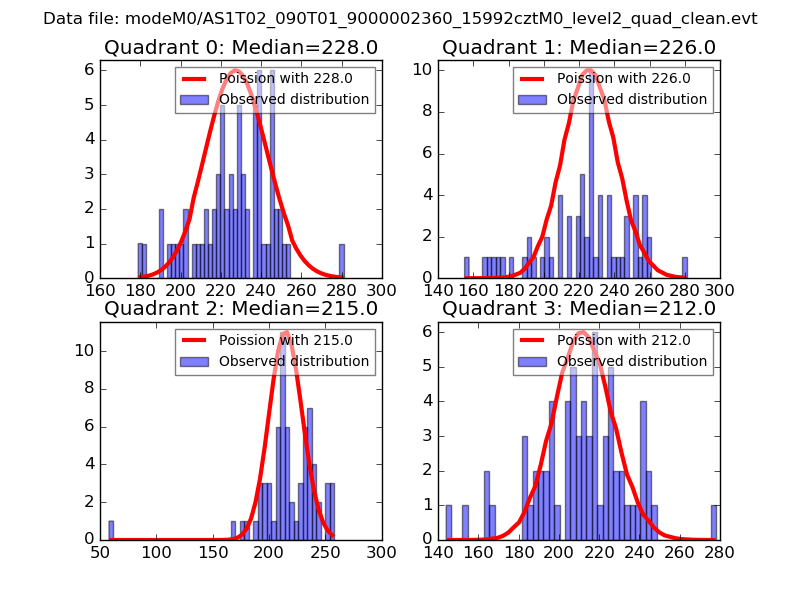 |
 |
| Quadrant-wise count rates Data is divided into 100 sec bins |
 |
|
| Module-wise count rates for Quadrant A Data is divided into 100 sec bins |
 |
 |
| Module-wise count rates for Quadrant B Data is divided into 100 sec bins |
 |
 |
| Module-wise count rates for Quadrant C Data is divided into 100 sec bins |
 |
 |
| Module-wise count rates for Quadrant D Data is divided into 100 sec bins |
 |
 |
| Parameter | Plot |
|---|---|
| CZT HV Monitor | 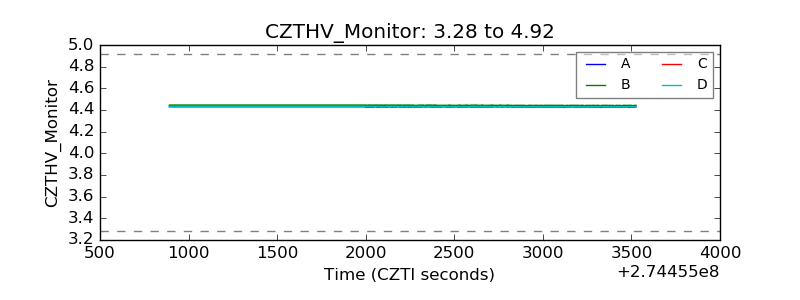 |
| D_VDD | 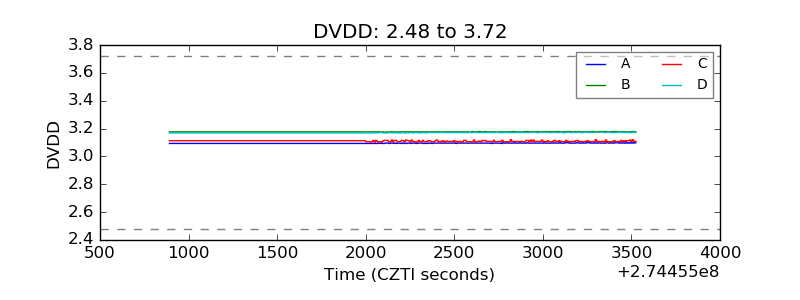 |
| Temperature 1 | 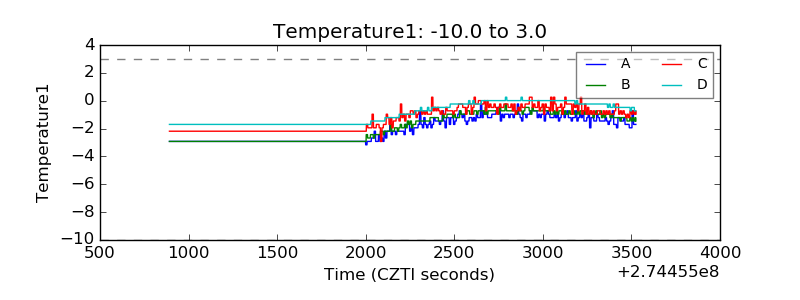 |
| Veto HV Monitor | 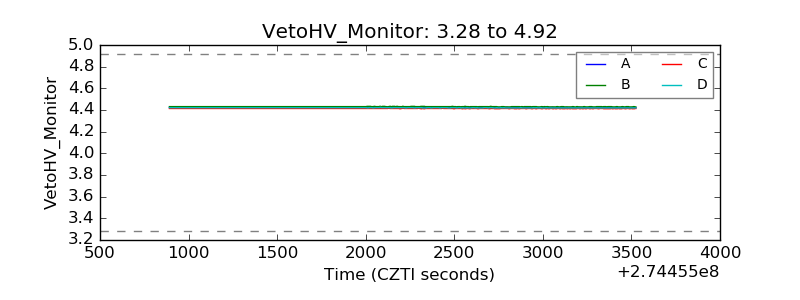 |
| Veto LLD | 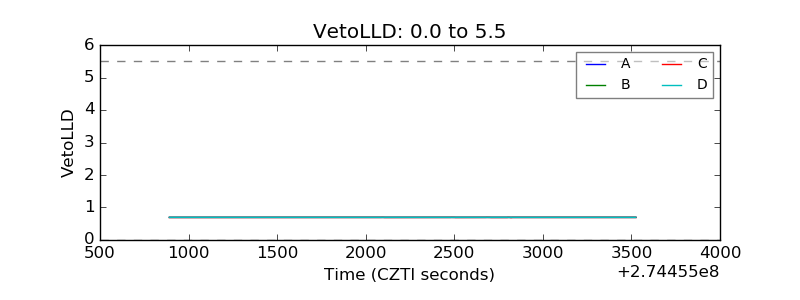 |
| Alpha Counter | 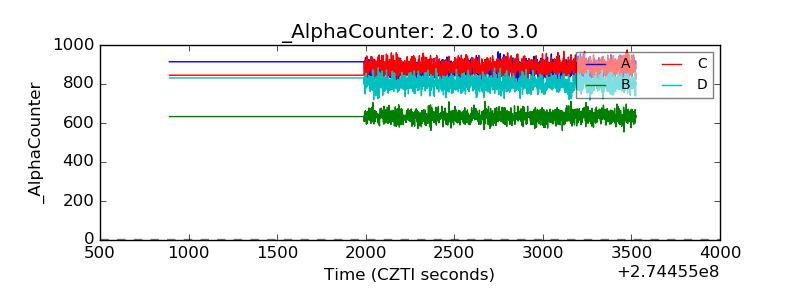 |
| _CPM_Rate | 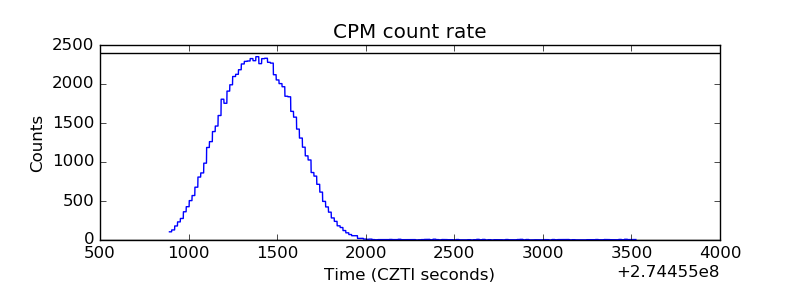 |
| CZT Counter | 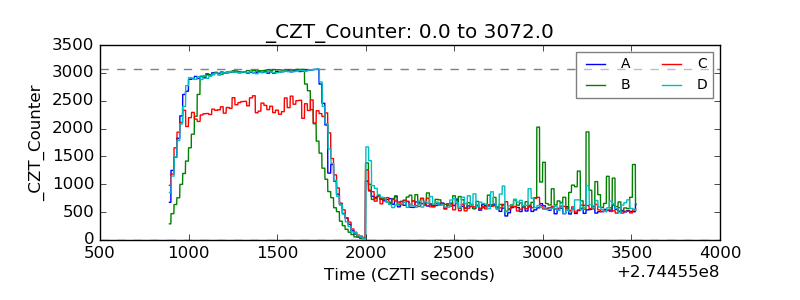 |
| +2.5 Volts monitor | 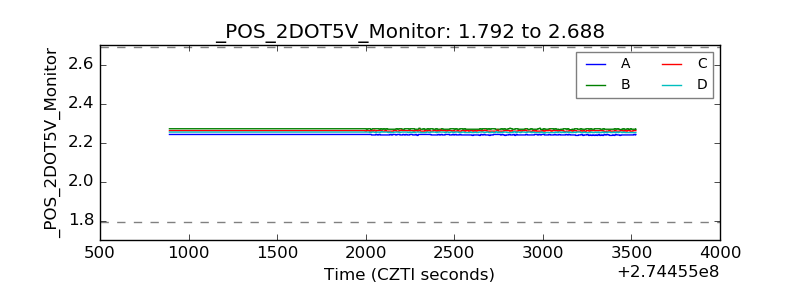 |
| +5 Volts monitor | 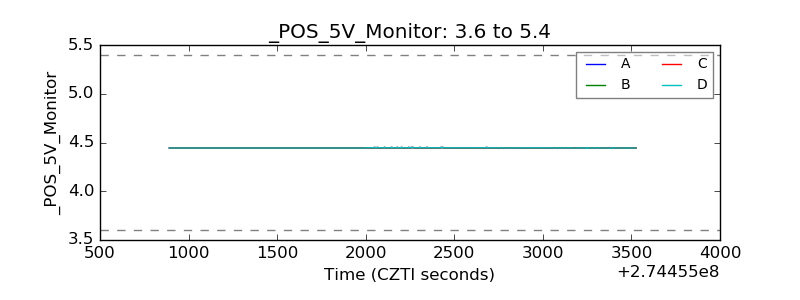 |
| _ROLL_ROT | 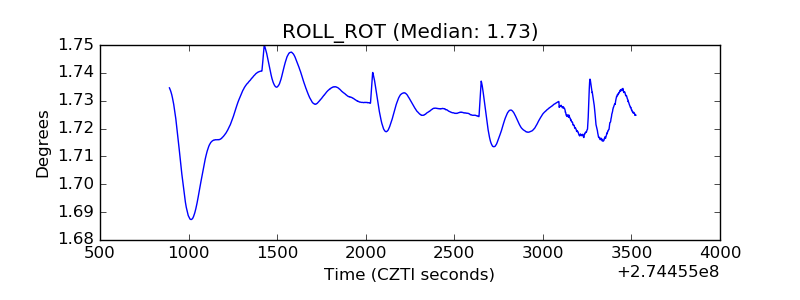 |
| _Roll_DEC | 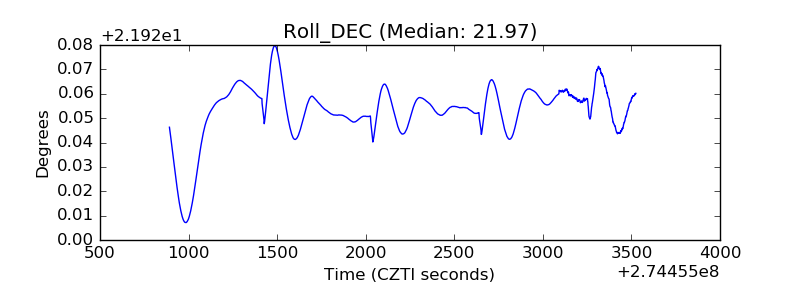 |
| _Roll_RA | 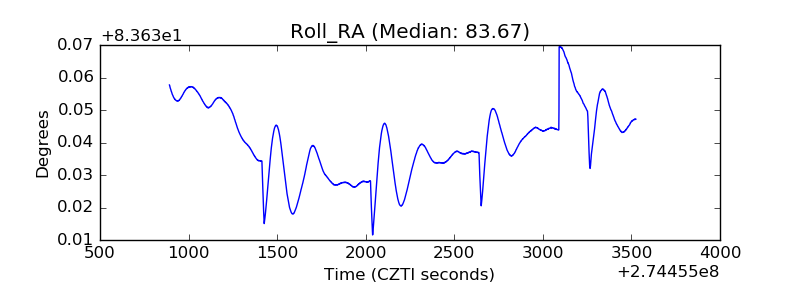 |
| Veto Counter | 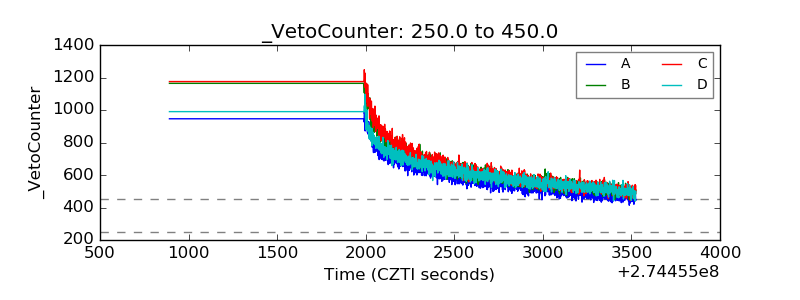 |