| Param | Original file | Final file |
|---|---|---|
| Filename | modeM0/AS1C04_007T07_9000002452_16640cztM0_level2.evt | modeM0/AS1C04_007T07_9000002452_16640cztM0_level2_quad_clean.evt |
| Size (bytes) | 457,234,560 | 82,062,720 |
| Size | 436.1 MB | 78.3 MB |
| Events in quadrant A | 3,200,342 | 506,939 |
| Events in quadrant B | 3,493,543 | 516,427 |
| Events in quadrant C | 3,405,720 | 499,505 |
| Events in quadrant D | 3,293,217 | 495,712 |
| Mode M9 | |||
|---|---|---|---|
| Quadrant | BADHDUFLAG | Total packets | Discarded packets |
| A | 0 | 9 | 0 |
| B | 0 | 9 | 0 |
| C | 0 | 9 | 0 |
| D | 0 | 9 | 0 |
| Mode SS | |||
|---|---|---|---|
| Quadrant | BADHDUFLAG | Total packets | Discarded packets |
| A | 0 | 136 | 0 |
| B | 0 | 136 | 0 |
| C | 0 | 136 | 0 |
| D | 0 | 136 | 0 |
| Mode M0 | |||
|---|---|---|---|
| Quadrant | BADHDUFLAG | Total packets | Discarded packets |
| A | 0 | 13774 | 3 |
| B | 0 | 14476 | 2 |
| C | 0 | 14069 | 2 |
| D | 0 | 14176 | 2 |
| Quadrant | Total seconds | Saturated seconds | Saturation percentage |
|---|---|---|---|
| A | 6689 | 59 | 0.882045% |
| B | 6689 | 88 | 1.315593% |
| C | 6689 | 104 | 1.554791% |
| D | 6689 | 75 | 1.121244% |
Noise dominated data is calculated using 1-second bins in cleaned event files. If a bin has >2000 counts, and if more than 50% of those come from <1% of pixels, then it is considered to be noise-dominated and hence unusable.
| Quadrant | # 1 sec bins | Bins with >0 counts | Bins with >2000 counts | High rate bins dominated by noise | Noise dominated (total time) | Noise dominated (detector-on time) | Marked lightcurve |
|---|---|---|---|---|---|---|---|
| A | 7640 | 6691 | 0 | 0 | 0.00% | 0.00% | 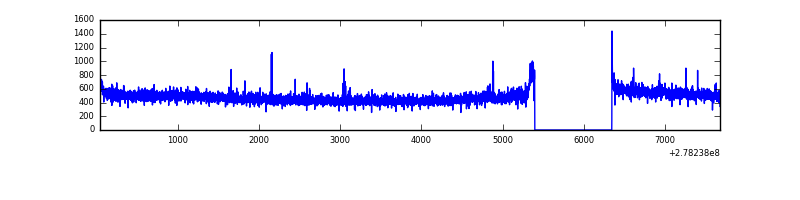 |
| B | 7640 | 6691 | 4 | 4 | 0.05% | 0.06% | 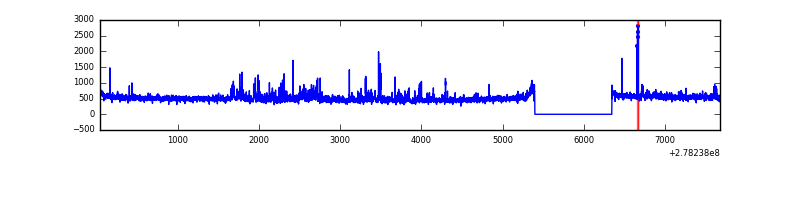 |
| C | 7640 | 6691 | 2 | 2 | 0.03% | 0.03% | 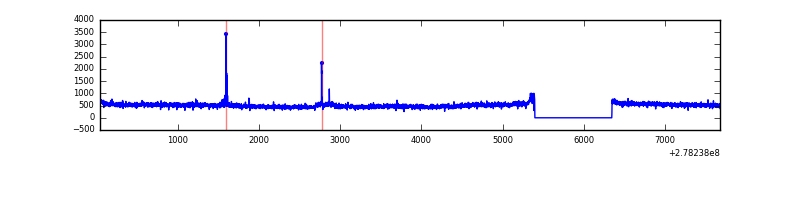 |
| D | 7640 | 6691 | 17 | 17 | 0.22% | 0.25% | 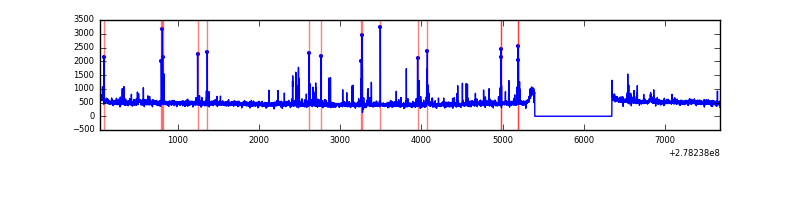 |
Top three noisy pixels from each quadrant. If the there are fewer than three noisy pixels in the level2.evt file, extra rows are filled as -1
| Pixel properties | Quadrant properties | ||||||
|---|---|---|---|---|---|---|---|
| Quadrant | DetID | PixID | Counts | Sigma | Mean | Median | Sigma |
| A | 3 | 1 | 17248 | 97.83 | 824 | 806 | 168.1 |
| A | 15 | 223 | 8241 | 44.24 | 824 | 806 | 168.1 |
| A | 0 | 226 | 7124 | 37.59 | 824 | 806 | 168.1 |
| B | 15 | 35 | 79490 | 492.74 | 823 | 803 | 159.7 |
| B | 0 | 198 | 58422 | 360.81 | 823 | 803 | 159.7 |
| B | 4 | 216 | 47780 | 294.17 | 823 | 803 | 159.7 |
| C | 3 | 233 | 182355 | 981.17 | 789 | 793 | 185.0 |
| C | 14 | 238 | 122082 | 655.45 | 789 | 793 | 185.0 |
| C | 0 | 207 | 18098 | 93.52 | 789 | 793 | 185.0 |
| D | 1 | 52 | 138768 | 700.98 | 804 | 780 | 196.9 |
| D | 10 | 70 | 52344 | 261.94 | 804 | 780 | 196.9 |
| D | 2 | 234 | 25362 | 124.88 | 804 | 780 | 196.9 |
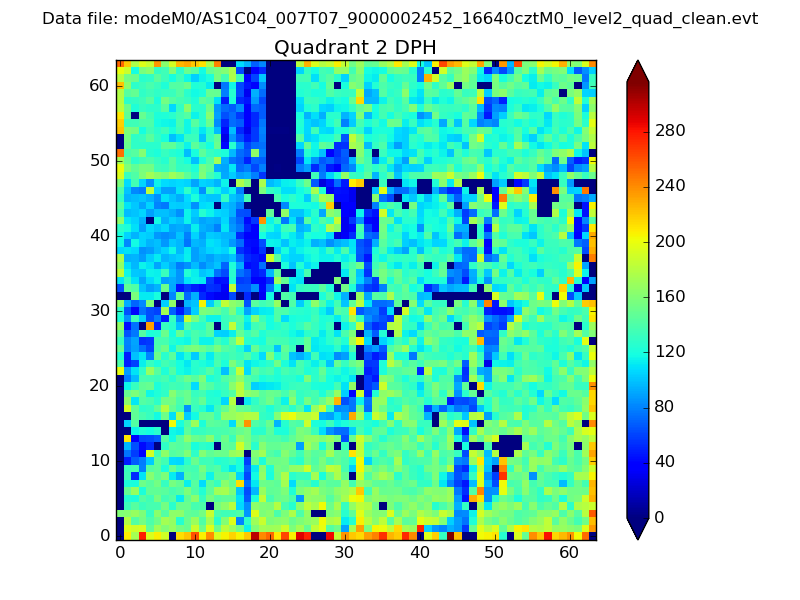
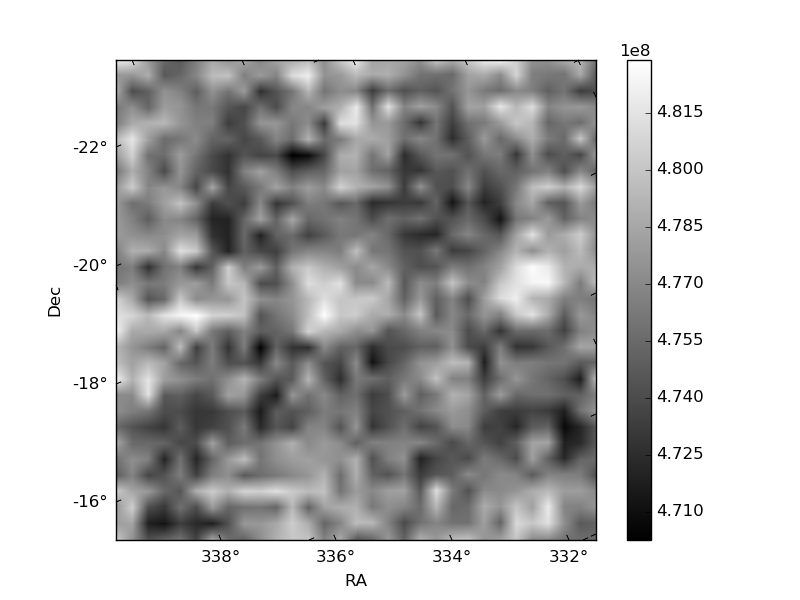
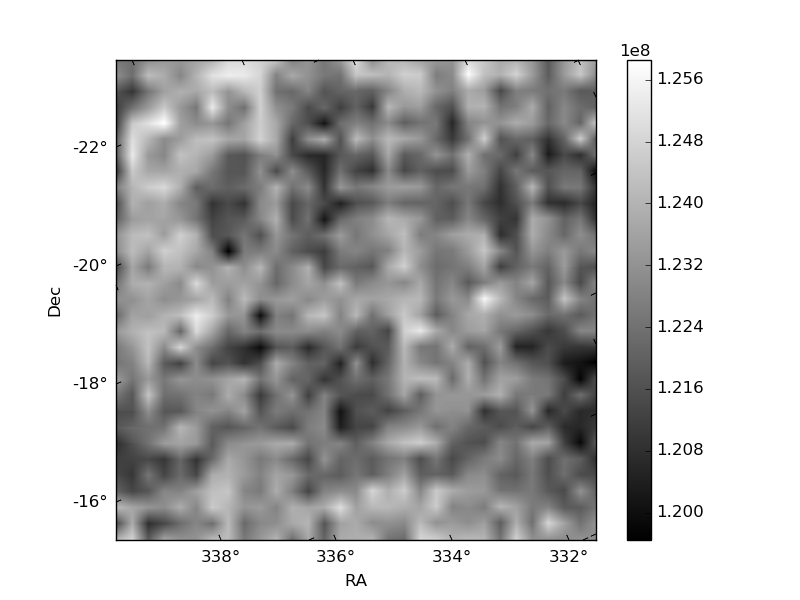
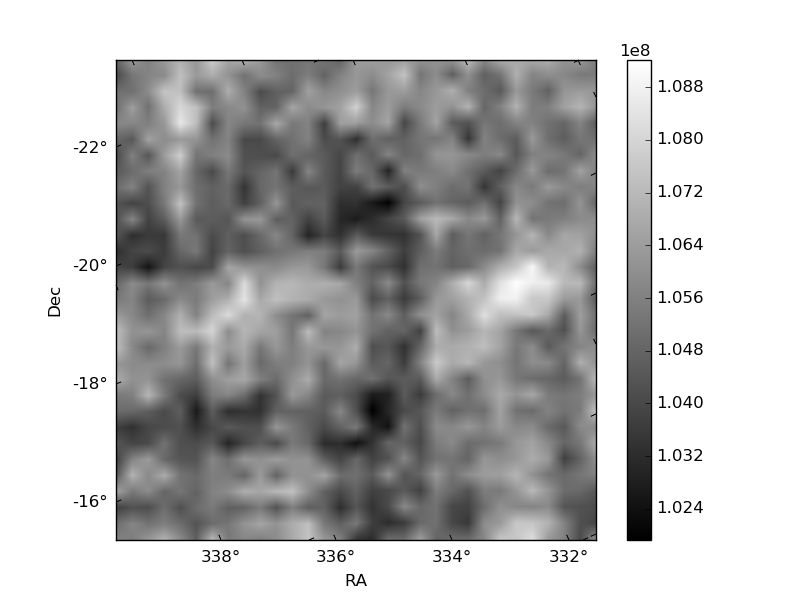
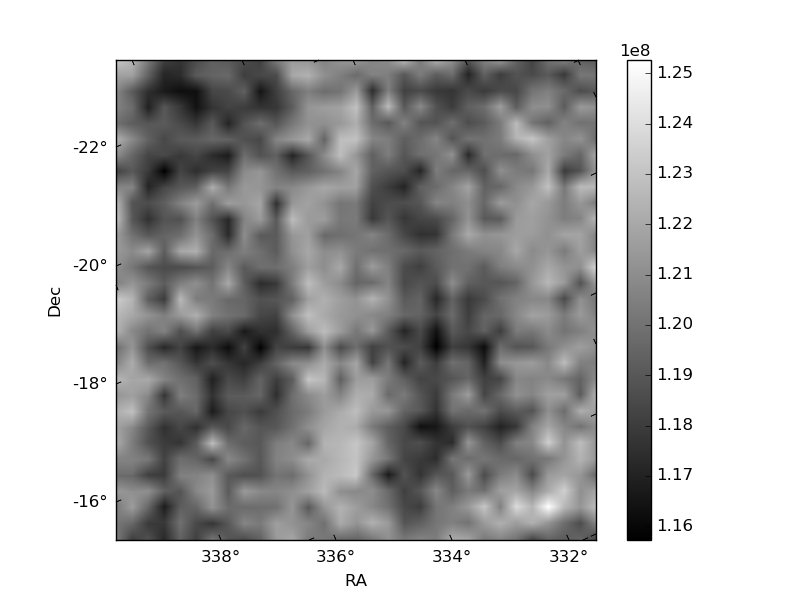
Histogram calculated using DETX and DETY for each event in the final _common_clean file
| Quadrant A | 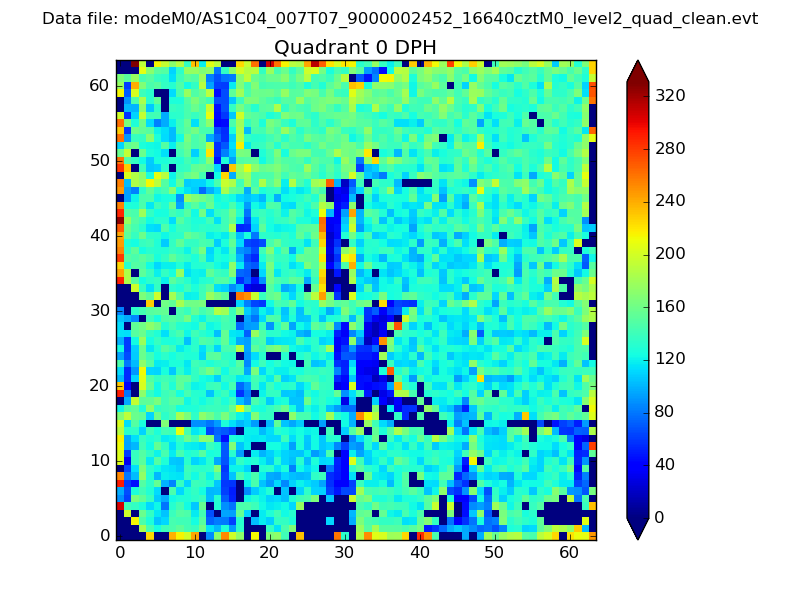 |
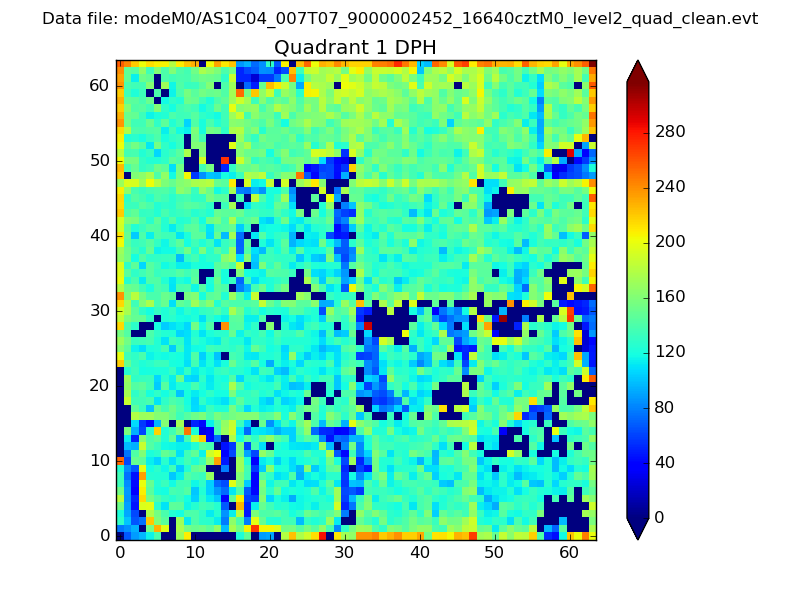 |
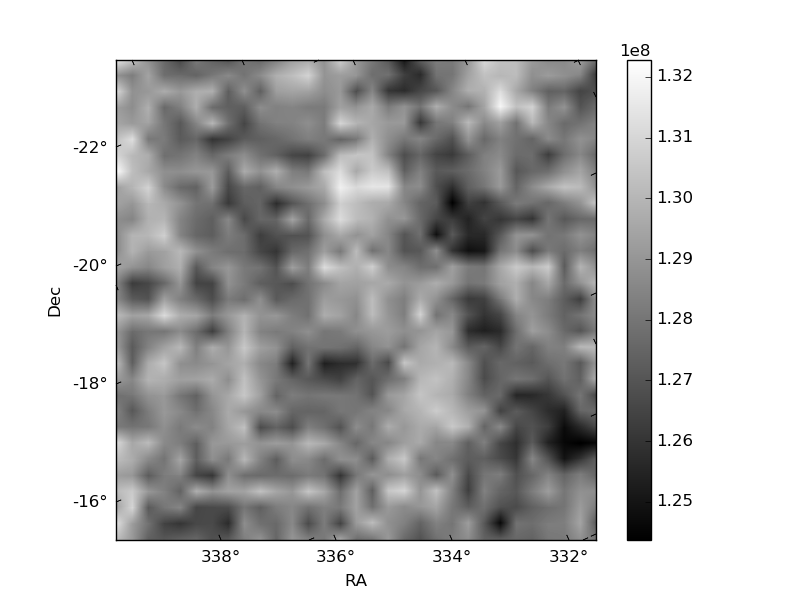
Quadrant B |
|---|---|---|---|
| Quadrant D | 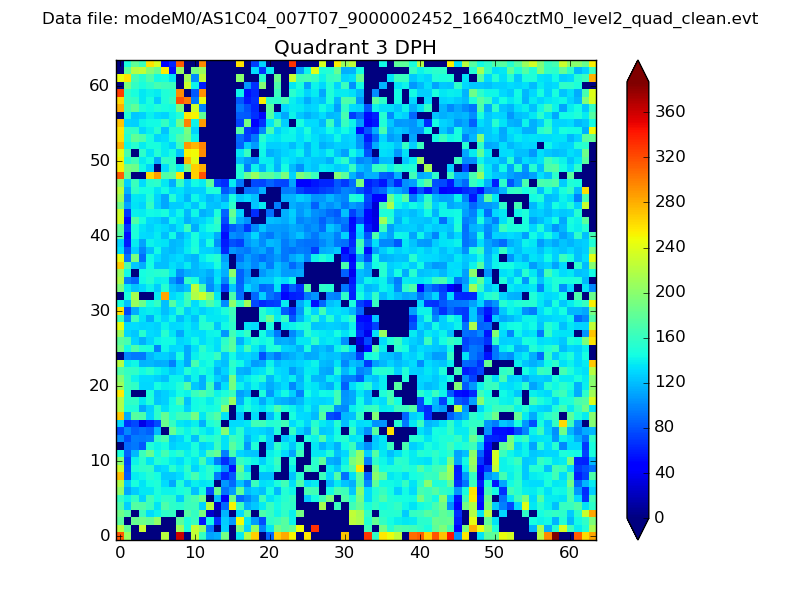 |
 |
Quadrant C |
| Plot type | Count rate plots | Images |
|---|---|---|
| Comparison with Poisson distribution Blue bars denote a histogram of data divided into 1 sec bins. Red curve is a Poisson curve with rate = median count rate of data. |
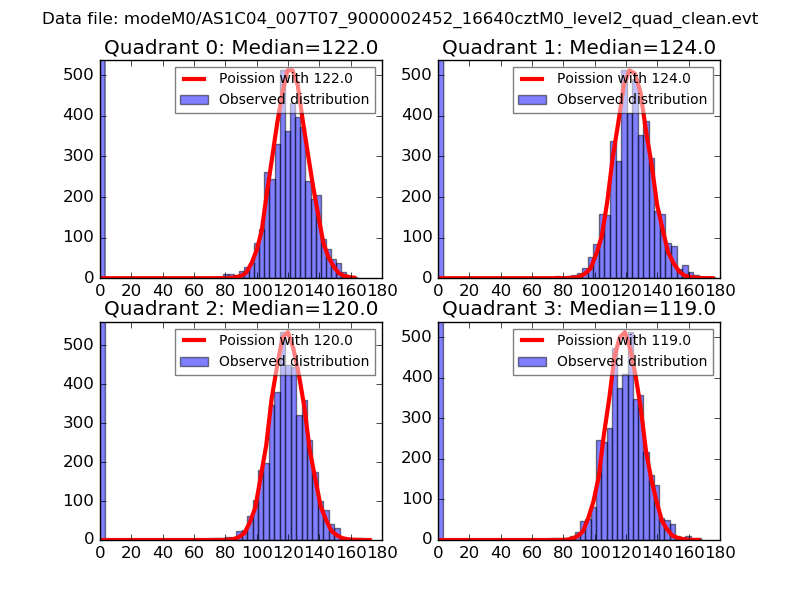 |
 |
| Quadrant-wise count rates Data is divided into 100 sec bins |
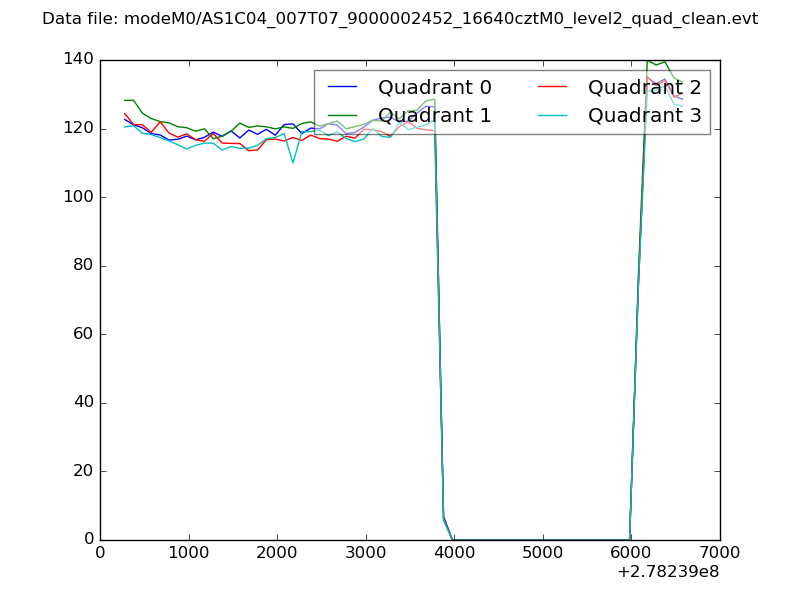 |
|
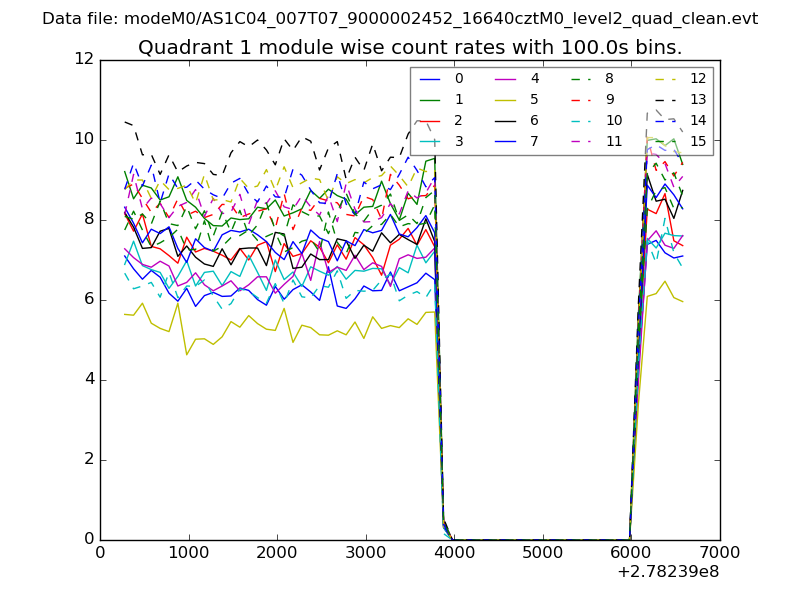
| Module-wise count rates for Quadrant A Data is divided into 100 sec bins |
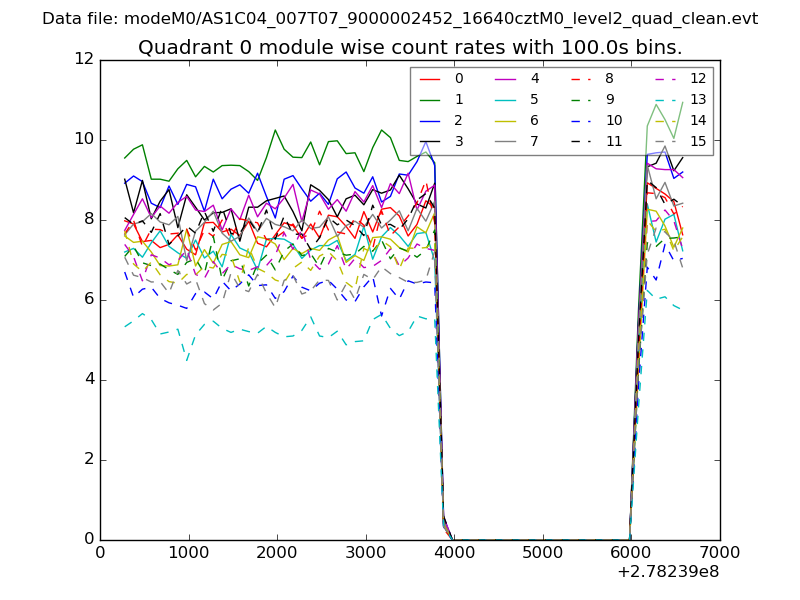 |
 |
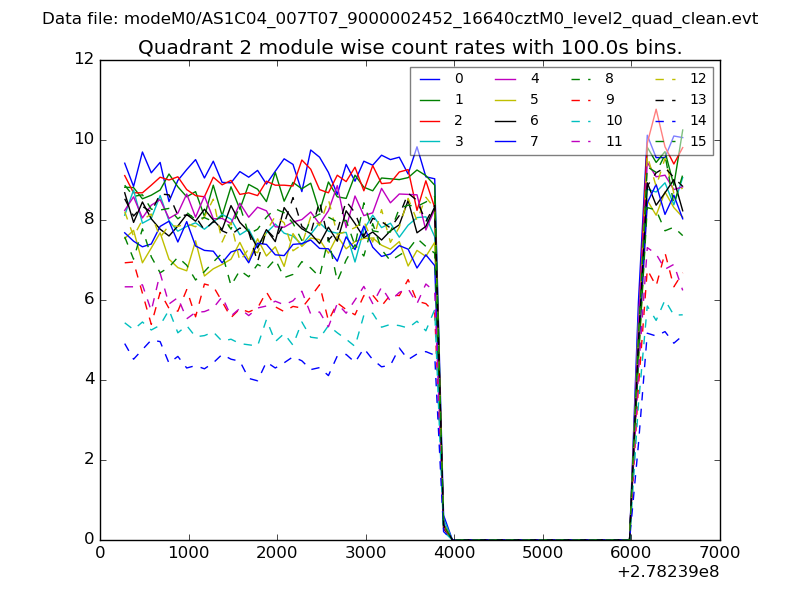
| Module-wise count rates for Quadrant B Data is divided into 100 sec bins |
 |
 |
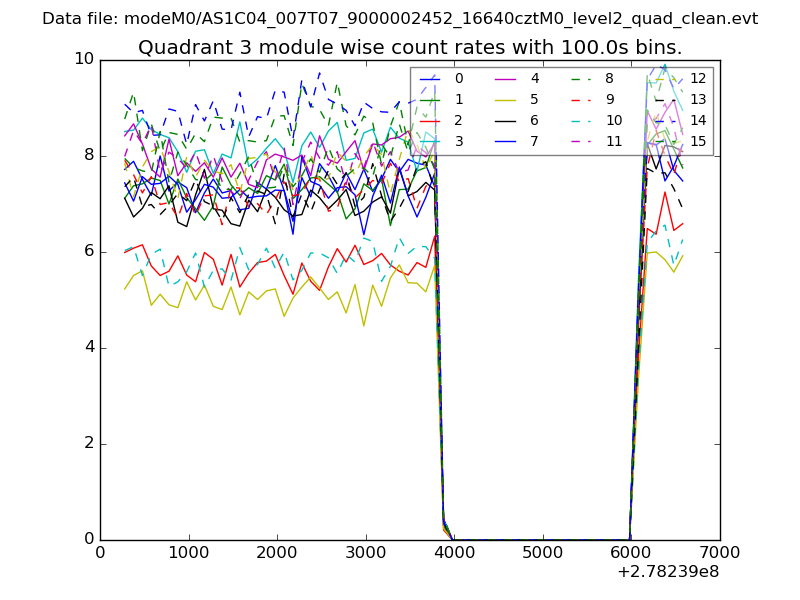
| Module-wise count rates for Quadrant C Data is divided into 100 sec bins |
 |
 |
| Module-wise count rates for Quadrant D Data is divided into 100 sec bins |
 |
 |
| Parameter | Plot |
|---|---|
| CZT HV Monitor | 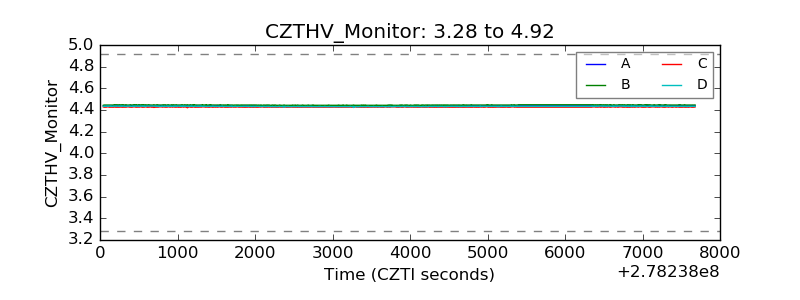 |
| D_VDD | 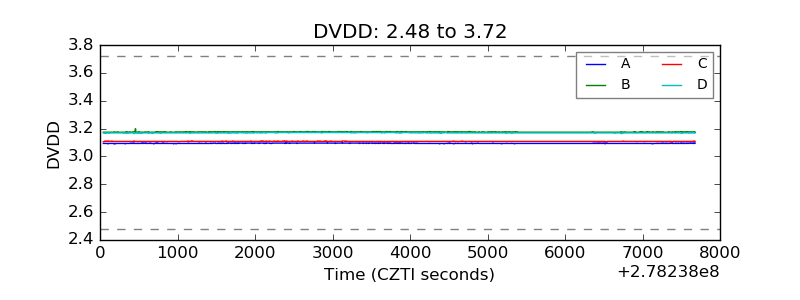 |
| Temperature 1 | 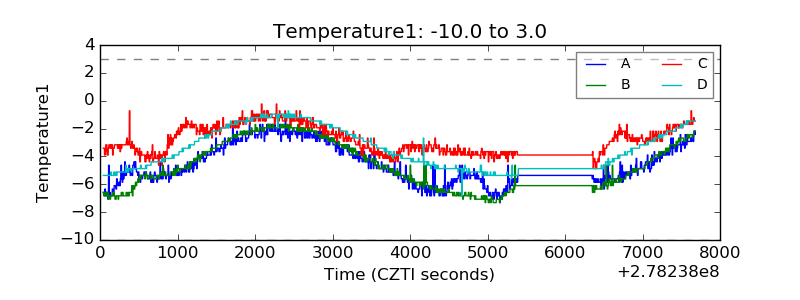 |
| Veto HV Monitor | 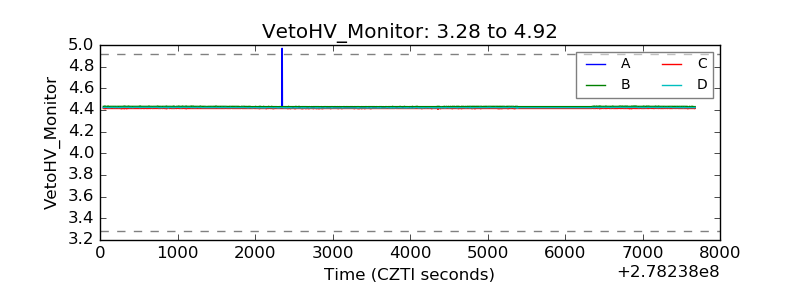 |
| Veto LLD | 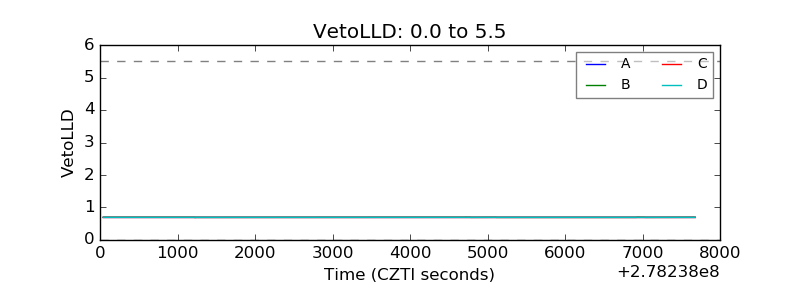 |
| Alpha Counter | 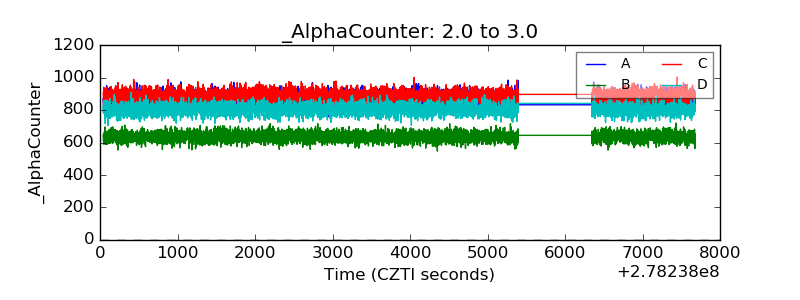 |
| _CPM_Rate | 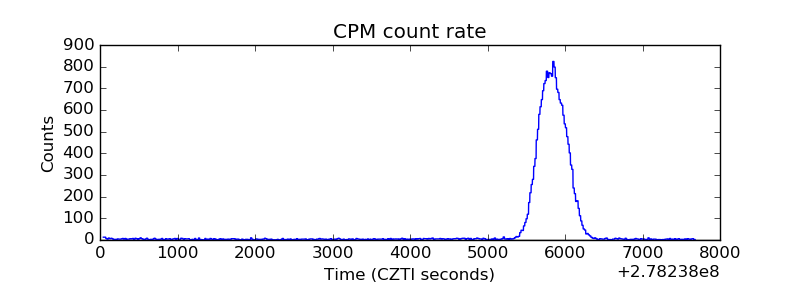 |
| CZT Counter | 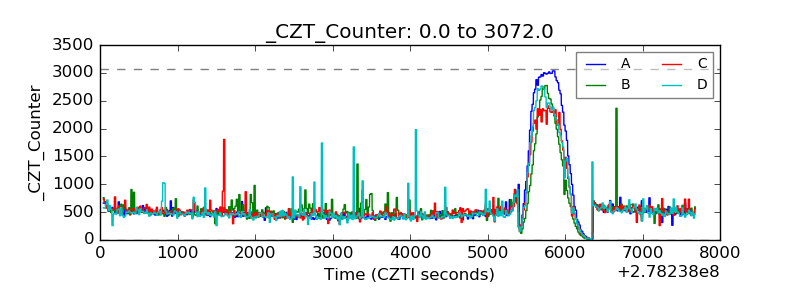 |
| +2.5 Volts monitor | 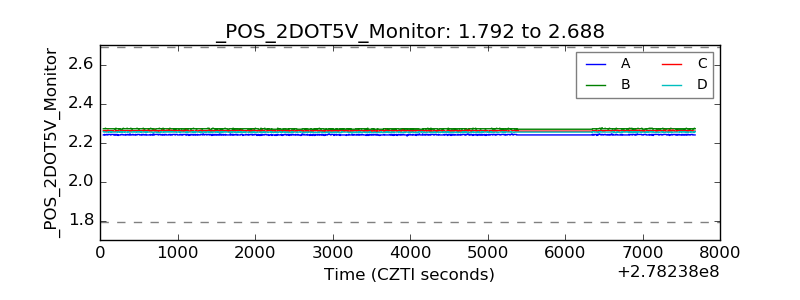 |
| +5 Volts monitor | 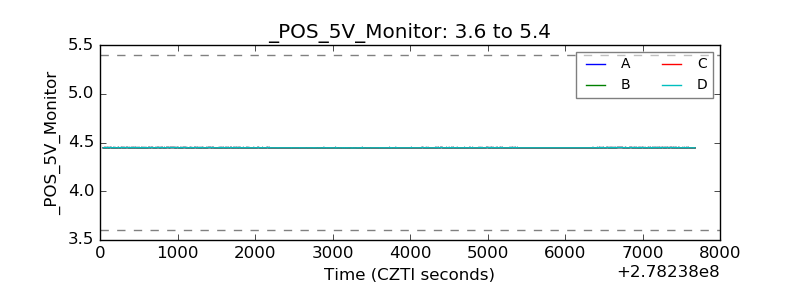 |
| _ROLL_ROT | 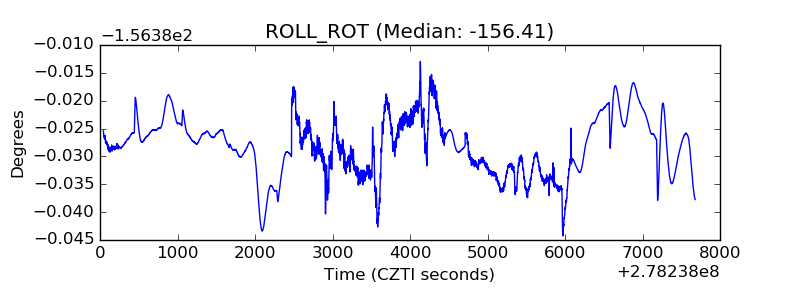 |
| _Roll_DEC | 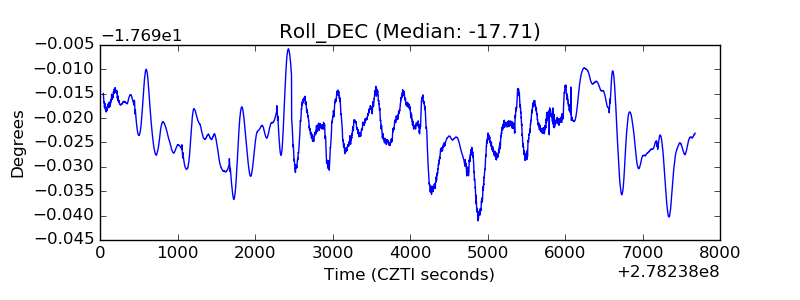 |
| _Roll_RA | 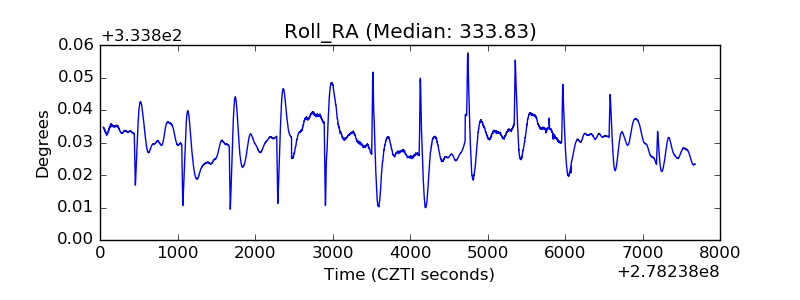 |
| Veto Counter | 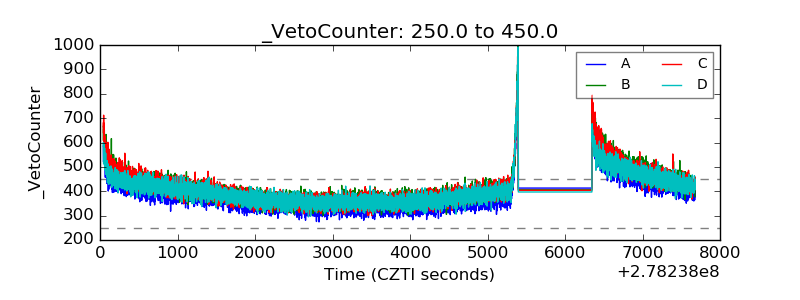 |