| Param | Original file | Final file |
|---|---|---|
| Filename | modeM0/AS1A05_185T04_9000002548_17218cztM0_level2.evt | modeM0/AS1A05_185T04_9000002548_17218cztM0_level2_quad_clean.evt |
| Size (bytes) | 1,367,432,640 | 229,331,520 |
| Size | 1.3 GB | 218.7 MB |
| Events in quadrant A | 8,448,946 | 1,454,398 |
| Events in quadrant B | 8,888,429 | 1,455,350 |
| Events in quadrant C | 10,951,825 | 1,384,807 |
| Events in quadrant D | 11,868,214 | 1,370,557 |
| Mode SS | |||
|---|---|---|---|
| Quadrant | BADHDUFLAG | Total packets | Discarded packets |
| A | 0 | 378 | 0 |
| B | 0 | 378 | 0 |
| C | 0 | 378 | 0 |
| D | 0 | 378 | 0 |
| Mode M9 | |||
|---|---|---|---|
| Quadrant | BADHDUFLAG | Total packets | Discarded packets |
| A | 0 | 17 | 0 |
| B | 0 | 17 | 0 |
| C | 0 | 17 | 0 |
| D | 0 | 17 | 0 |
| Mode M0 | |||
|---|---|---|---|
| Quadrant | BADHDUFLAG | Total packets | Discarded packets |
| A | 0 | 37645 | 4 |
| B | 0 | 38513 | 4 |
| C | 0 | 44868 | 5 |
| D | 0 | 47633 | 4 |
| Quadrant | Total seconds | Saturated seconds | Saturation percentage |
|---|---|---|---|
| A | 18586 | 185 | 0.995373% |
| B | 18587 | 275 | 1.479529% |
| C | 18586 | 317 | 1.705585% |
| D | 18586 | 604 | 3.249758% |
Noise dominated data is calculated using 1-second bins in cleaned event files. If a bin has >2000 counts, and if more than 50% of those come from <1% of pixels, then it is considered to be noise-dominated and hence unusable.
| Quadrant | # 1 sec bins | Bins with >0 counts | Bins with >2000 counts | High rate bins dominated by noise | Noise dominated (total time) | Noise dominated (detector-on time) | Marked lightcurve |
|---|---|---|---|---|---|---|---|
| A | 20351 | 18589 | 0 | 0 | 0.00% | 0.00% | 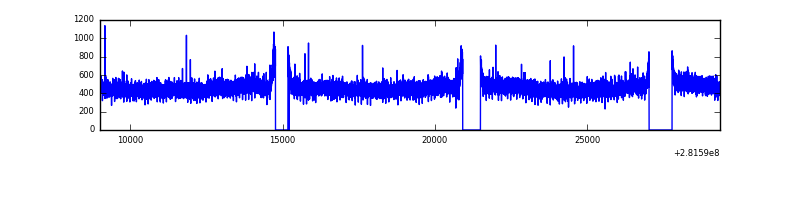 |
| B | 20352 | 18590 | 55 | 55 | 0.27% | 0.30% | 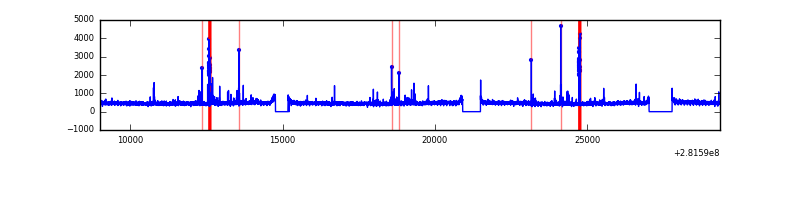 |
| C | 20351 | 18589 | 0 | 0 | 0.00% | 0.00% | 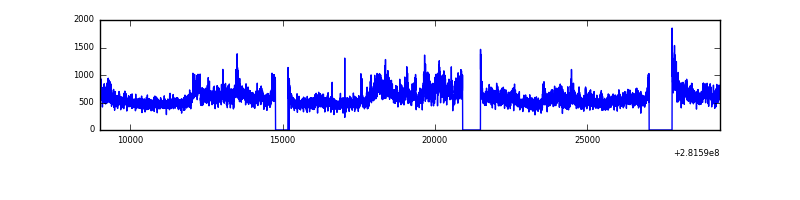 |
| D | 20351 | 18588 | 382 | 382 | 1.88% | 2.06% | 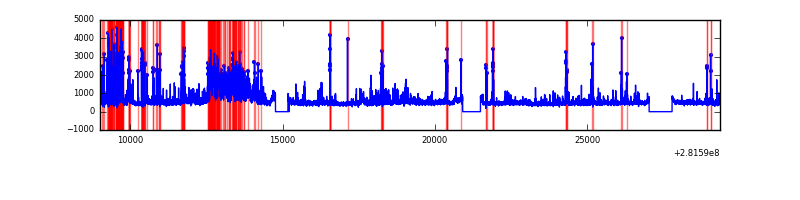 |
Top three noisy pixels from each quadrant. If the there are fewer than three noisy pixels in the level2.evt file, extra rows are filled as -1
| Pixel properties | Quadrant properties | ||||||
|---|---|---|---|---|---|---|---|
| Quadrant | DetID | PixID | Counts | Sigma | Mean | Median | Sigma |
| A | 0 | 226 | 19502 | 39.21 | 2194 | 2142 | 442.8 |
| A | 3 | 137 | 16321 | 32.02 | 2194 | 2142 | 442.8 |
| A | 12 | 194 | 16077 | 31.47 | 2194 | 2142 | 442.8 |
| B | 7 | 220 | 187043 | 441.64 | 2182 | 2121 | 418.7 |
| B | 12 | 111 | 50804 | 116.27 | 2182 | 2121 | 418.7 |
| B | 0 | 197 | 50644 | 115.88 | 2182 | 2121 | 418.7 |
| C | 3 | 233 | 2447828 | 4996.49 | 2094 | 2105 | 489.5 |
| C | 14 | 238 | 321697 | 652.91 | 2094 | 2105 | 489.5 |
| C | 13 | 61 | 15072 | 26.49 | 2094 | 2105 | 489.5 |
| D | 5 | 222 | 2718836 | 5270.85 | 2116 | 2052 | 515.4 |
| D | 1 | 52 | 465251 | 898.65 | 2116 | 2052 | 515.4 |
| D | 13 | 189 | 241131 | 463.84 | 2116 | 2052 | 515.4 |
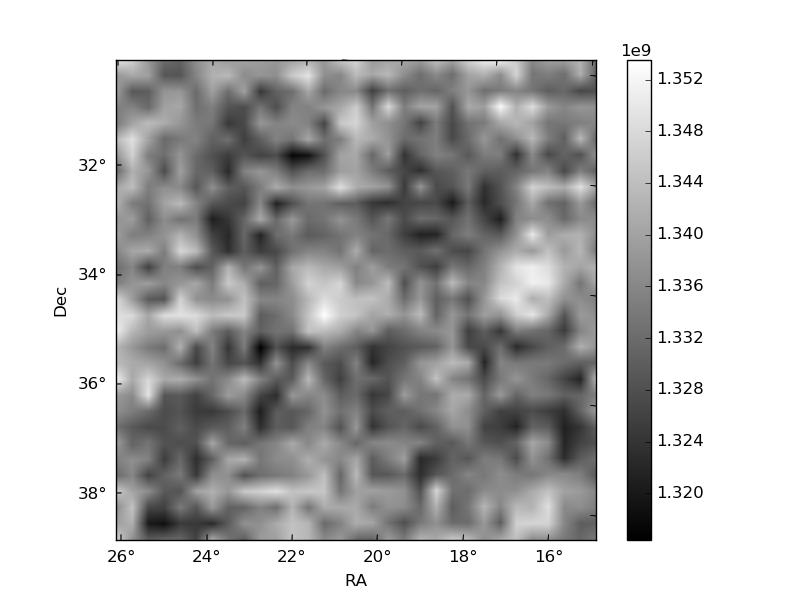
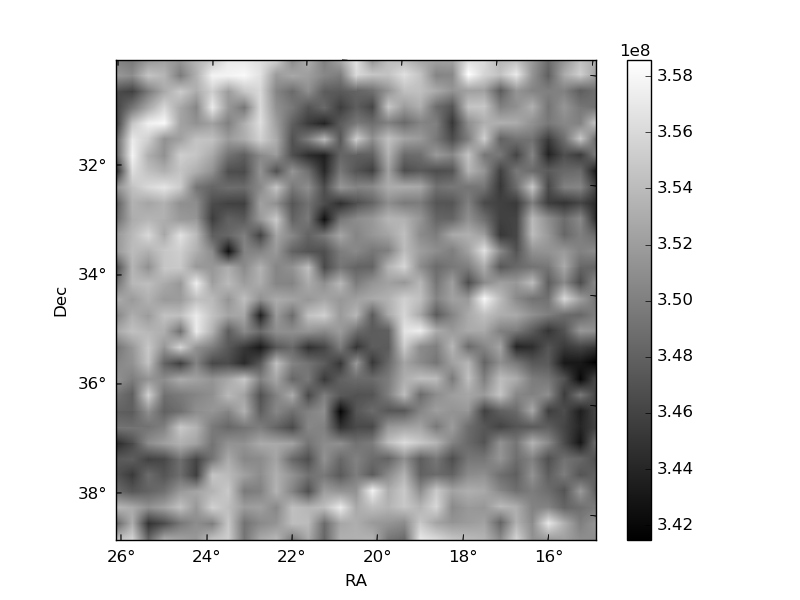
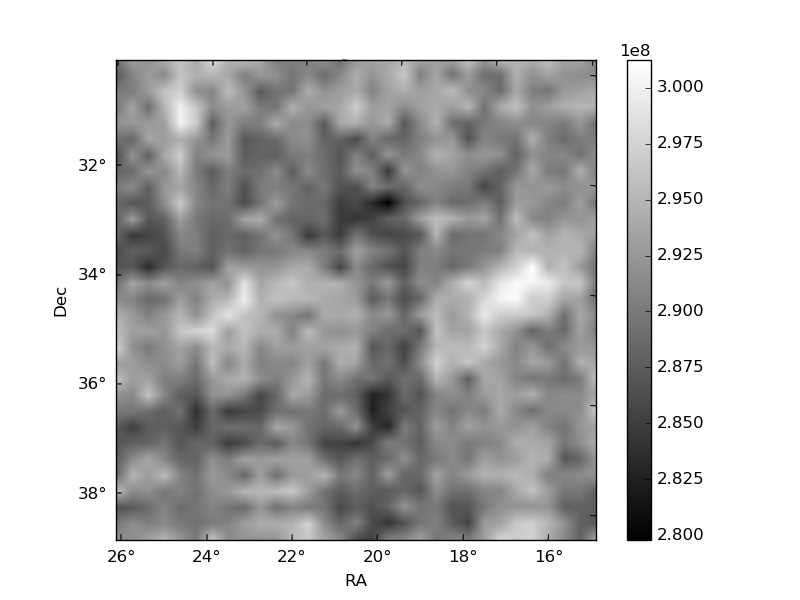
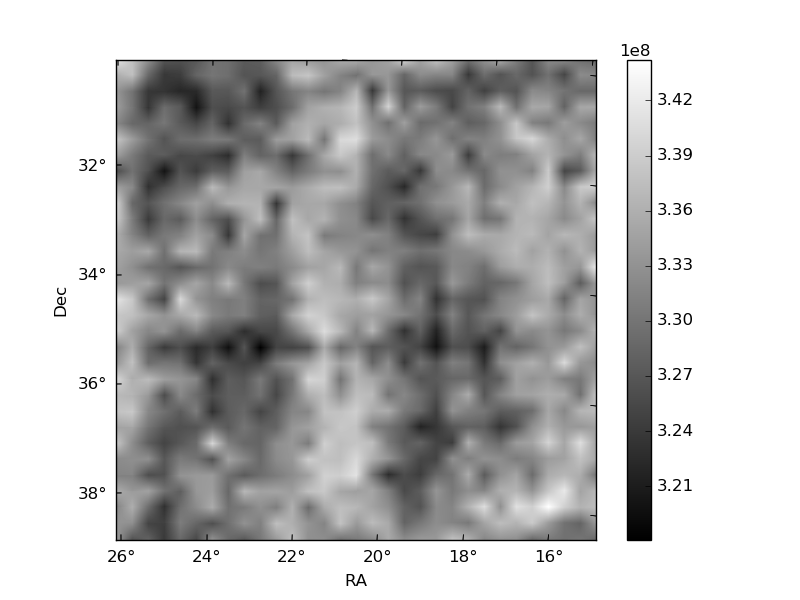
Histogram calculated using DETX and DETY for each event in the final _common_clean file
| Quadrant A | 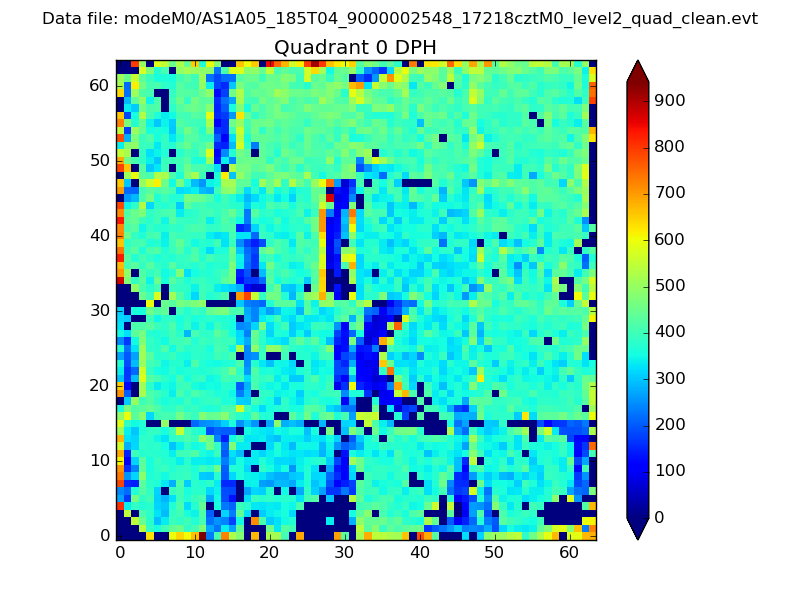 |
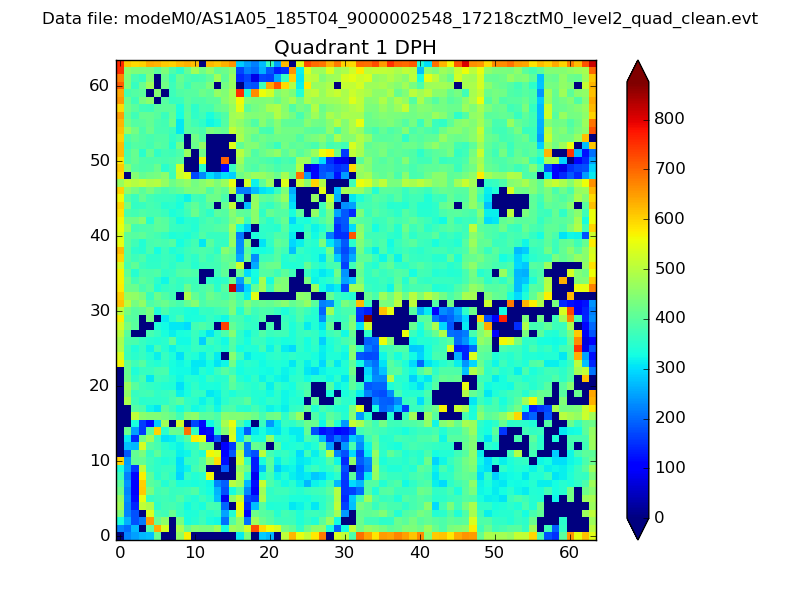 |
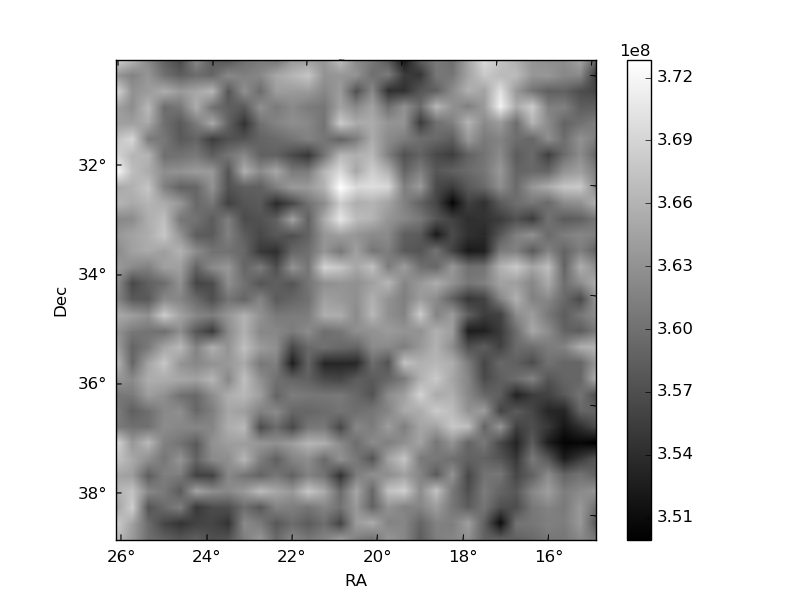
Quadrant B |
|---|---|---|---|
| Quadrant D | 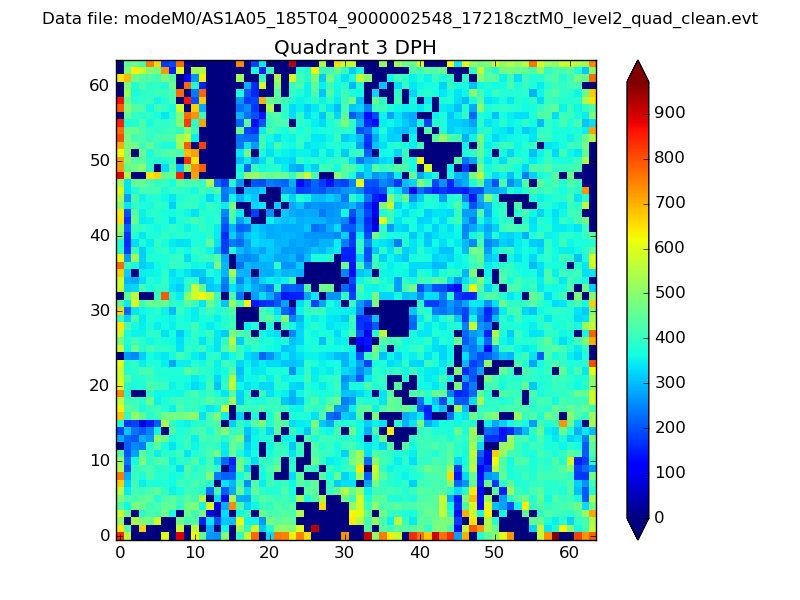 |
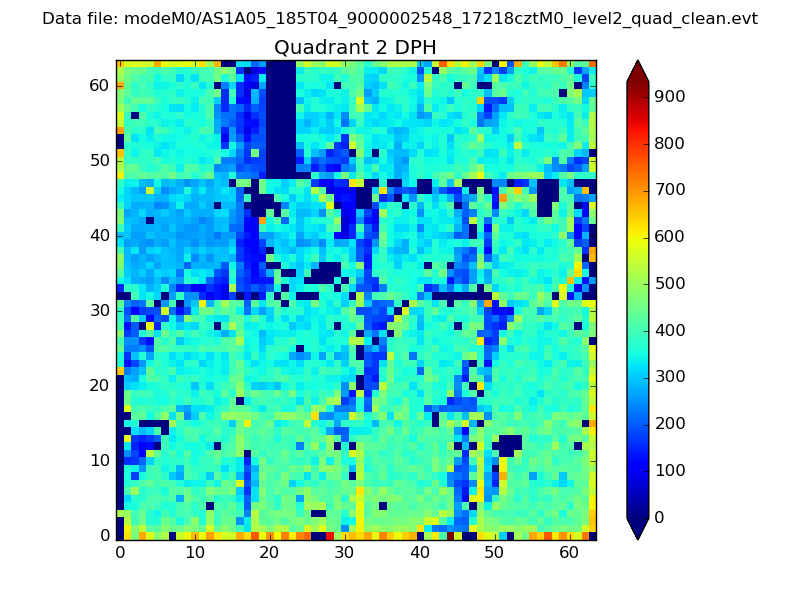 |
Quadrant C |
| Plot type | Count rate plots | Images |
|---|---|---|
| Comparison with Poisson distribution Blue bars denote a histogram of data divided into 1 sec bins. Red curve is a Poisson curve with rate = median count rate of data. |
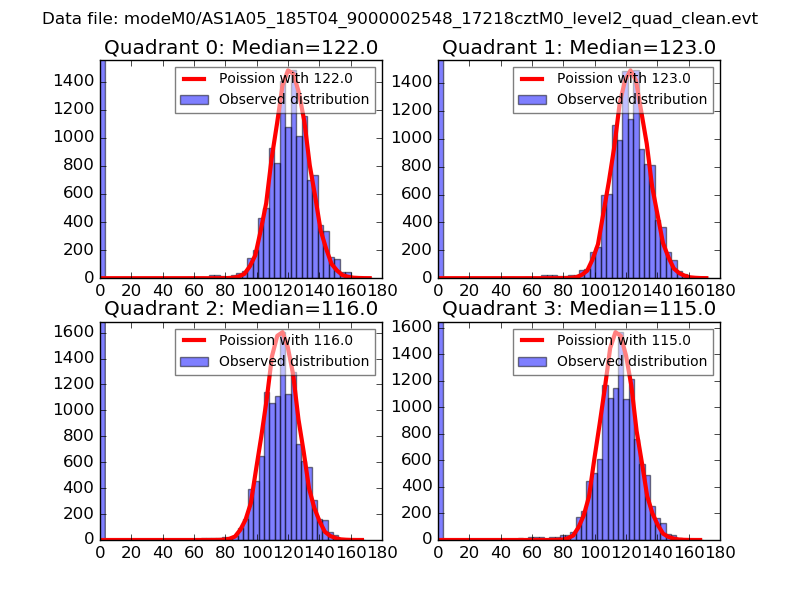 |
 |
| Quadrant-wise count rates Data is divided into 100 sec bins |
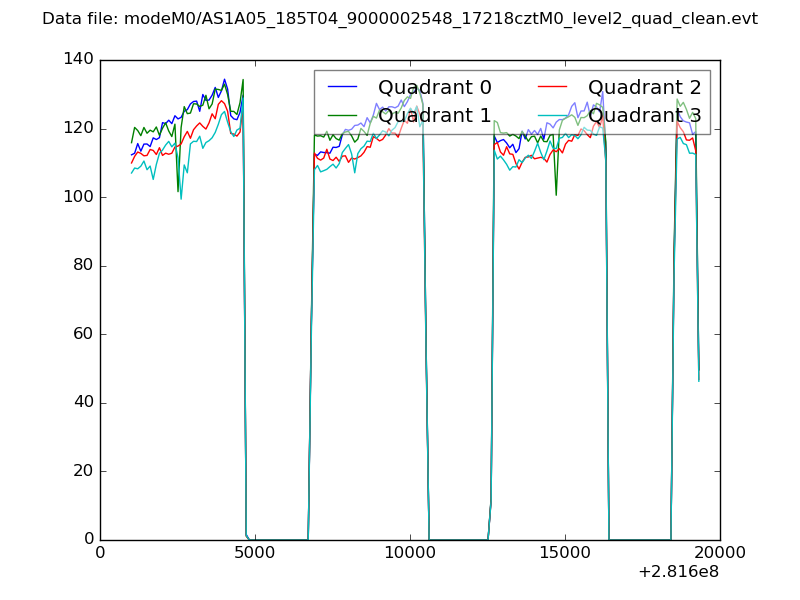 |
|
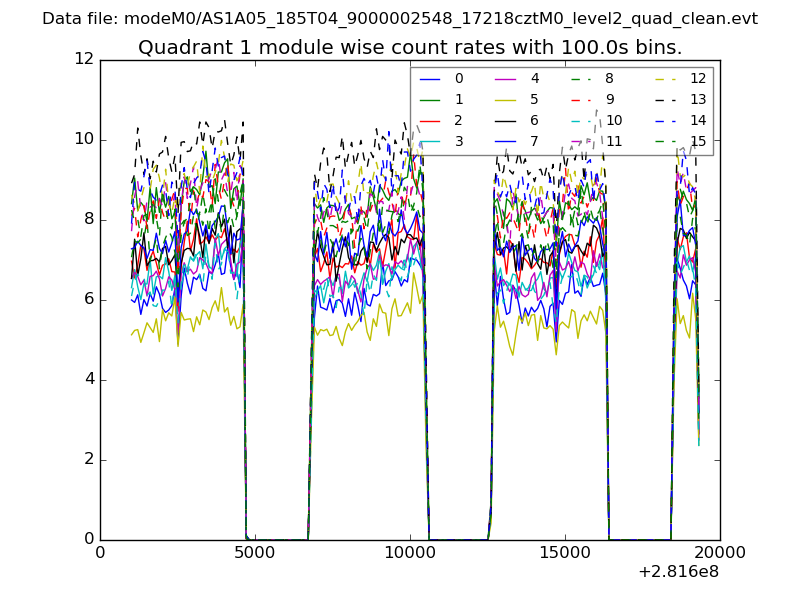
| Module-wise count rates for Quadrant A Data is divided into 100 sec bins |
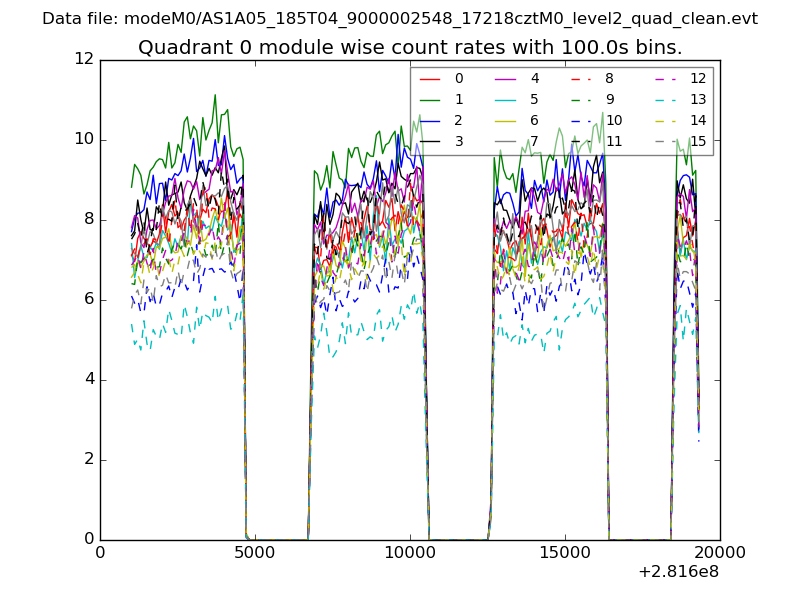 |
 |
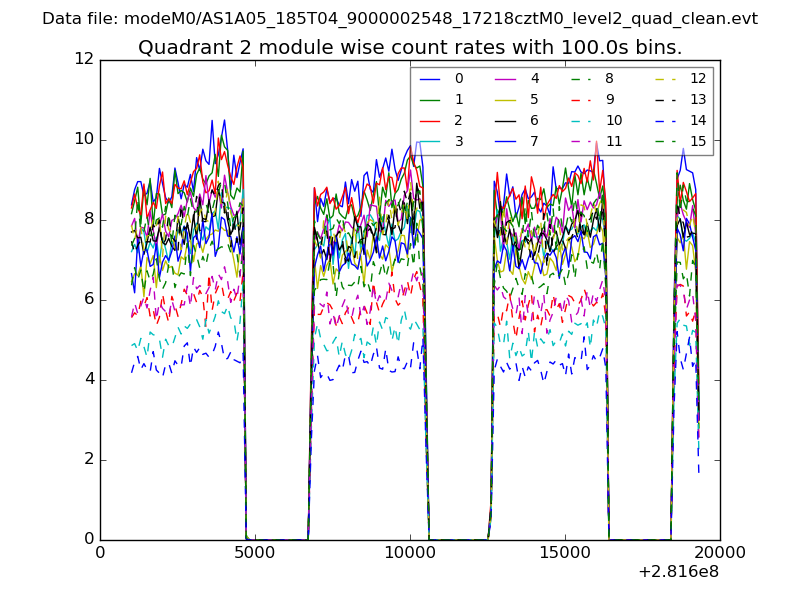
| Module-wise count rates for Quadrant B Data is divided into 100 sec bins |
 |
 |
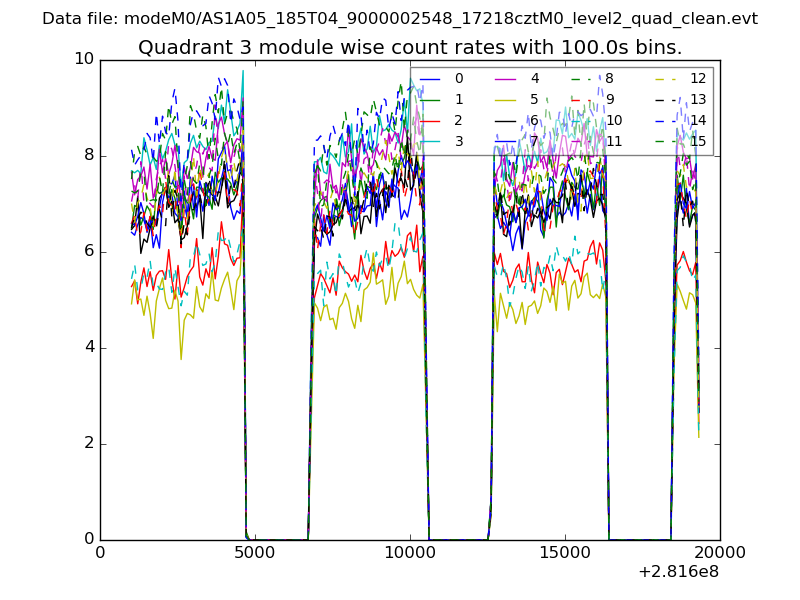
| Module-wise count rates for Quadrant C Data is divided into 100 sec bins |
 |
 |
| Module-wise count rates for Quadrant D Data is divided into 100 sec bins |
 |
 |
| Parameter | Plot |
|---|---|
| CZT HV Monitor | 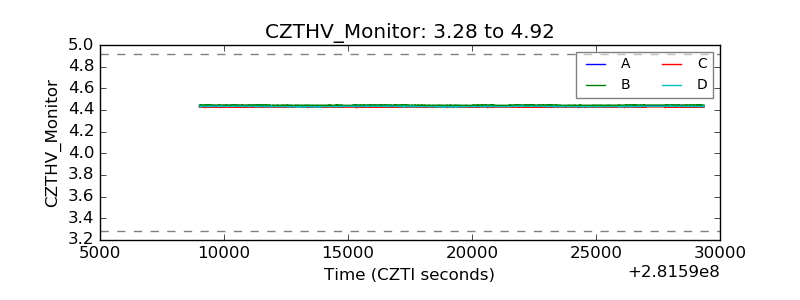 |
| D_VDD | 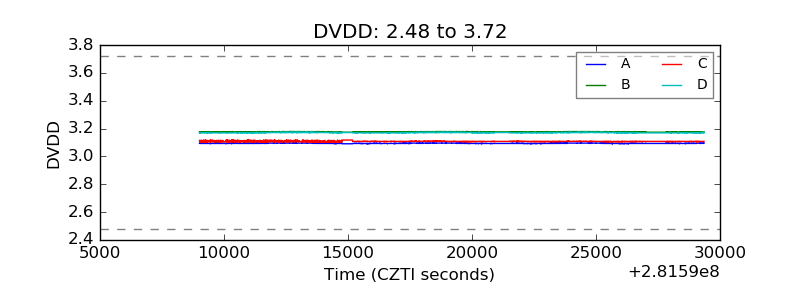 |
| Temperature 1 | 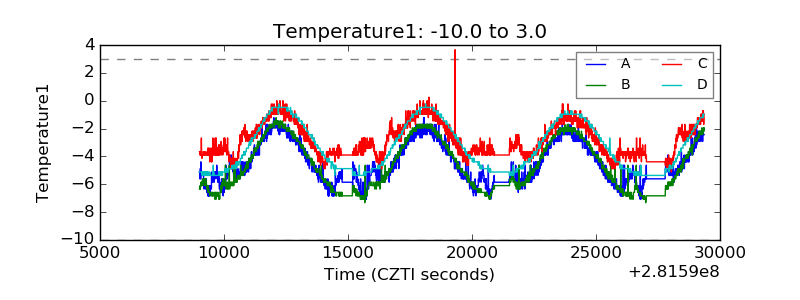 |
| Veto HV Monitor | 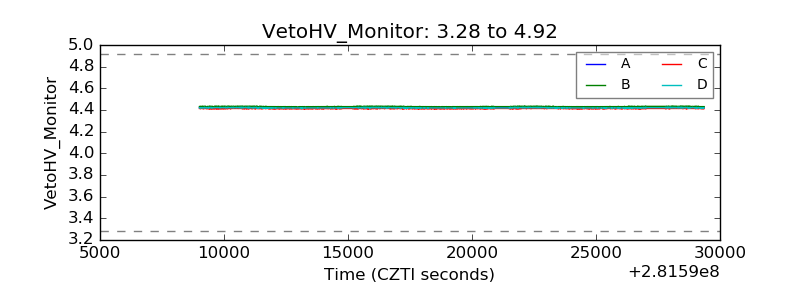 |
| Veto LLD | 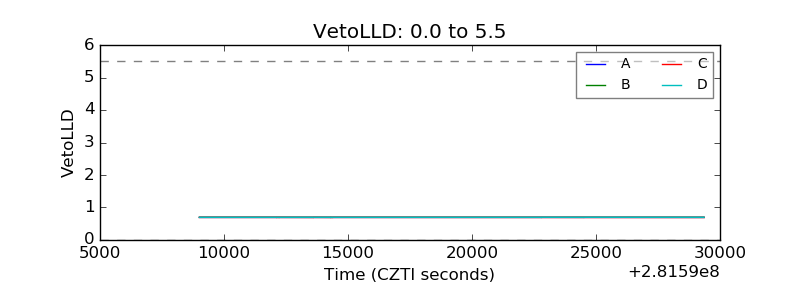 |
| Alpha Counter | 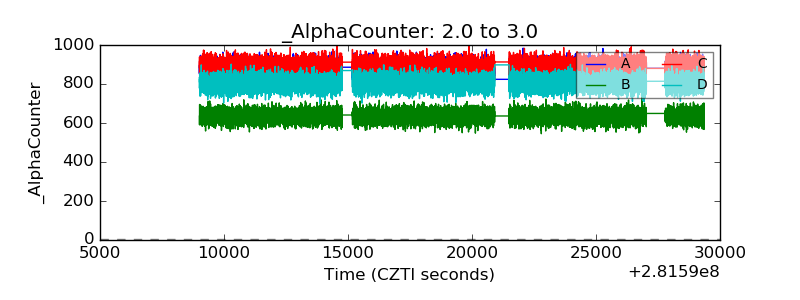 |
| _CPM_Rate | 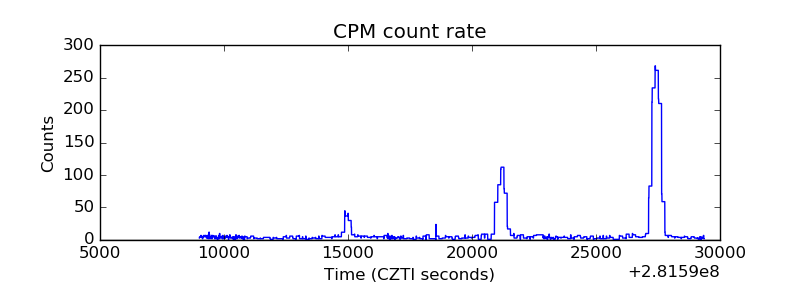 |
| CZT Counter | 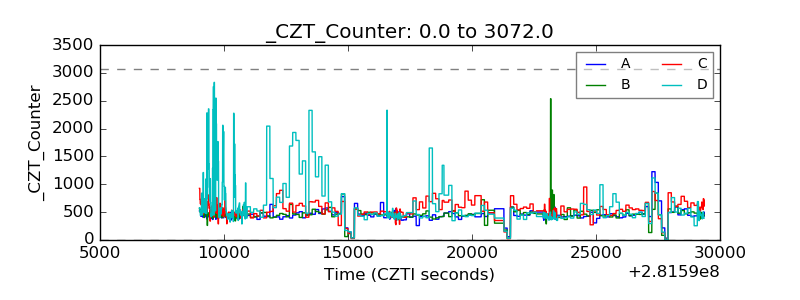 |
| +2.5 Volts monitor | 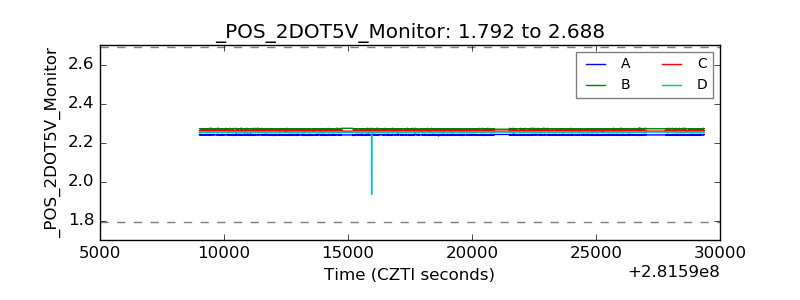 |
| +5 Volts monitor | 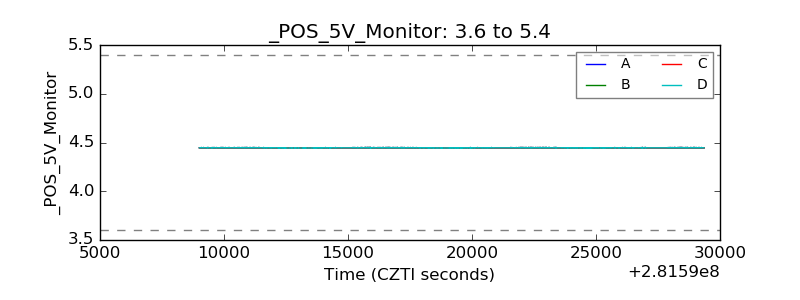 |
| _ROLL_ROT | 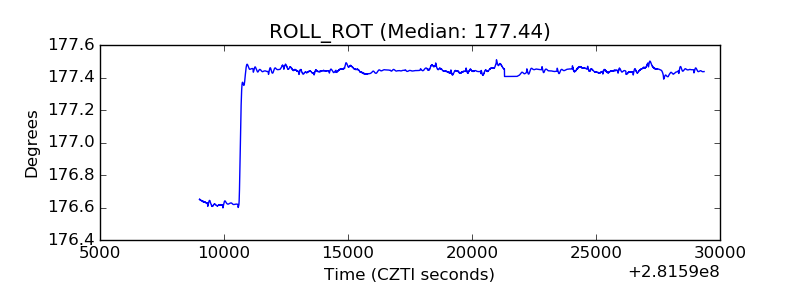 |
| _Roll_DEC | 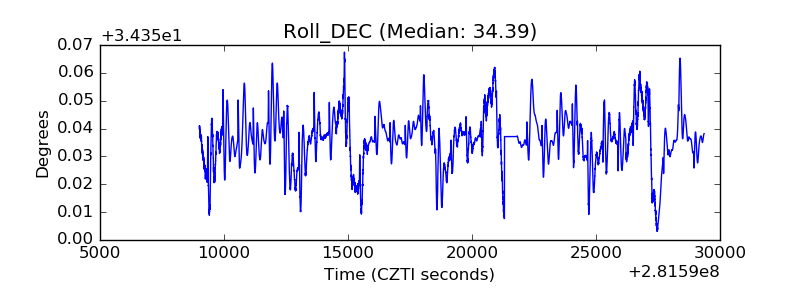 |
| _Roll_RA | 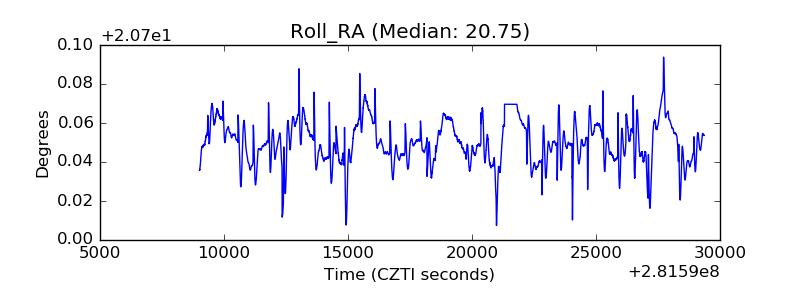 |
| Veto Counter | 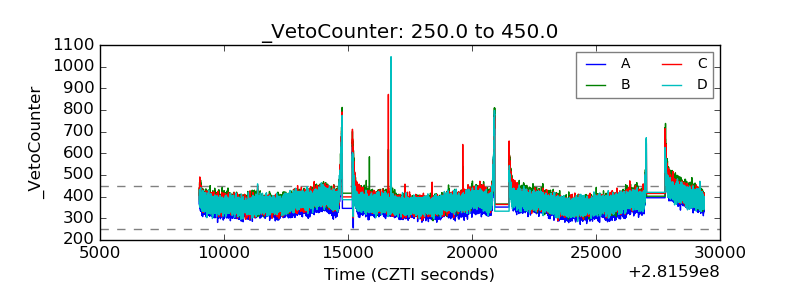 |