| Param | Original file | Final file |
|---|---|---|
| Filename | modeM0/AS1T03_068T01_9000002594_17507cztM0_level2.evt | modeM0/AS1T03_068T01_9000002594_17507cztM0_level2_quad_clean.evt |
| Size (bytes) | 746,660,160 | 153,699,840 |
| Size | 712.1 MB | 146.6 MB |
| Events in quadrant A | 5,298,872 | 981,443 |
| Events in quadrant B | 5,274,268 | 989,137 |
| Events in quadrant C | 5,405,805 | 949,342 |
| Events in quadrant D | 5,856,541 | 942,312 |
| Mode M0 | |||
|---|---|---|---|
| Quadrant | BADHDUFLAG | Total packets | Discarded packets |
| A | 0 | 23662 | 2 |
| B | 0 | 23366 | 2 |
| C | 0 | 23453 | 2 |
| D | 0 | 25688 | 2 |
| Mode SS | |||
|---|---|---|---|
| Quadrant | BADHDUFLAG | Total packets | Discarded packets |
| A | 0 | 234 | 0 |
| B | 0 | 234 | 0 |
| C | 0 | 234 | 0 |
| D | 0 | 234 | 0 |
| Mode M9 | |||
|---|---|---|---|
| Quadrant | BADHDUFLAG | Total packets | Discarded packets |
| A | 0 | 8 | 0 |
| B | 0 | 8 | 0 |
| C | 0 | 8 | 0 |
| D | 0 | 8 | 0 |
| Quadrant | Total seconds | Saturated seconds | Saturation percentage |
|---|---|---|---|
| A | 11459 | 68 | 0.593420% |
| B | 11460 | 76 | 0.663176% |
| C | 11460 | 83 | 0.724258% |
| D | 11460 | 184 | 1.605585% |
Noise dominated data is calculated using 1-second bins in cleaned event files. If a bin has >2000 counts, and if more than 50% of those come from <1% of pixels, then it is considered to be noise-dominated and hence unusable.
| Quadrant | # 1 sec bins | Bins with >0 counts | Bins with >2000 counts | High rate bins dominated by noise | Noise dominated (total time) | Noise dominated (detector-on time) | Marked lightcurve |
|---|---|---|---|---|---|---|---|
| A | 11974 | 11460 | 23 | 23 | 0.19% | 0.20% | 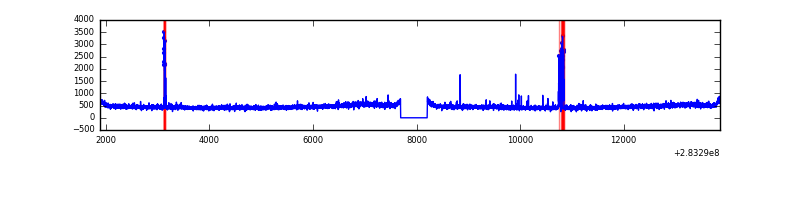 |
| B | 11975 | 11461 | 3 | 3 | 0.03% | 0.03% | 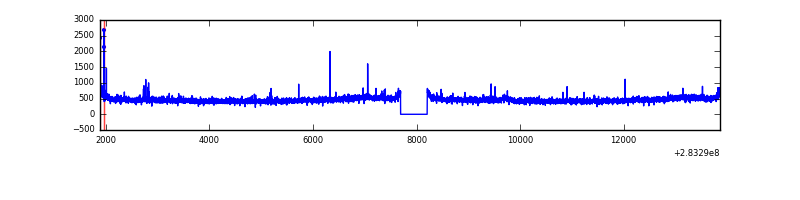 |
| C | 11975 | 11461 | 2 | 2 | 0.02% | 0.02% | 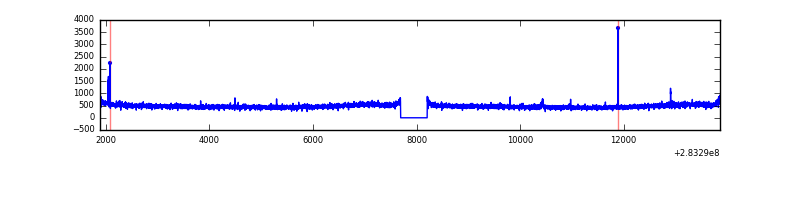 |
| D | 11975 | 11461 | 136 | 136 | 1.14% | 1.19% | 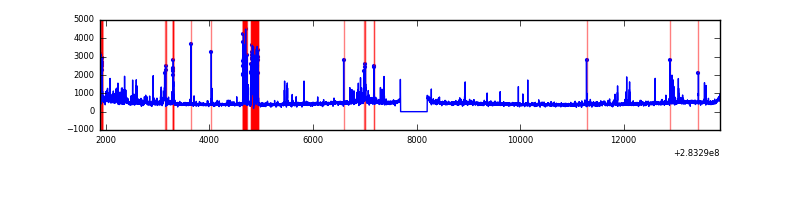 |
Top three noisy pixels from each quadrant. If the there are fewer than three noisy pixels in the level2.evt file, extra rows are filled as -1
| Pixel properties | Quadrant properties | ||||||
|---|---|---|---|---|---|---|---|
| Quadrant | DetID | PixID | Counts | Sigma | Mean | Median | Sigma |
| A | 15 | 174 | 110595 | 405.37 | 1335 | 1308 | 269.6 |
| A | 13 | 210 | 37805 | 135.38 | 1335 | 1308 | 269.6 |
| A | 0 | 226 | 11650 | 38.36 | 1335 | 1308 | 269.6 |
| B | 12 | 111 | 30666 | 115.65 | 1330 | 1294 | 254.0 |
| B | 11 | 111 | 26405 | 98.88 | 1330 | 1294 | 254.0 |
| B | 0 | 219 | 23912 | 89.06 | 1330 | 1294 | 254.0 |
| C | 14 | 238 | 195928 | 652.16 | 1283 | 1290 | 298.5 |
| C | 3 | 233 | 94573 | 312.55 | 1283 | 1290 | 298.5 |
| C | 5 | 218 | 61555 | 201.92 | 1283 | 1290 | 298.5 |
| D | 13 | 232 | 414420 | 1319.31 | 1298 | 1258 | 313.2 |
| D | 13 | 189 | 239595 | 761.06 | 1298 | 1258 | 313.2 |
| D | 11 | 176 | 150073 | 475.2 | 1298 | 1258 | 313.2 |
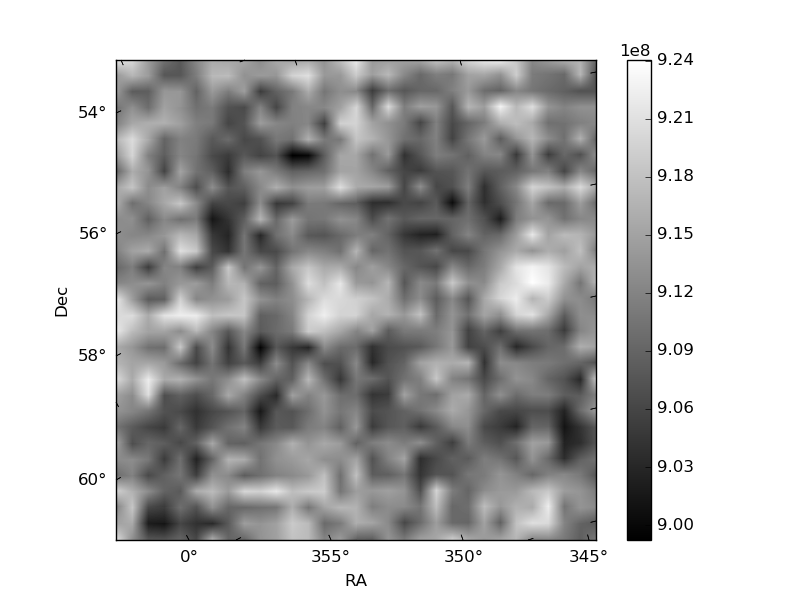
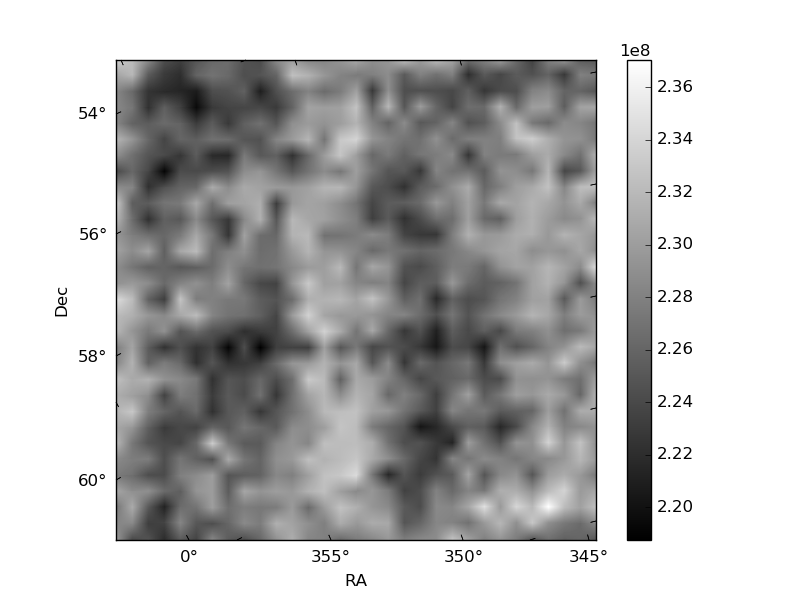
Histogram calculated using DETX and DETY for each event in the final _common_clean file
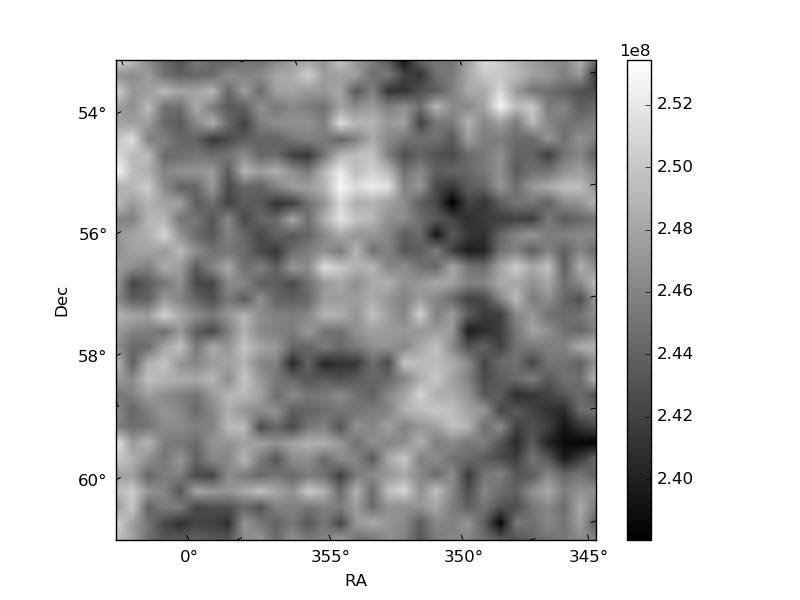
| Quadrant A | 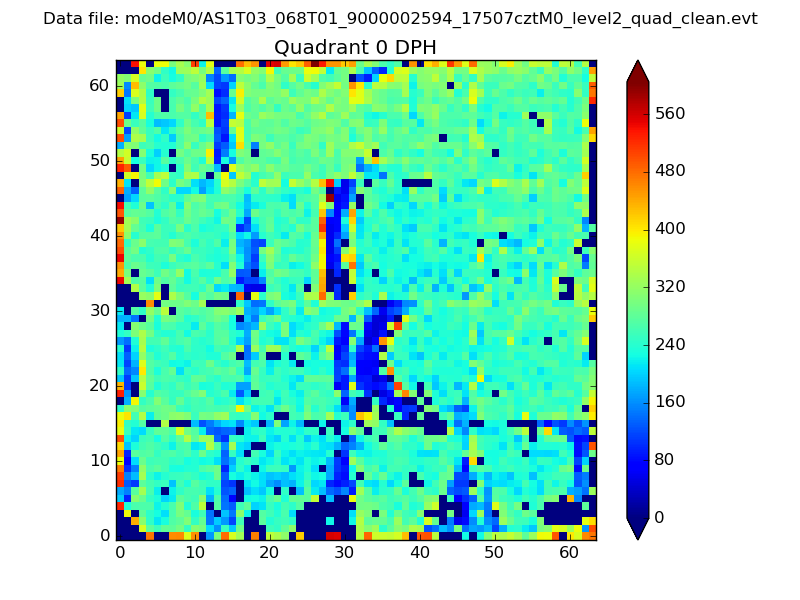 |
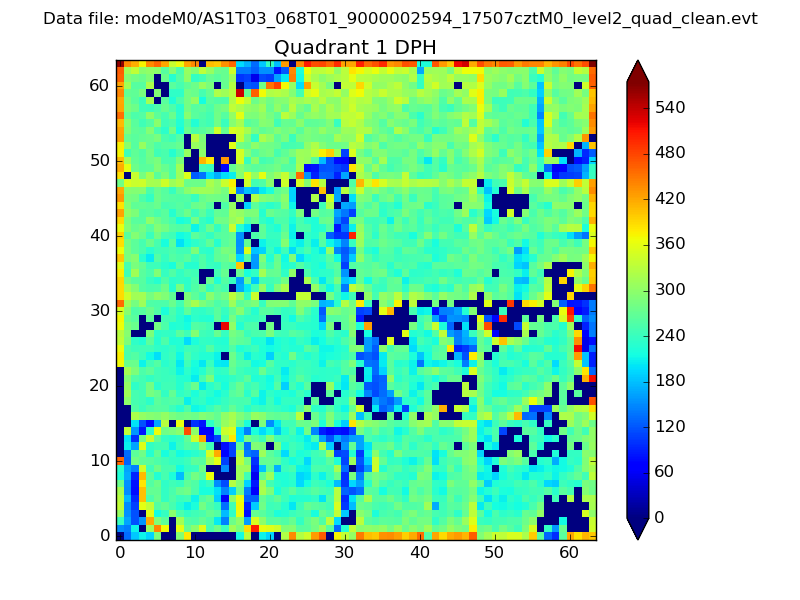 |
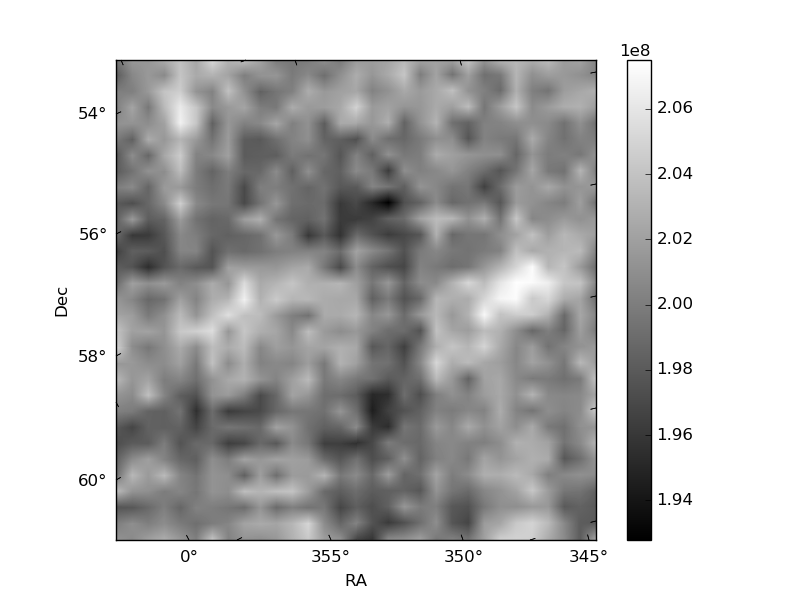
Quadrant B |
|---|---|---|---|
| Quadrant D | 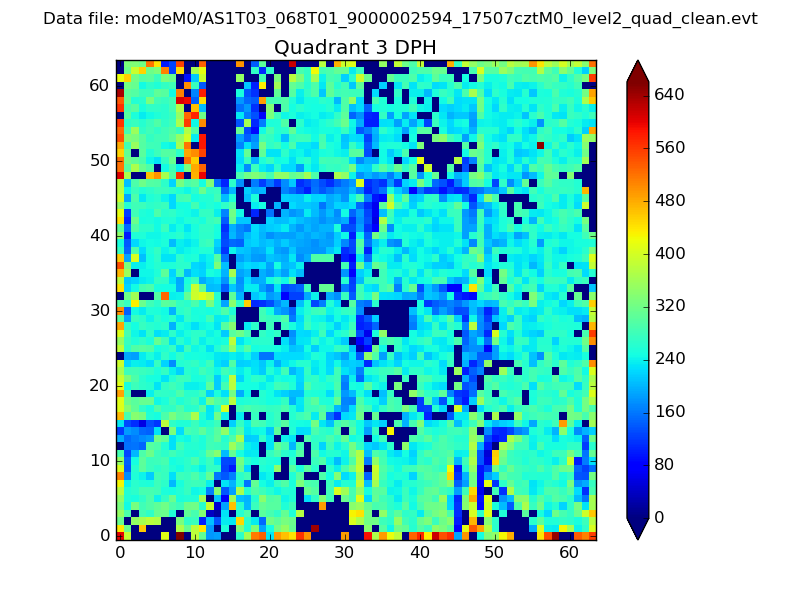 |
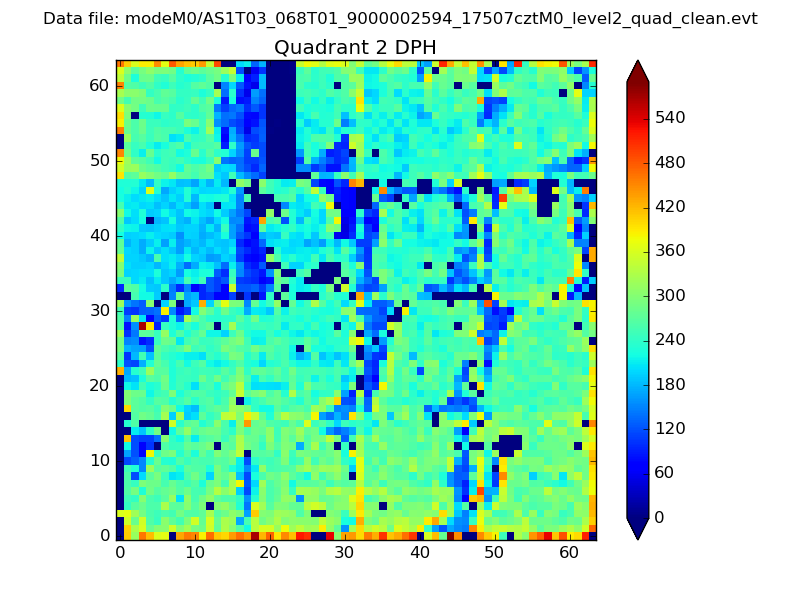 |
Quadrant C |
| Plot type | Count rate plots | Images |
|---|---|---|
| Comparison with Poisson distribution Blue bars denote a histogram of data divided into 1 sec bins. Red curve is a Poisson curve with rate = median count rate of data. |
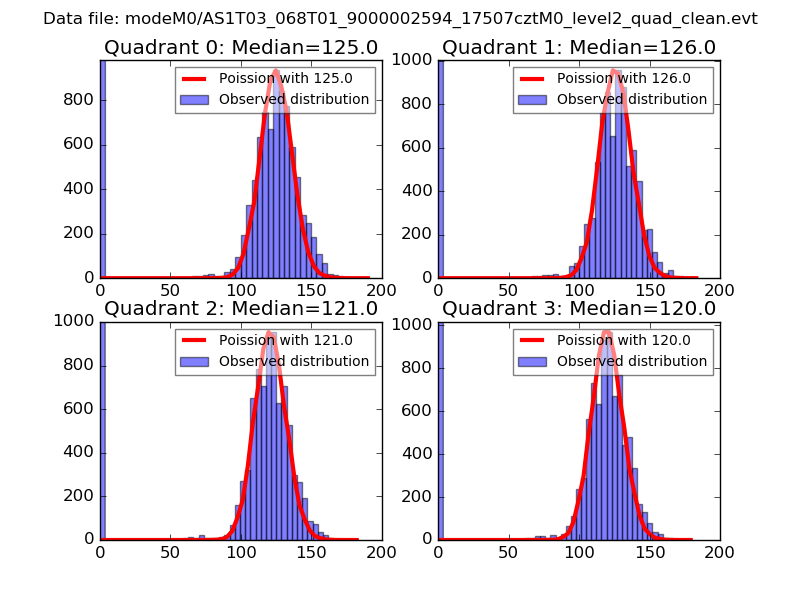 |
 |
| Quadrant-wise count rates Data is divided into 100 sec bins |
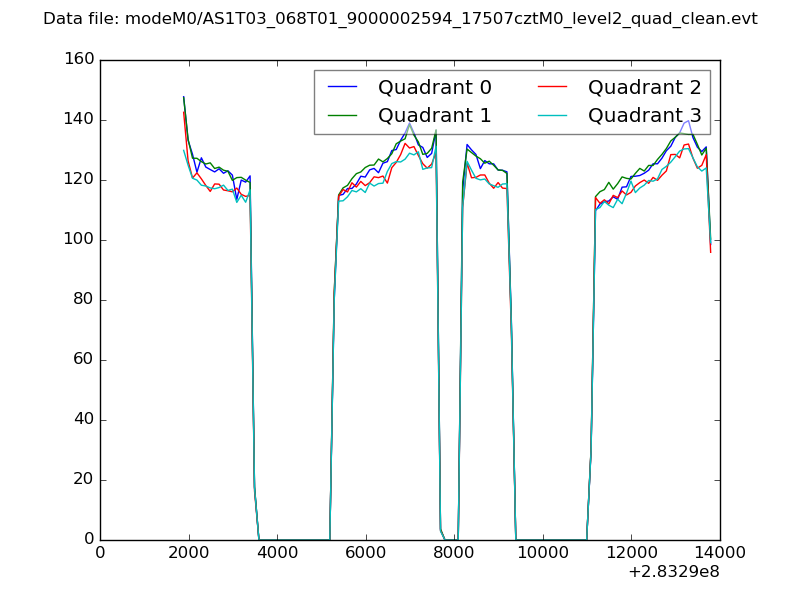 |
|
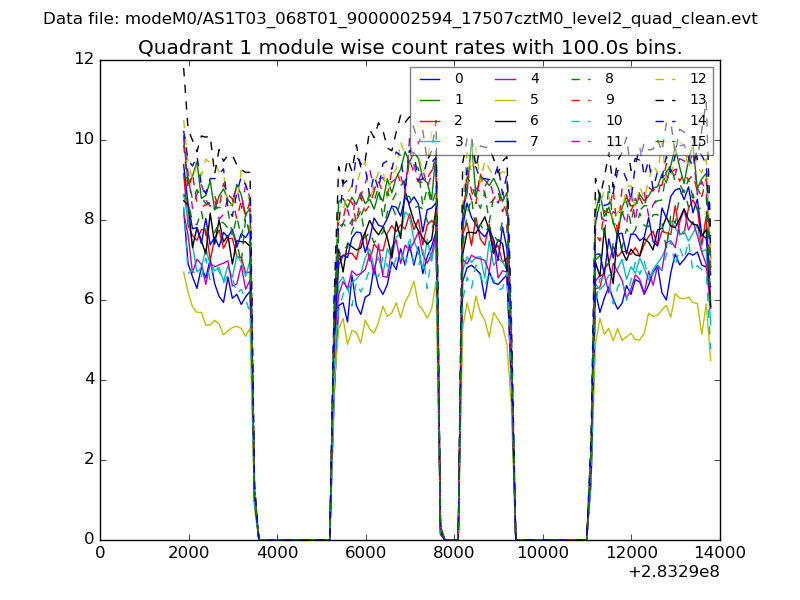
| Module-wise count rates for Quadrant A Data is divided into 100 sec bins |
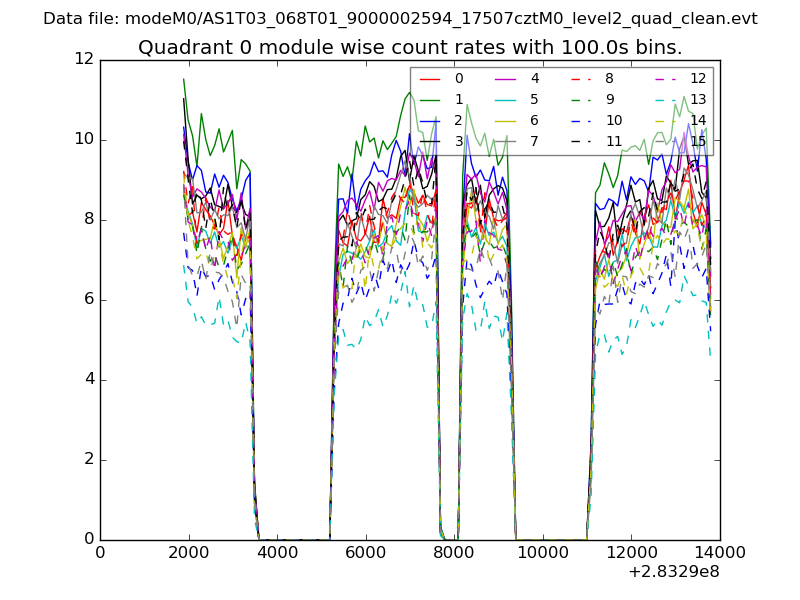 |
 |
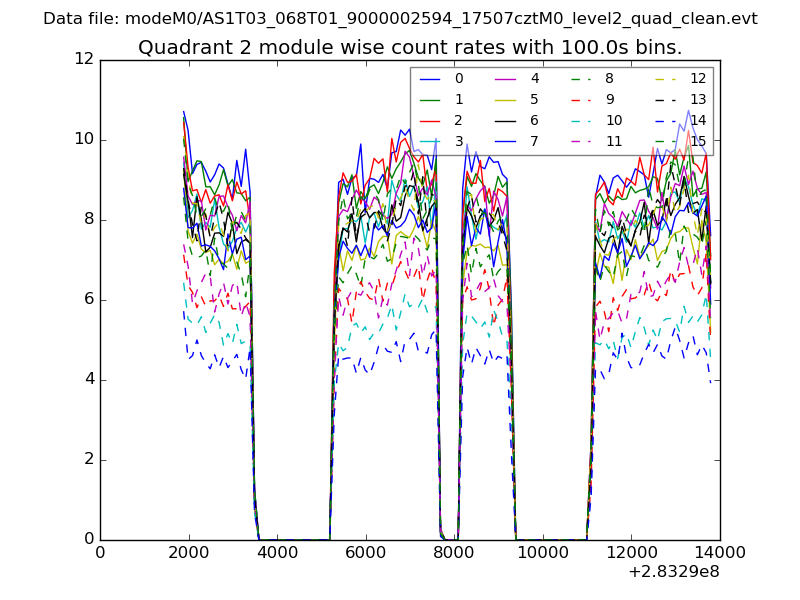
| Module-wise count rates for Quadrant B Data is divided into 100 sec bins |
 |
 |
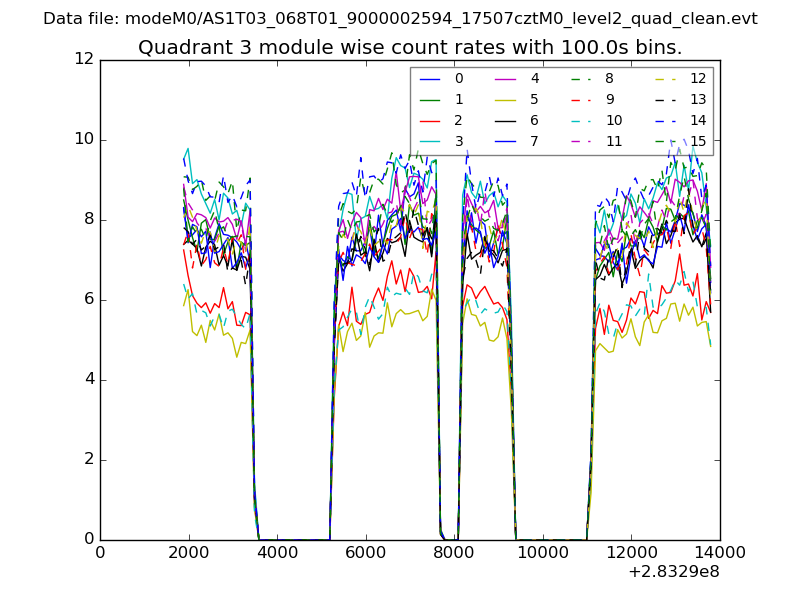
| Module-wise count rates for Quadrant C Data is divided into 100 sec bins |
 |
 |
| Module-wise count rates for Quadrant D Data is divided into 100 sec bins |
 |
 |
| Parameter | Plot |
|---|---|
| CZT HV Monitor | 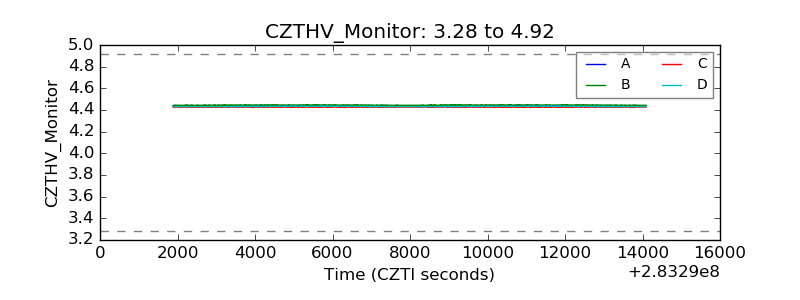 |
| D_VDD | 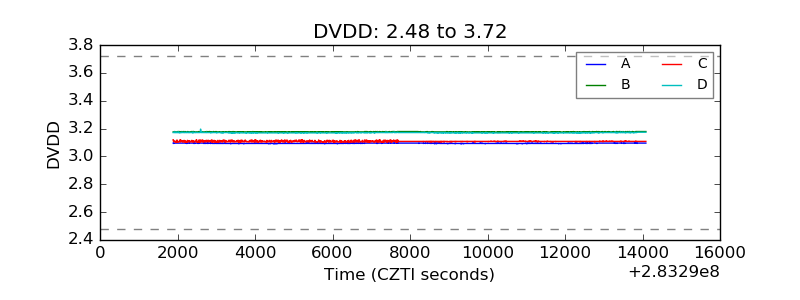 |
| Temperature 1 | 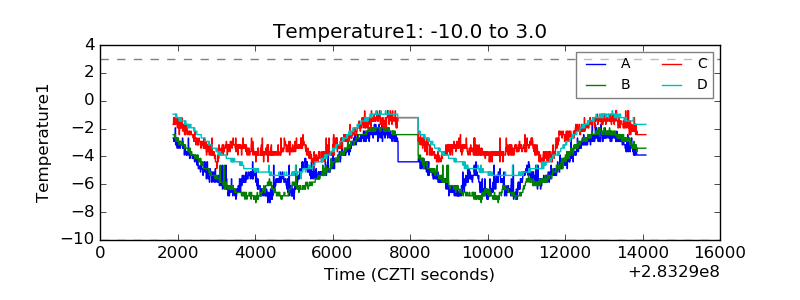 |
| Veto HV Monitor |  |
| Veto LLD | 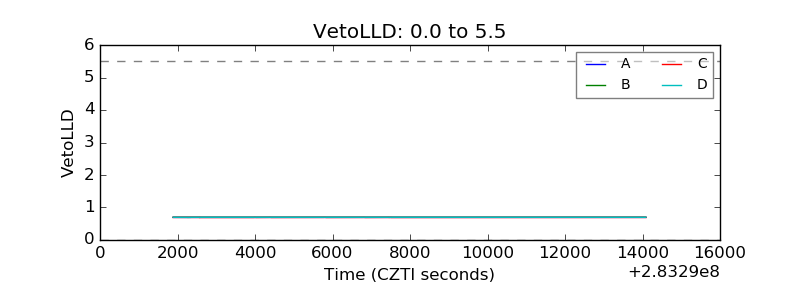 |
| Alpha Counter | 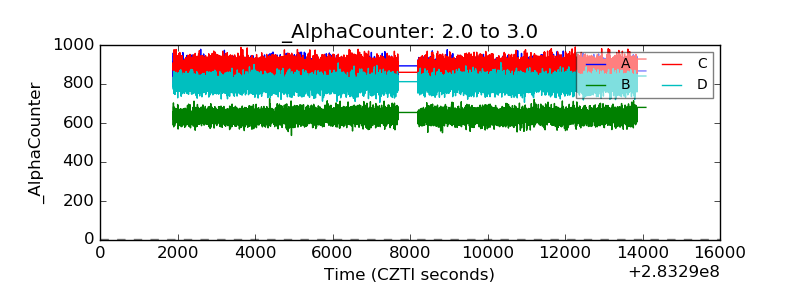 |
| _CPM_Rate | 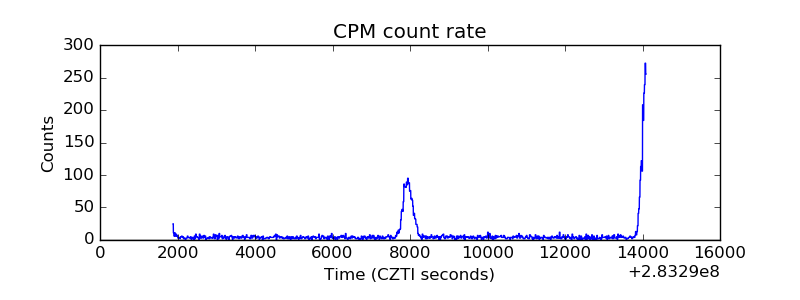 |
| CZT Counter | 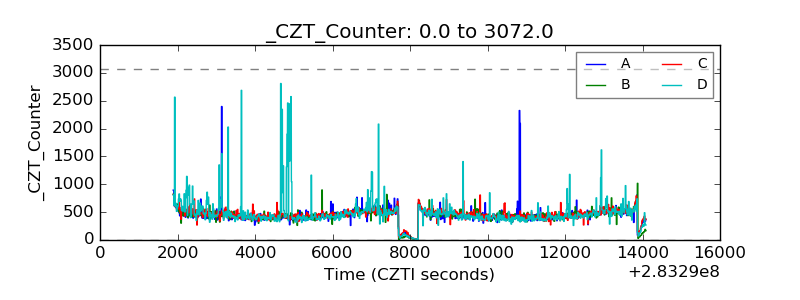 |
| +2.5 Volts monitor | 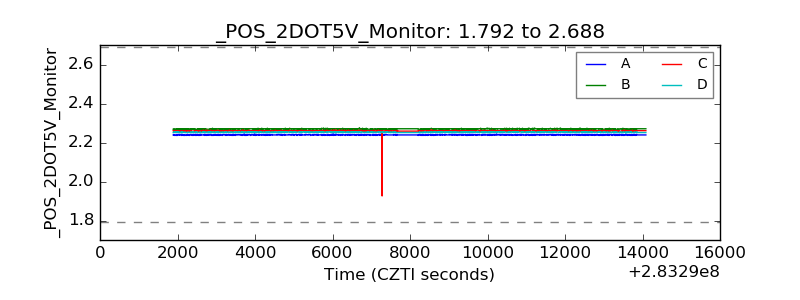 |
| +5 Volts monitor | 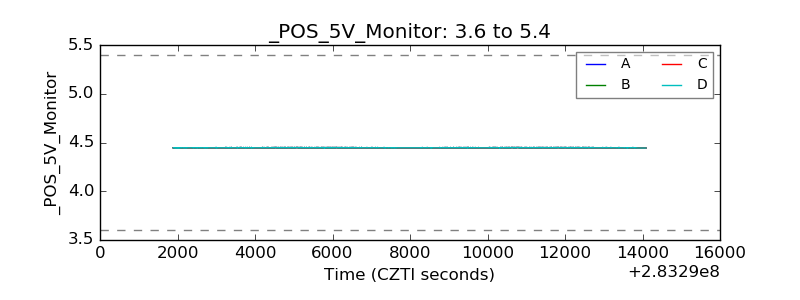 |
| _ROLL_ROT | 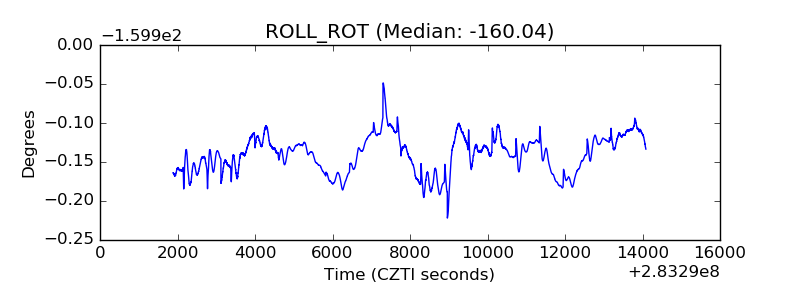 |
| _Roll_DEC | 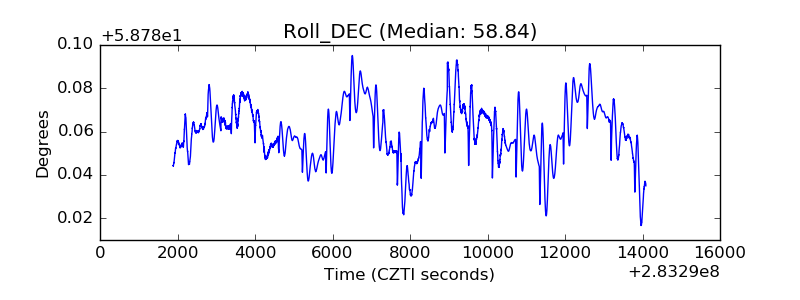 |
| _Roll_RA | 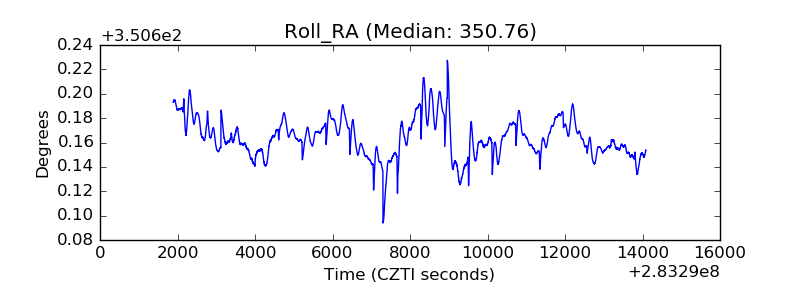 |
| Veto Counter | 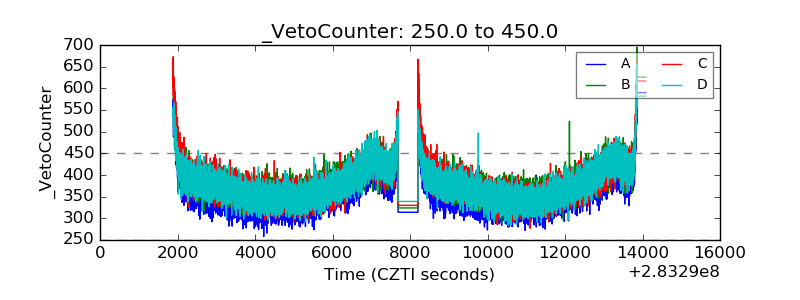 |