| Param | Original file | Final file |
|---|---|---|
| Filename | modeM0/AS1T03_040T01_9000002628_17702cztM0_level2.evt | modeM0/AS1T03_040T01_9000002628_17702cztM0_level2_quad_clean.evt |
| Size (bytes) | 1,083,205,440 | 243,086,400 |
| Size | 1.0 GB | 231.8 MB |
| Events in quadrant A | 7,245,004 | 1,593,759 |
| Events in quadrant B | 8,338,655 | 1,632,157 |
| Events in quadrant C | 7,928,448 | 1,563,727 |
| Events in quadrant D | 8,252,454 | 1,512,364 |
| Mode SS | |||
|---|---|---|---|
| Quadrant | BADHDUFLAG | Total packets | Discarded packets |
| A | 0 | 316 | 0 |
| B | 0 | 316 | 0 |
| C | 0 | 316 | 0 |
| D | 0 | 316 | 0 |
| Mode M0 | |||
|---|---|---|---|
| Quadrant | BADHDUFLAG | Total packets | Discarded packets |
| A | 0 | 31748 | 4 |
| B | 0 | 34800 | 3 |
| C | 0 | 32883 | 3 |
| D | 0 | 35561 | 3 |
| Mode M9 | |||
|---|---|---|---|
| Quadrant | BADHDUFLAG | Total packets | Discarded packets |
| A | 0 | 38 | 0 |
| B | 0 | 38 | 0 |
| C | 0 | 38 | 0 |
| D | 0 | 38 | 0 |
| Quadrant | Total seconds | Saturated seconds | Saturation percentage |
|---|---|---|---|
| A | 15373 | 46 | 0.299226% |
| B | 15373 | 215 | 1.398556% |
| C | 15373 | 152 | 0.988747% |
| D | 15373 | 441 | 2.868666% |
Noise dominated data is calculated using 1-second bins in cleaned event files. If a bin has >2000 counts, and if more than 50% of those come from <1% of pixels, then it is considered to be noise-dominated and hence unusable.
| Quadrant | # 1 sec bins | Bins with >0 counts | Bins with >2000 counts | High rate bins dominated by noise | Noise dominated (total time) | Noise dominated (detector-on time) | Marked lightcurve |
|---|---|---|---|---|---|---|---|
| A | 19258 | 15376 | 1 | 1 | 0.01% | 0.01% | 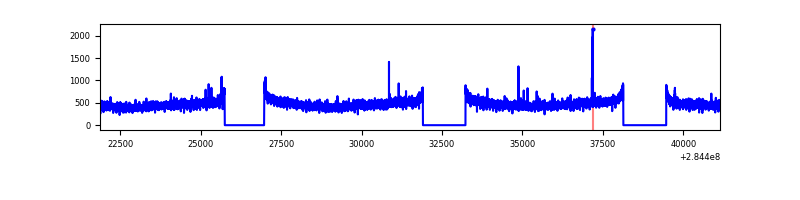 |
| B | 19258 | 15376 | 86 | 86 | 0.45% | 0.56% | 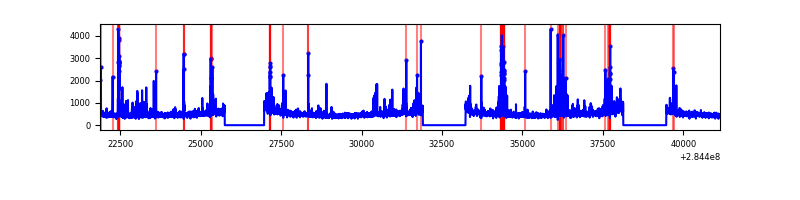 |
| C | 19258 | 15376 | 0 | 0 | 0.00% | 0.00% | 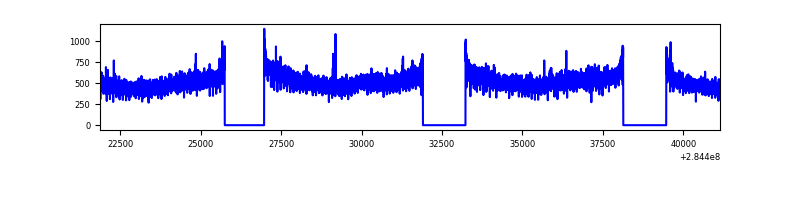 |
| D | 19258 | 15376 | 324 | 324 | 1.68% | 2.11% | 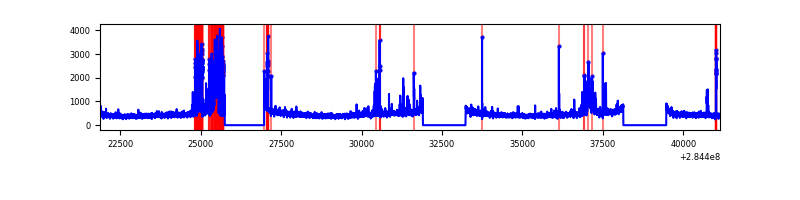 |
Top three noisy pixels from each quadrant. If the there are fewer than three noisy pixels in the level2.evt file, extra rows are filled as -1
| Pixel properties | Quadrant properties | ||||||
|---|---|---|---|---|---|---|---|
| Quadrant | DetID | PixID | Counts | Sigma | Mean | Median | Sigma |
| A | 15 | 174 | 21992 | 53.77 | 1879 | 1845 | 374.7 |
| A | 0 | 226 | 16493 | 39.09 | 1879 | 1845 | 374.7 |
| A | 12 | 194 | 13613 | 31.41 | 1879 | 1845 | 374.7 |
| B | 10 | 245 | 741135 | 2126.55 | 1883 | 1839 | 347.7 |
| B | 0 | 189 | 103878 | 293.51 | 1883 | 1839 | 347.7 |
| B | 12 | 111 | 40696 | 111.77 | 1883 | 1839 | 347.7 |
| C | 3 | 233 | 482146 | 1165.39 | 1802 | 1817 | 412.2 |
| C | 14 | 238 | 285910 | 689.27 | 1802 | 1817 | 412.2 |
| C | 5 | 218 | 87535 | 207.97 | 1802 | 1817 | 412.2 |
| D | 7 | 238 | 1183768 | 2779.8 | 1782 | 1734 | 425.2 |
| D | 1 | 52 | 141917 | 329.67 | 1782 | 1734 | 425.2 |
| D | 2 | 234 | 57531 | 131.22 | 1782 | 1734 | 425.2 |
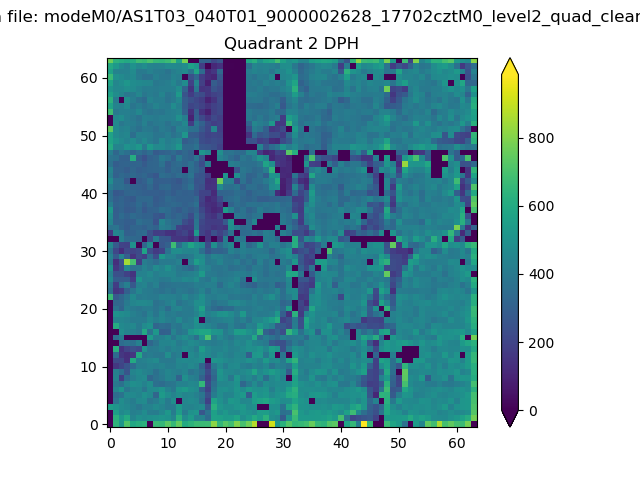
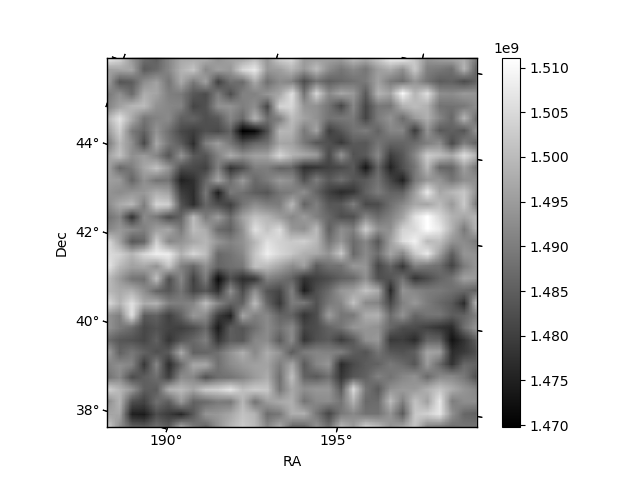
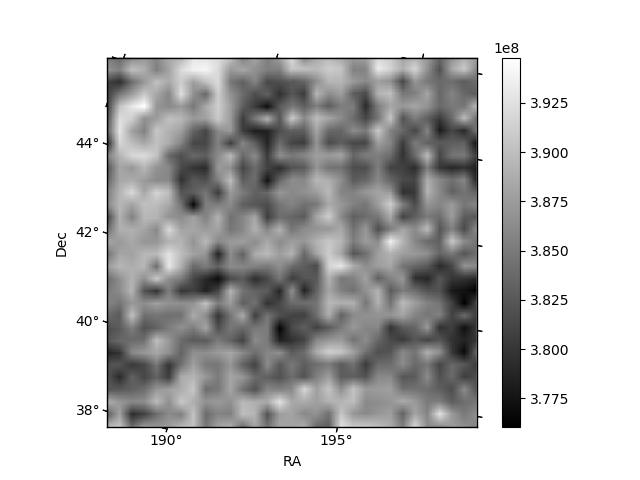
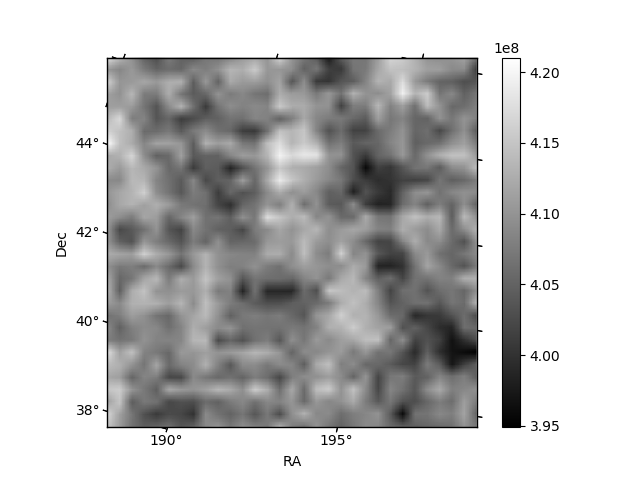
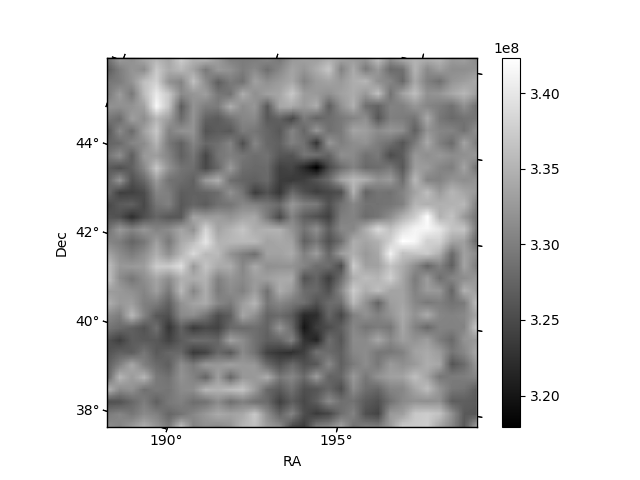
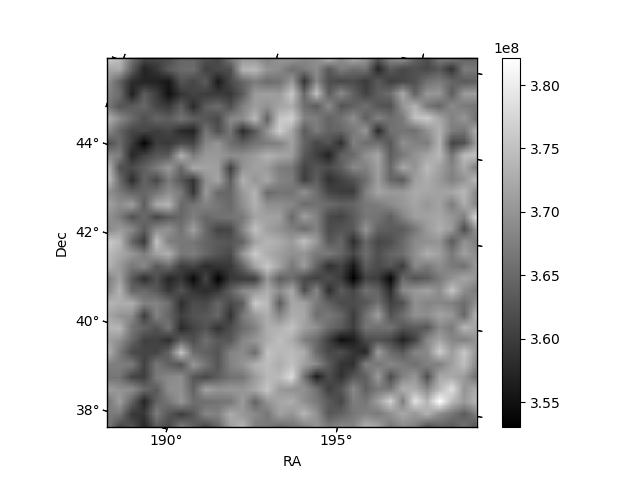
Histogram calculated using DETX and DETY for each event in the final _common_clean file
| Quadrant A | 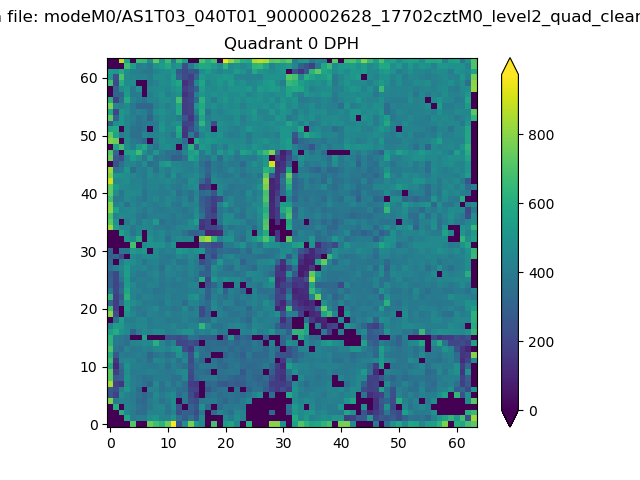 |
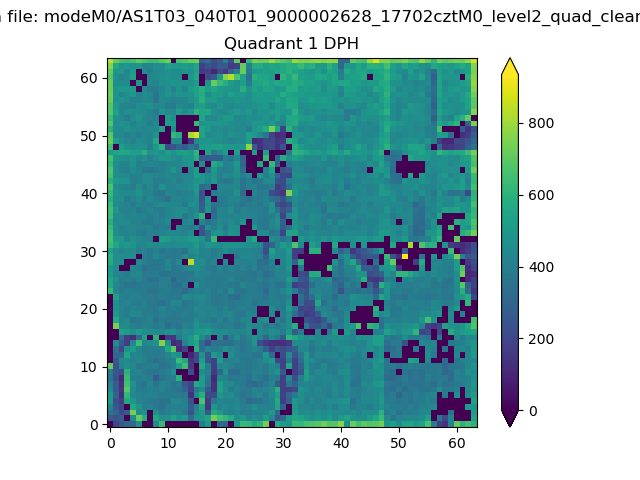 |
Quadrant B |
|---|---|---|---|
| Quadrant D | 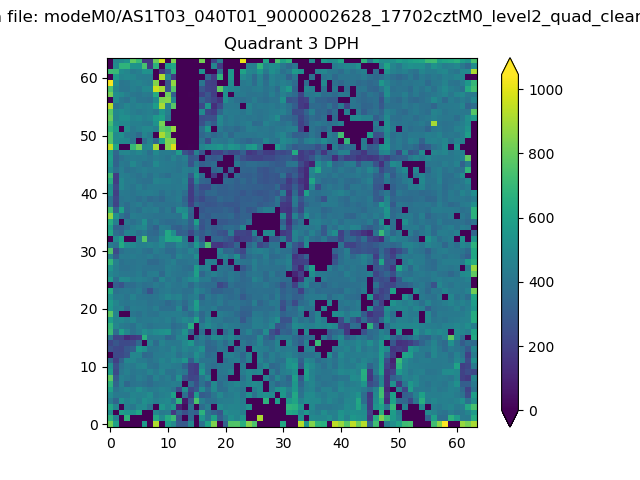 |
 |
Quadrant C |
| Plot type | Count rate plots | Images |
|---|---|---|
| Comparison with Poisson distribution Blue bars denote a histogram of data divided into 1 sec bins. Red curve is a Poisson curve with rate = median count rate of data. |
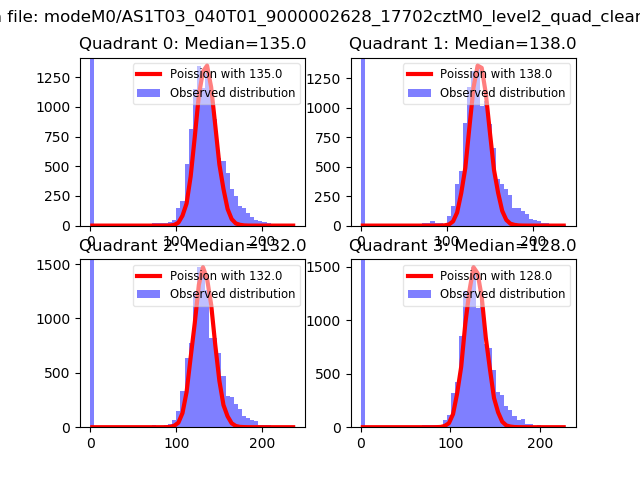 |
 |
| Quadrant-wise count rates Data is divided into 100 sec bins |
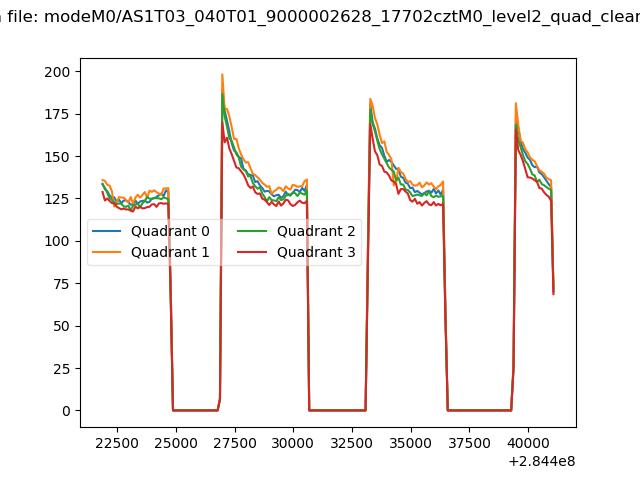 |
|
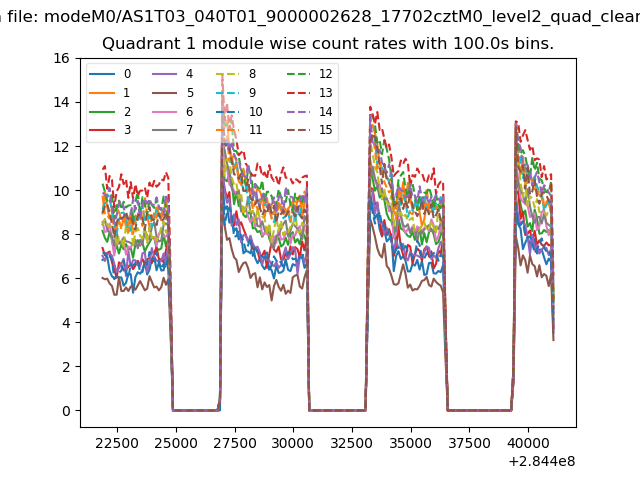
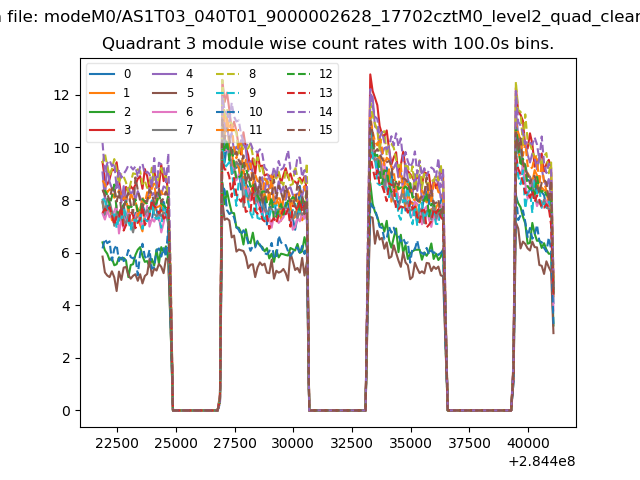
| Module-wise count rates for Quadrant A Data is divided into 100 sec bins |
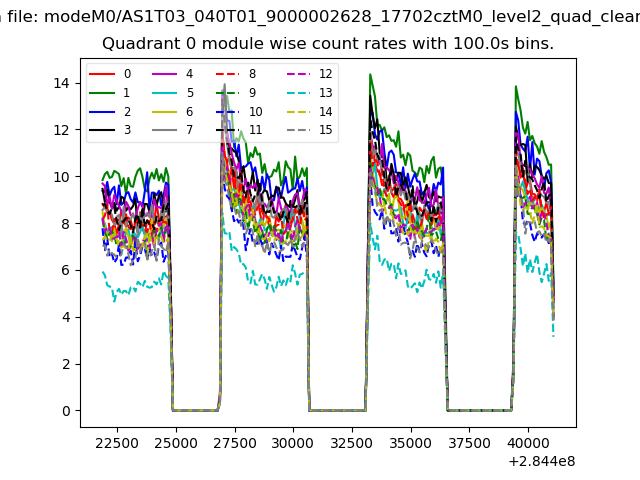 |
 |
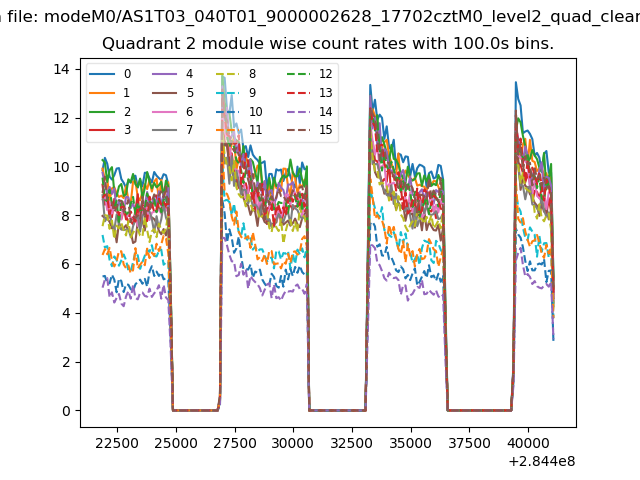
| Module-wise count rates for Quadrant B Data is divided into 100 sec bins |
 |
 |
| Module-wise count rates for Quadrant C Data is divided into 100 sec bins |
 |
 |
| Module-wise count rates for Quadrant D Data is divided into 100 sec bins |
 |
 |
| Parameter | Plot |
|---|---|
| CZT HV Monitor | 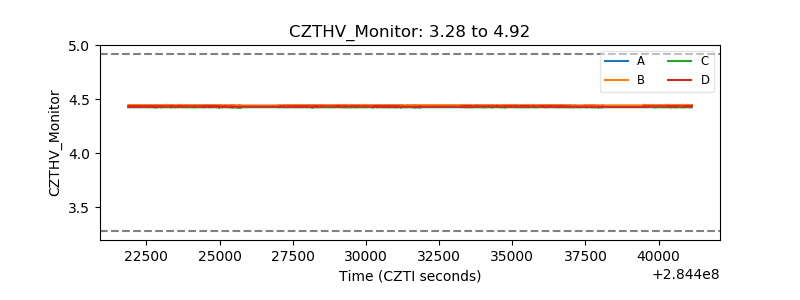 |
| D_VDD | 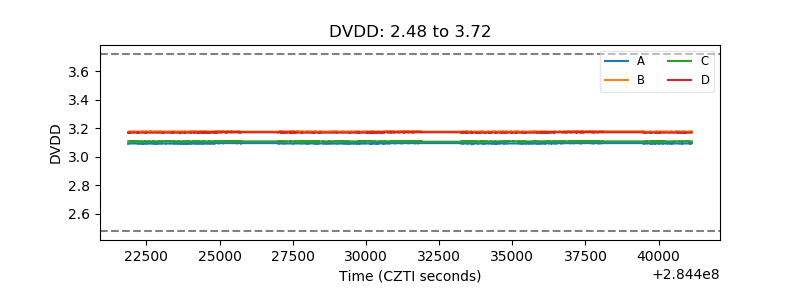 |
| Temperature 1 | 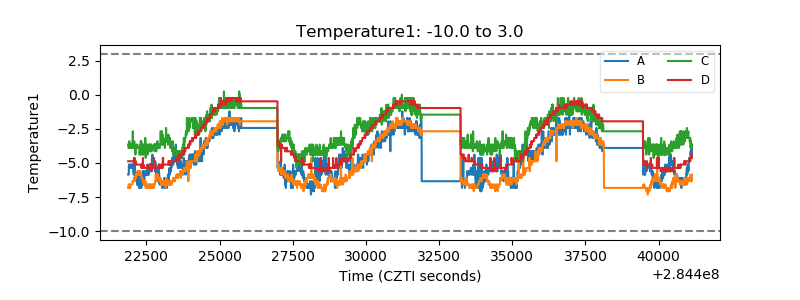 |
| Veto HV Monitor | 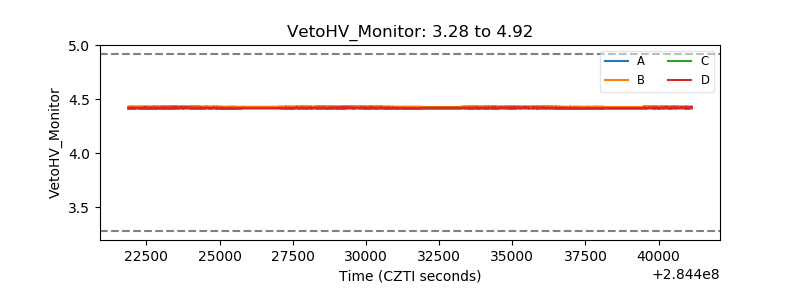 |
| Veto LLD | 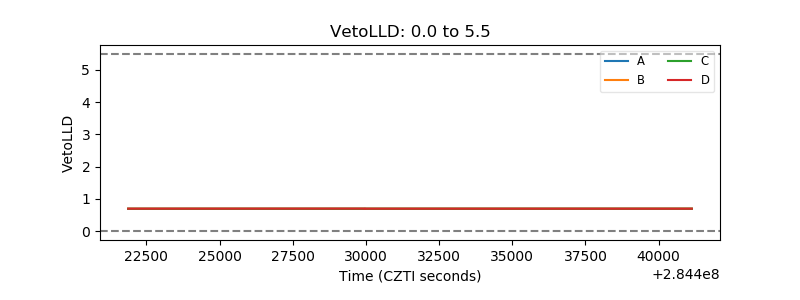 |
| Alpha Counter | 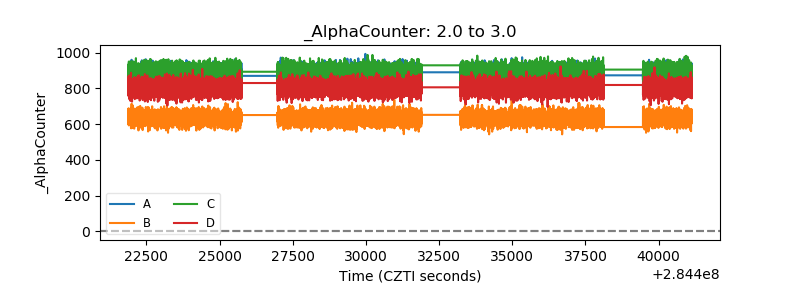 |
| _CPM_Rate | 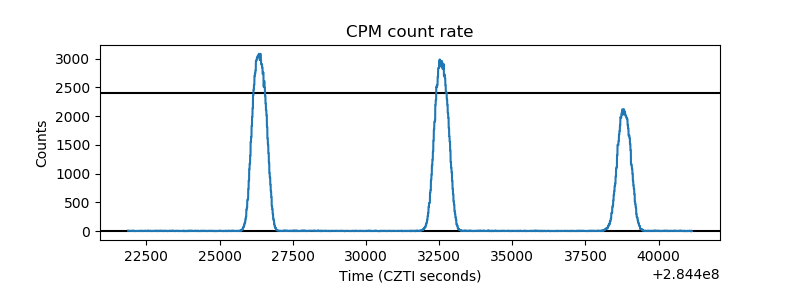 |
| CZT Counter | 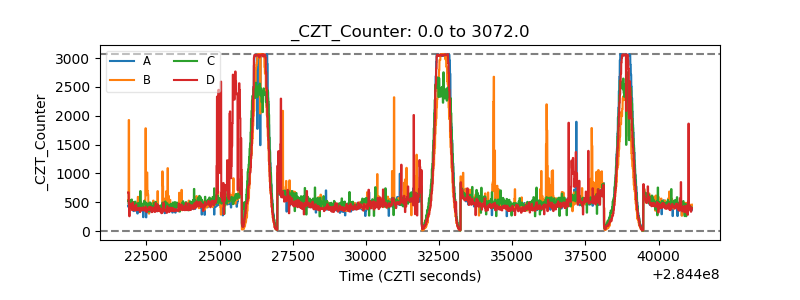 |
| +2.5 Volts monitor | 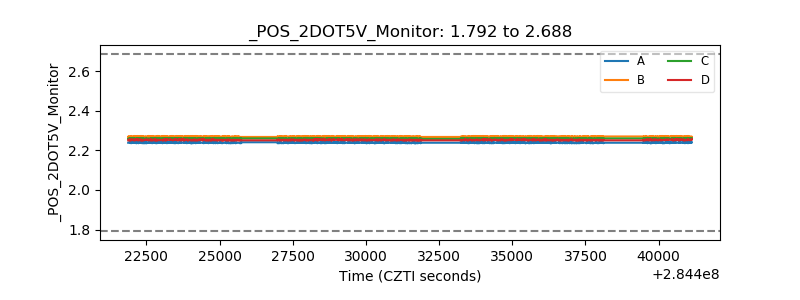 |
| +5 Volts monitor | 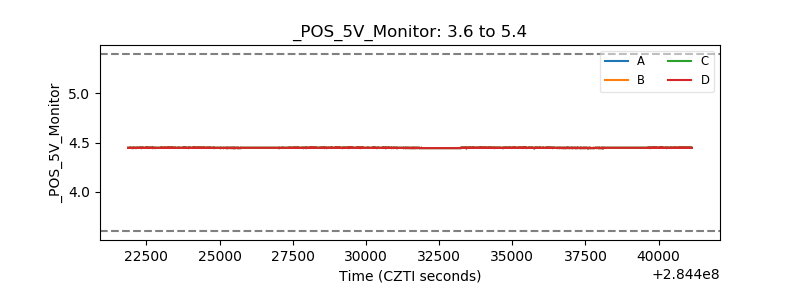 |
| _ROLL_ROT | 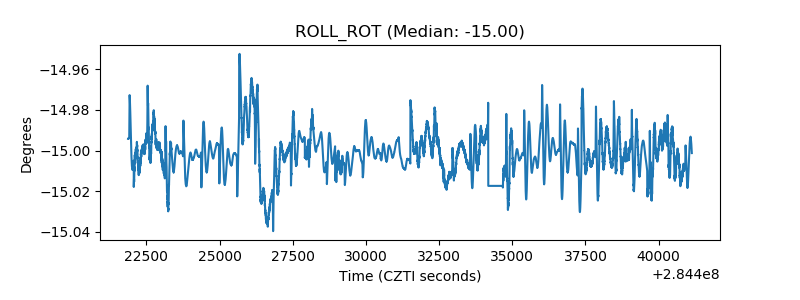 |
| _Roll_DEC | 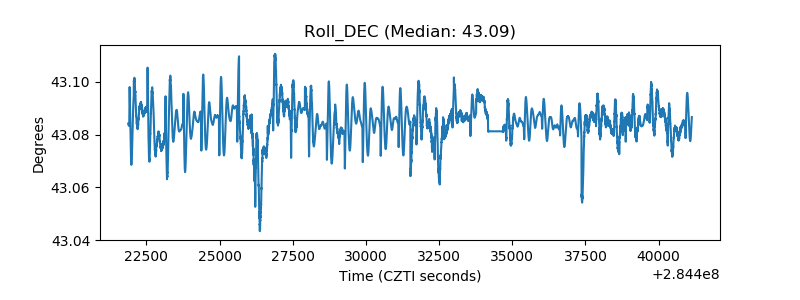 |
| _Roll_RA | 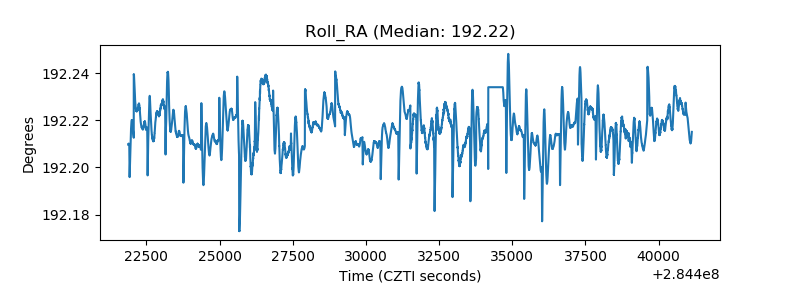 |
| Veto Counter | 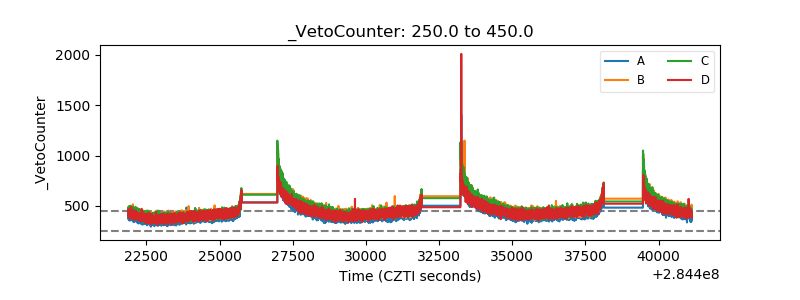 |