| Param | Original file | Final file |
|---|---|---|
| Filename | modeM0/AS1T03_070T05_9000002640_17748cztM0_level2.evt | modeM0/AS1T03_070T05_9000002640_17748cztM0_level2_quad_clean.evt |
| Size (bytes) | 453,752,640 | 71,421,120 |
| Size | 432.7 MB | 68.1 MB |
| Events in quadrant A | 3,180,998 | 433,790 |
| Events in quadrant B | 3,426,644 | 431,031 |
| Events in quadrant C | 3,242,845 | 419,790 |
| Events in quadrant D | 3,431,812 | 406,524 |
| Mode M9 | |||
|---|---|---|---|
| Quadrant | BADHDUFLAG | Total packets | Discarded packets |
| A | 0 | 19 | 0 |
| B | 0 | 20 | 0 |
| C | 0 | 20 | 0 |
| D | 0 | 20 | 0 |
| Mode SS | |||
|---|---|---|---|
| Quadrant | BADHDUFLAG | Total packets | Discarded packets |
| A | 0 | 136 | 0 |
| B | 0 | 136 | 0 |
| C | 0 | 136 | 0 |
| D | 0 | 136 | 0 |
| Mode M0 | |||
|---|---|---|---|
| Quadrant | BADHDUFLAG | Total packets | Discarded packets |
| A | 0 | 13868 | 1 |
| B | 0 | 14512 | 1 |
| C | 0 | 13887 | 1 |
| D | 0 | 15020 | 2 |
| Quadrant | Total seconds | Saturated seconds | Saturation percentage |
|---|---|---|---|
| A | 6765 | 54 | 0.798226% |
| B | 6765 | 124 | 1.832964% |
| C | 6765 | 76 | 1.123429% |
| D | 6764 | 171 | 2.528090% |
Noise dominated data is calculated using 1-second bins in cleaned event files. If a bin has >2000 counts, and if more than 50% of those come from <1% of pixels, then it is considered to be noise-dominated and hence unusable.
| Quadrant | # 1 sec bins | Bins with >0 counts | Bins with >2000 counts | High rate bins dominated by noise | Noise dominated (total time) | Noise dominated (detector-on time) | Marked lightcurve |
|---|---|---|---|---|---|---|---|
| A | 7665 | 6766 | 0 | 0 | 0.00% | 0.00% | 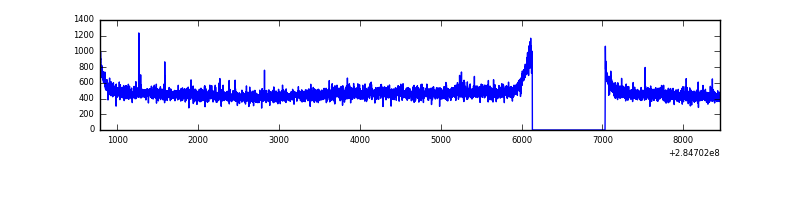 |
| B | 7665 | 6766 | 65 | 65 | 0.85% | 0.96% | 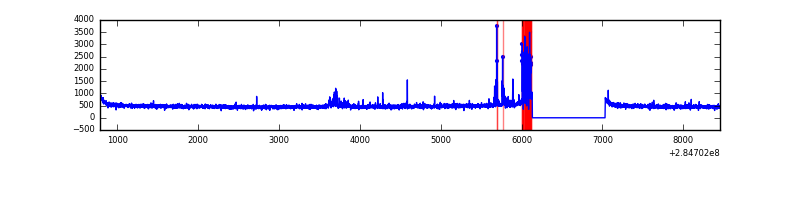 |
| C | 7665 | 6766 | 0 | 0 | 0.00% | 0.00% | 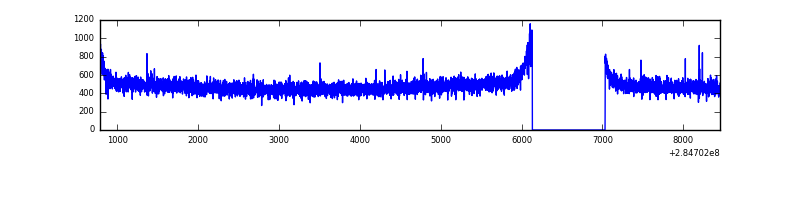 |
| D | 7664 | 6765 | 109 | 109 | 1.42% | 1.61% | 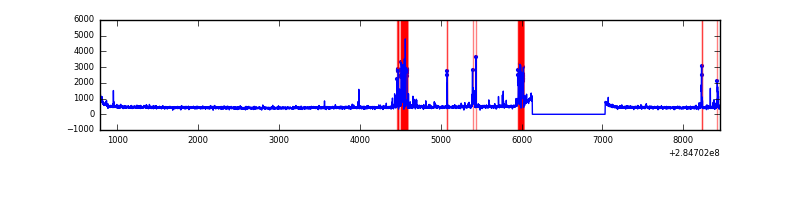 |
Top three noisy pixels from each quadrant. If the there are fewer than three noisy pixels in the level2.evt file, extra rows are filled as -1
| Pixel properties | Quadrant properties | ||||||
|---|---|---|---|---|---|---|---|
| Quadrant | DetID | PixID | Counts | Sigma | Mean | Median | Sigma |
| A | 15 | 191 | 27322 | 161.06 | 817 | 799 | 164.7 |
| A | 15 | 174 | 11724 | 66.34 | 817 | 799 | 164.7 |
| A | 0 | 226 | 7118 | 38.37 | 817 | 799 | 164.7 |
| B | 10 | 245 | 202557 | 1308.58 | 811 | 793 | 154.2 |
| B | 0 | 230 | 26861 | 169.07 | 811 | 793 | 154.2 |
| B | 12 | 111 | 18386 | 114.1 | 811 | 793 | 154.2 |
| C | 14 | 238 | 122410 | 658.12 | 788 | 796 | 184.8 |
| C | 5 | 218 | 24340 | 127.41 | 788 | 796 | 184.8 |
| C | 1 | 16 | 11625 | 58.6 | 788 | 796 | 184.8 |
| D | 10 | 70 | 177306 | 871.52 | 779 | 762 | 202.6 |
| D | 7 | 38 | 168611 | 828.59 | 779 | 762 | 202.6 |
| D | 5 | 222 | 37354 | 180.64 | 779 | 762 | 202.6 |
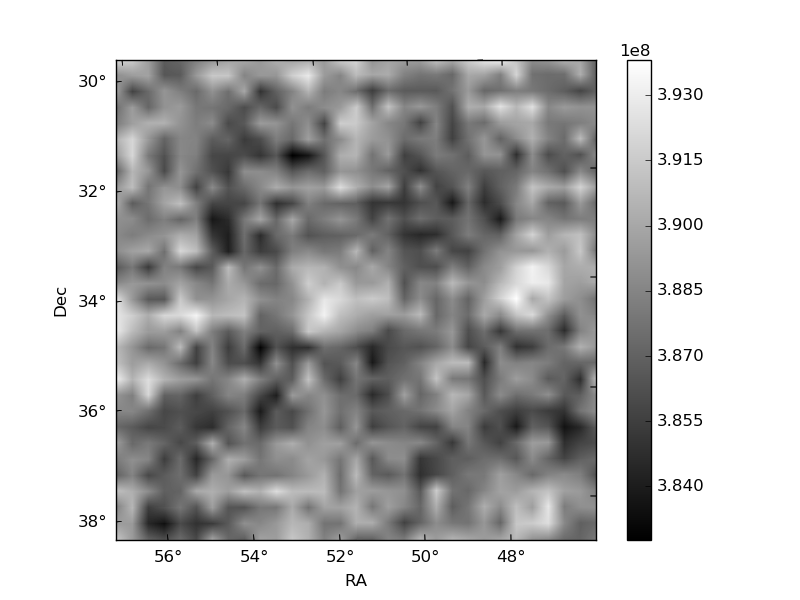
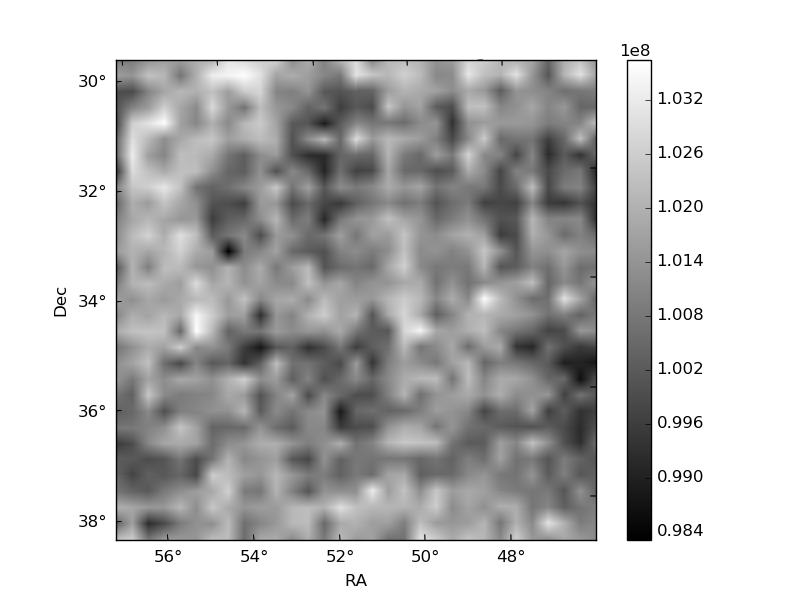
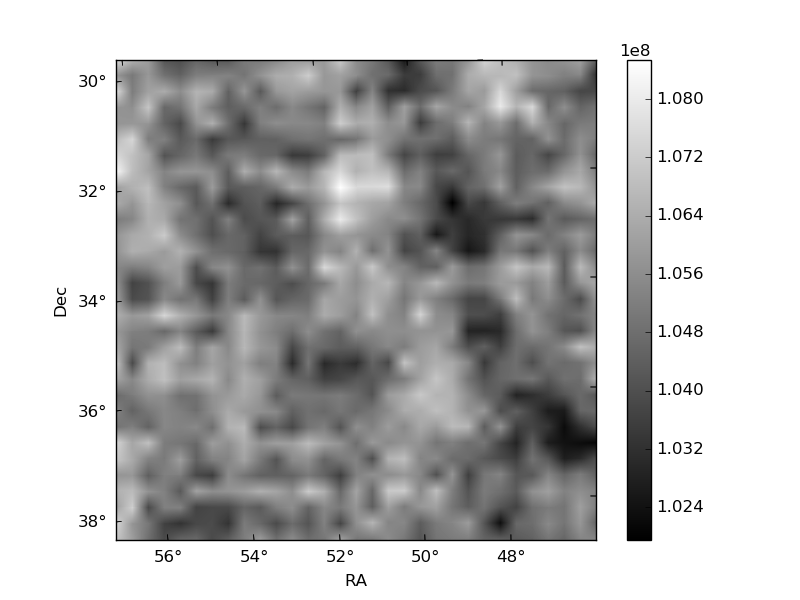
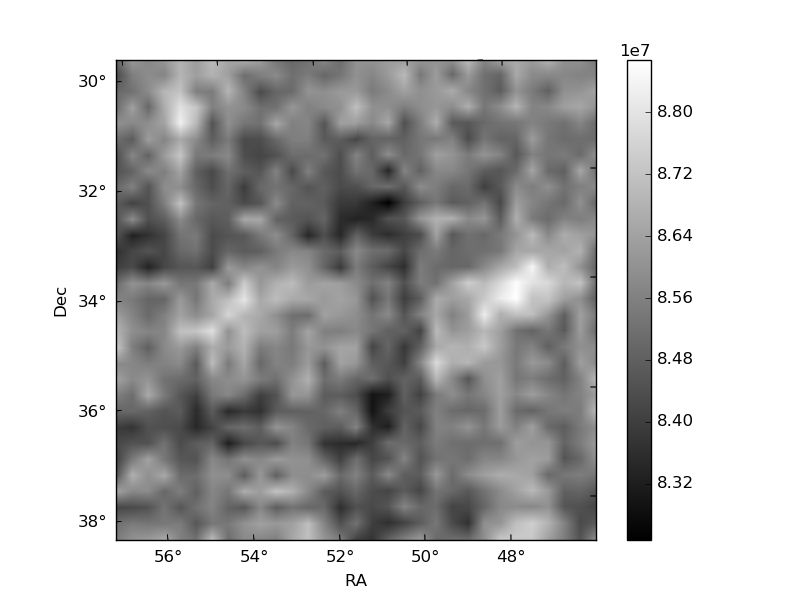
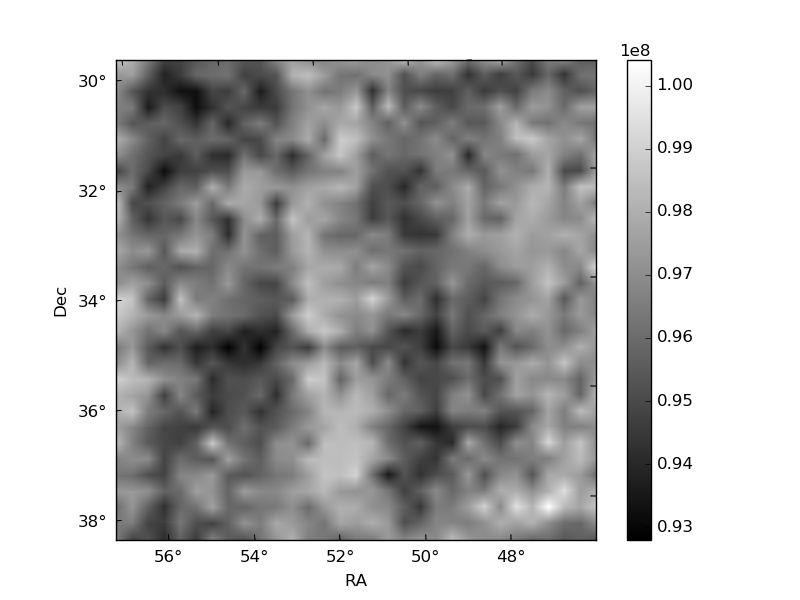
Histogram calculated using DETX and DETY for each event in the final _common_clean file
| Quadrant A | 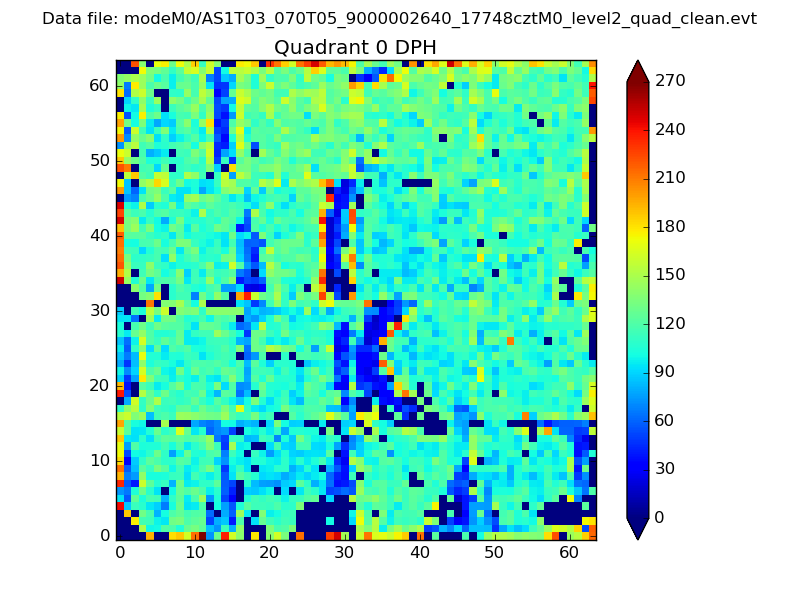 |
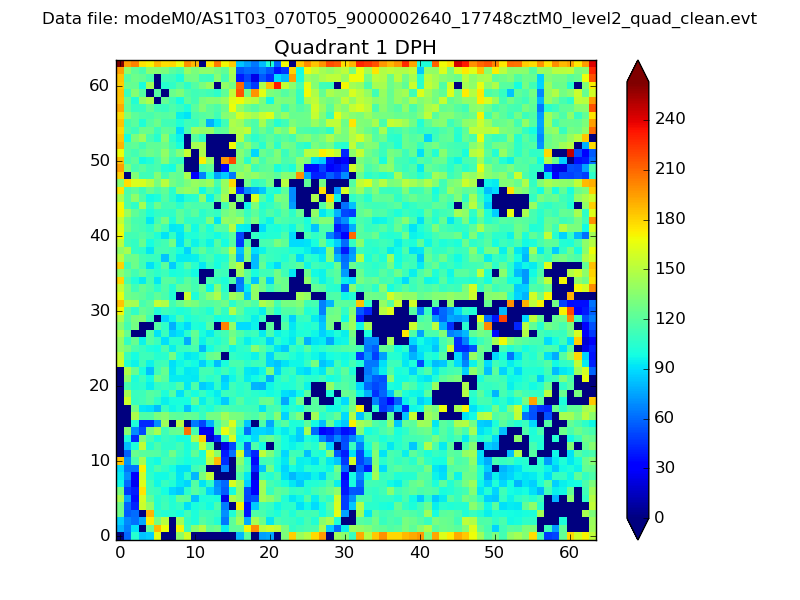 |
Quadrant B |
|---|---|---|---|
| Quadrant D | 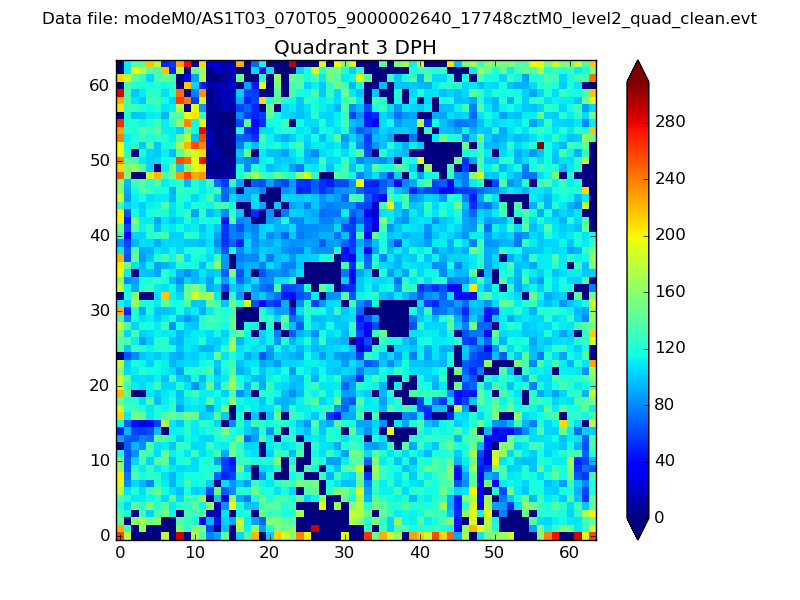 |
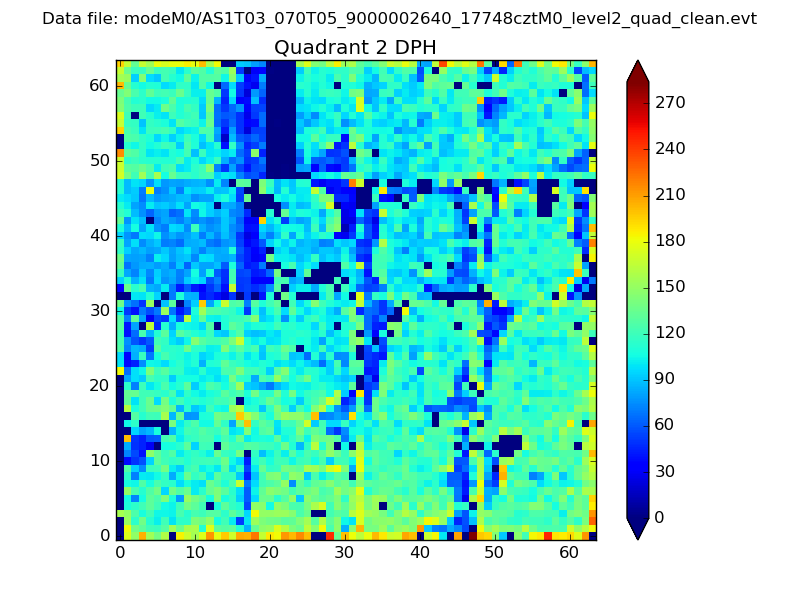 |
Quadrant C |
| Plot type | Count rate plots | Images |
|---|---|---|
| Comparison with Poisson distribution Blue bars denote a histogram of data divided into 1 sec bins. Red curve is a Poisson curve with rate = median count rate of data. |
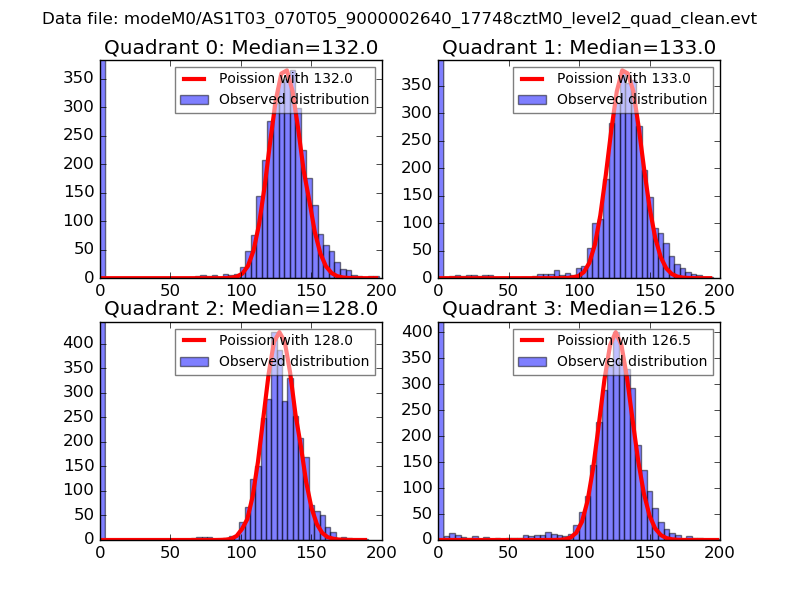 |
 |
| Quadrant-wise count rates Data is divided into 100 sec bins |
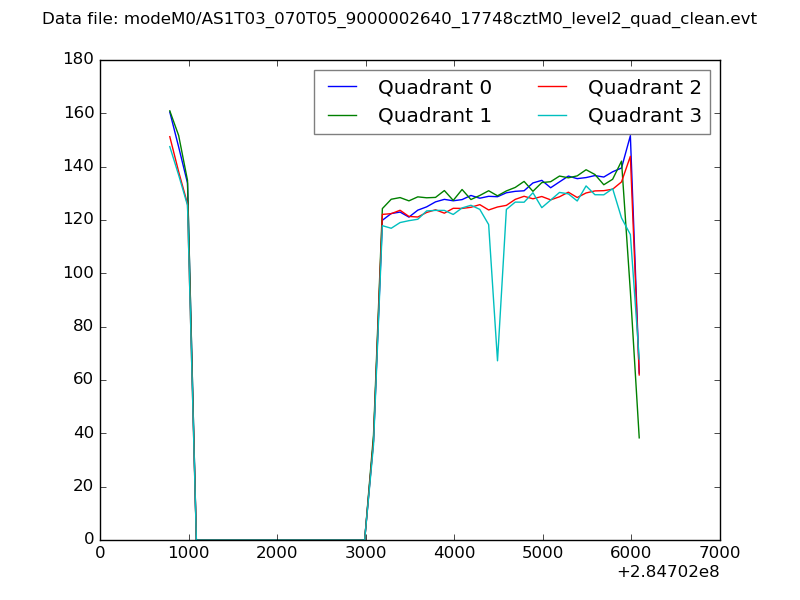 |
|
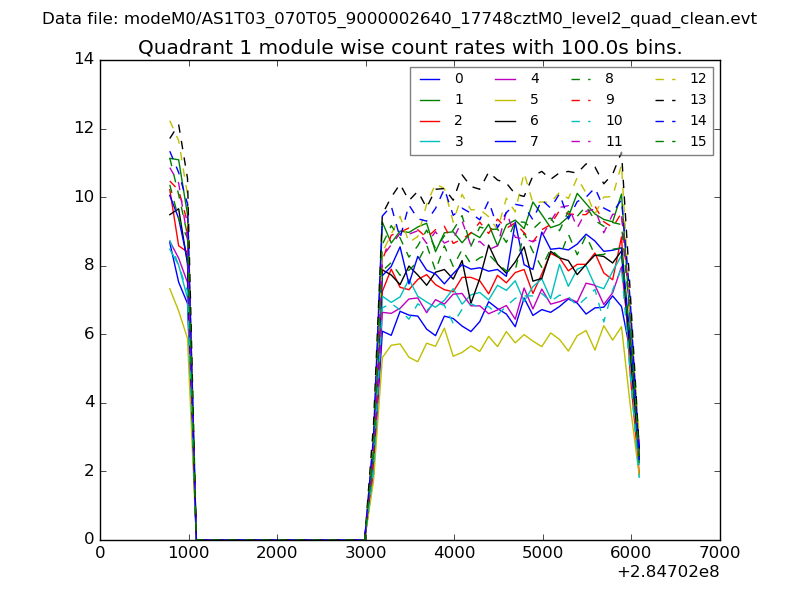
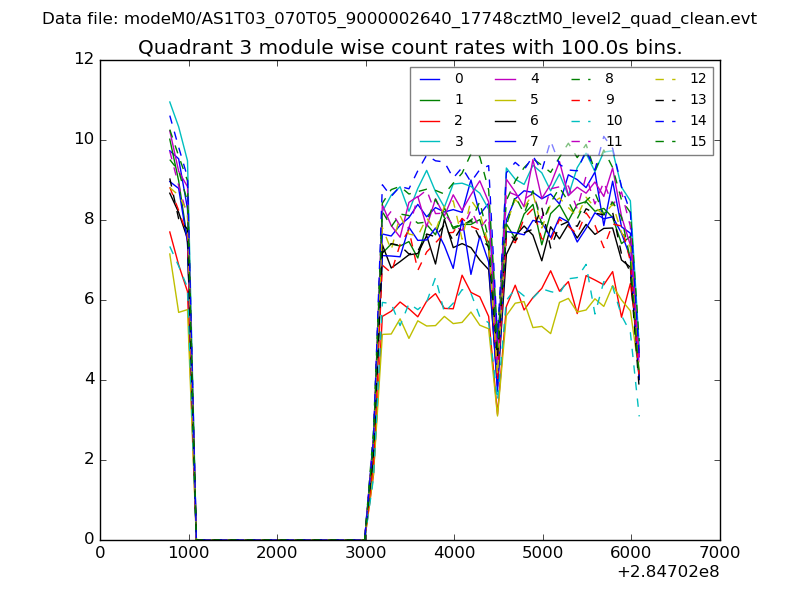
| Module-wise count rates for Quadrant A Data is divided into 100 sec bins |
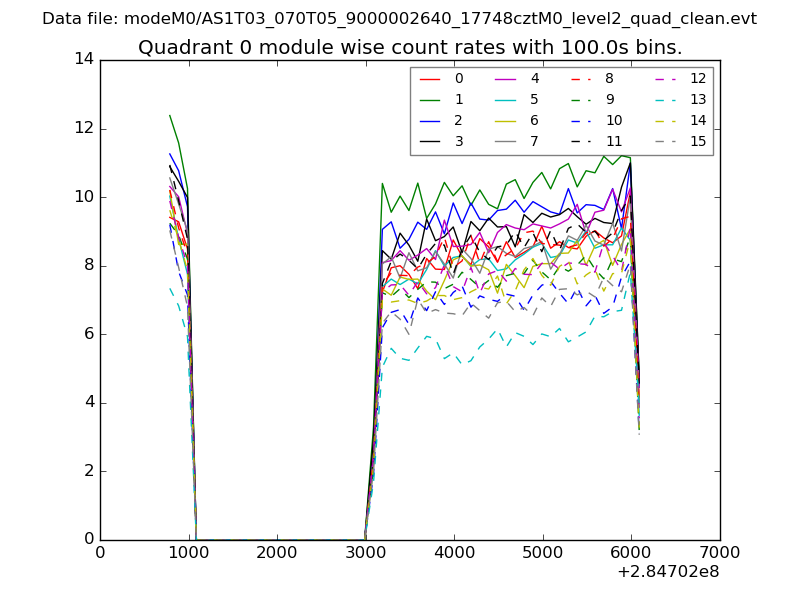 |
 |
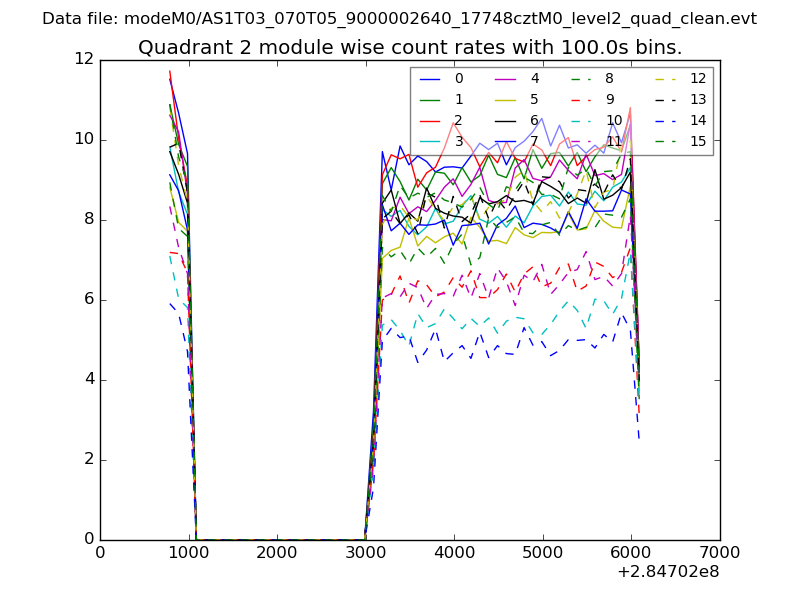
| Module-wise count rates for Quadrant B Data is divided into 100 sec bins |
 |
 |
| Module-wise count rates for Quadrant C Data is divided into 100 sec bins |
 |
 |
| Module-wise count rates for Quadrant D Data is divided into 100 sec bins |
 |
 |
| Parameter | Plot |
|---|---|
| CZT HV Monitor | 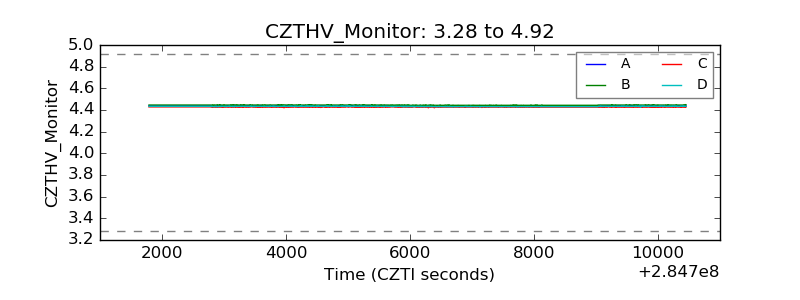 |
| D_VDD | 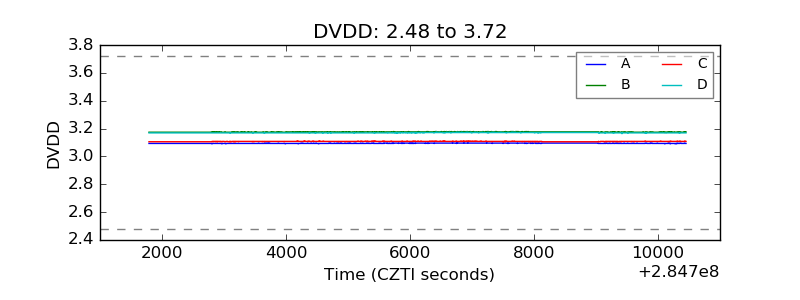 |
| Temperature 1 | 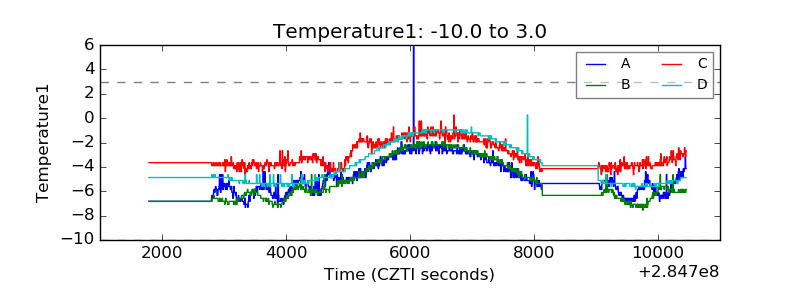 |
| Veto HV Monitor | 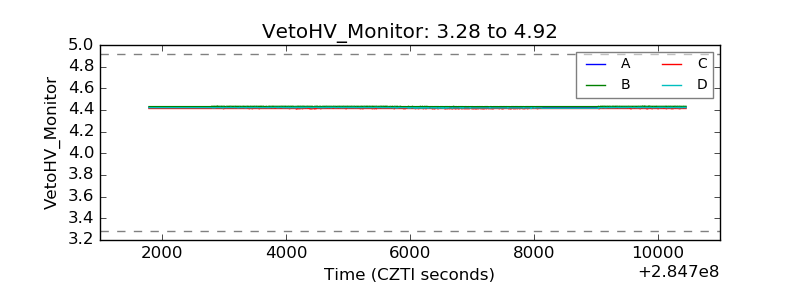 |
| Veto LLD | 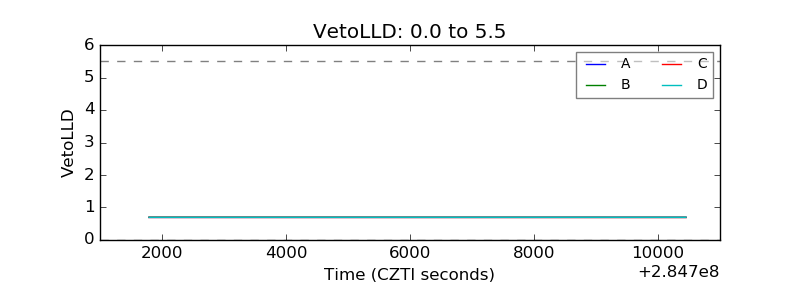 |
| Alpha Counter | 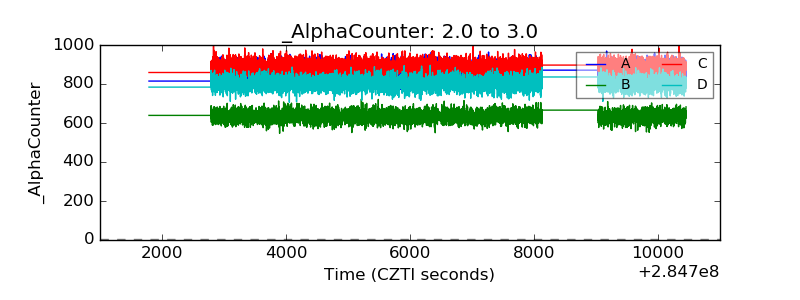 |
| _CPM_Rate | 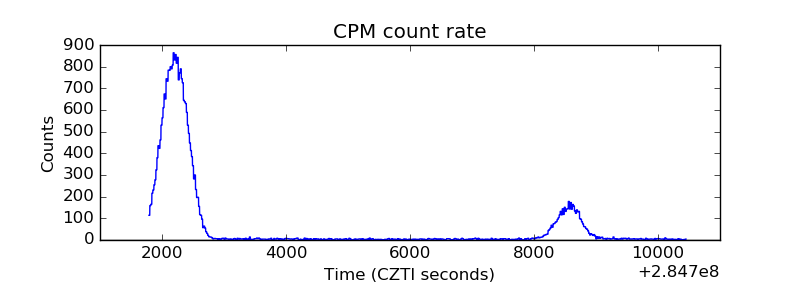 |
| CZT Counter | 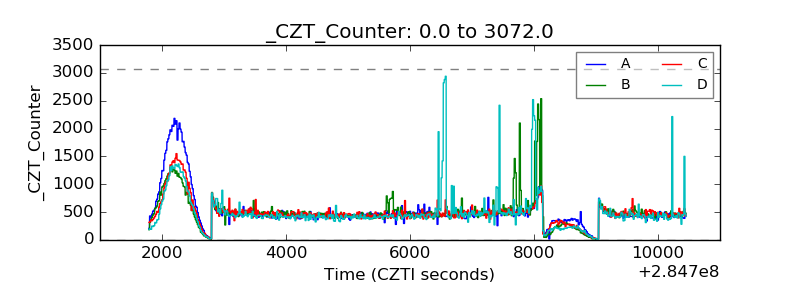 |
| +2.5 Volts monitor | 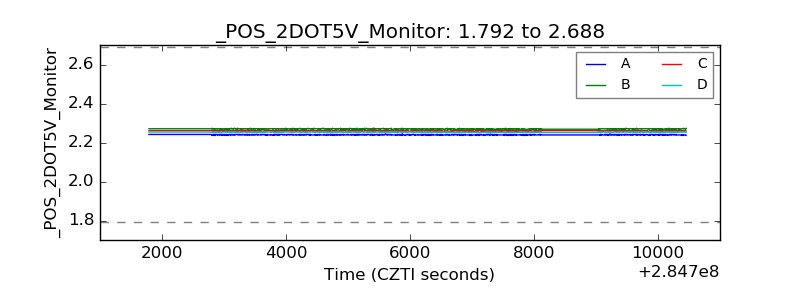 |
| +5 Volts monitor | 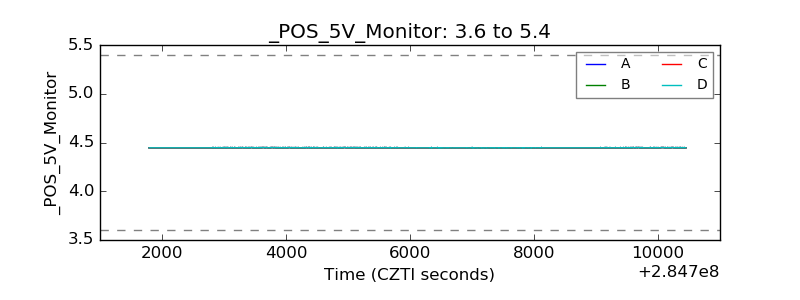 |
| _ROLL_ROT | 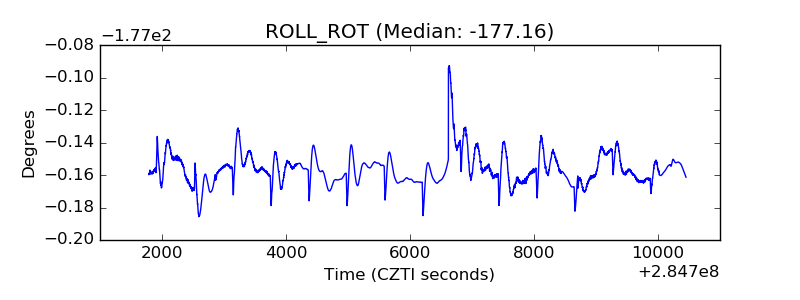 |
| _Roll_DEC | 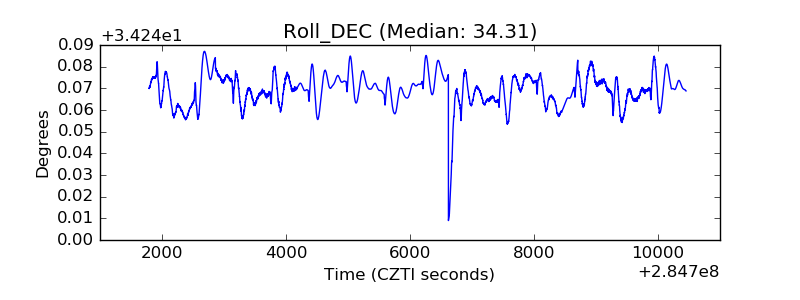 |
| _Roll_RA | 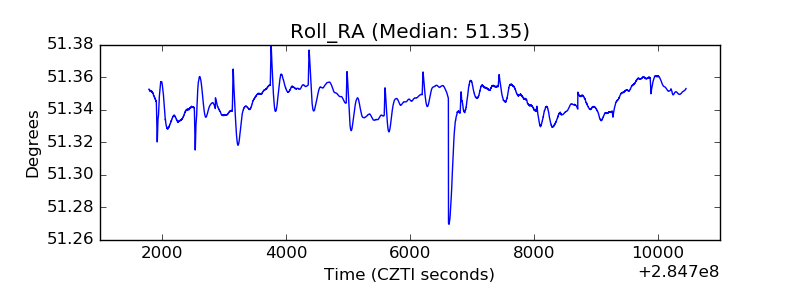 |
| Veto Counter | 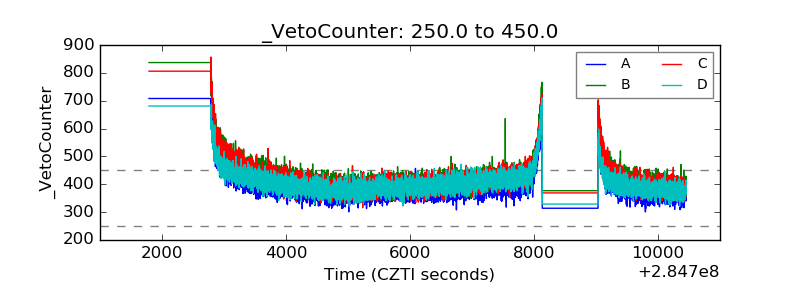 |