| Param | Original file | Final file |
|---|---|---|
| Filename | modeM0/AS1T03_003T01_9000002712_18217cztM0_level2.evt | modeM0/AS1T03_003T01_9000002712_18217cztM0_level2_quad_clean.evt |
| Size (bytes) | 940,158,720 | 165,516,480 |
| Size | 896.6 MB | 157.8 MB |
| Events in quadrant A | 6,722,100 | 1,028,369 |
| Events in quadrant B | 6,076,673 | 1,063,796 |
| Events in quadrant C | 6,012,760 | 1,034,568 |
| Events in quadrant D | 8,795,501 | 1,001,695 |
| Mode M9 | |||
|---|---|---|---|
| Quadrant | BADHDUFLAG | Total packets | Discarded packets |
| A | 0 | 11 | 0 |
| B | 0 | 11 | 0 |
| C | 0 | 11 | 0 |
| D | 0 | 11 | 0 |
| Mode M0 | |||
|---|---|---|---|
| Quadrant | BADHDUFLAG | Total packets | Discarded packets |
| A | 0 | 28696 | 2 |
| B | 0 | 26545 | 2 |
| C | 0 | 26146 | 2 |
| D | 0 | 34734 | 2 |
| Mode SS | |||
|---|---|---|---|
| Quadrant | BADHDUFLAG | Total packets | Discarded packets |
| A | 0 | 260 | 0 |
| B | 0 | 260 | 0 |
| C | 0 | 260 | 0 |
| D | 0 | 260 | 0 |
| Quadrant | Total seconds | Saturated seconds | Saturation percentage |
|---|---|---|---|
| A | 12796 | 389 | 3.040013% |
| B | 12796 | 99 | 0.773679% |
| C | 12797 | 139 | 1.086192% |
| D | 12797 | 520 | 4.063452% |
Noise dominated data is calculated using 1-second bins in cleaned event files. If a bin has >2000 counts, and if more than 50% of those come from <1% of pixels, then it is considered to be noise-dominated and hence unusable.
| Quadrant | # 1 sec bins | Bins with >0 counts | Bins with >2000 counts | High rate bins dominated by noise | Noise dominated (total time) | Noise dominated (detector-on time) | Marked lightcurve |
|---|---|---|---|---|---|---|---|
| A | 13876 | 12798 | 250 | 250 | 1.80% | 1.95% | 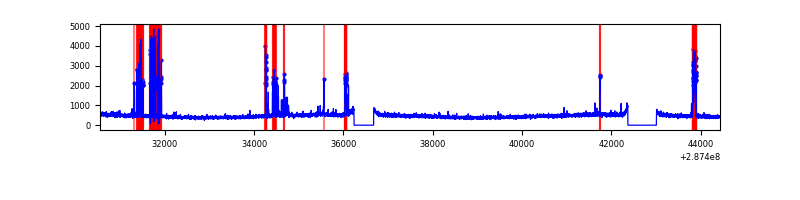 |
| B | 13876 | 12798 | 4 | 4 | 0.03% | 0.03% | 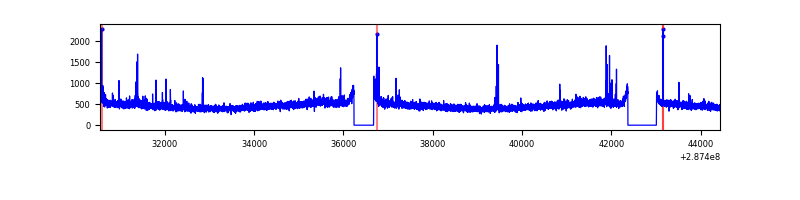 |
| C | 13877 | 12799 | 2 | 2 | 0.01% | 0.02% | 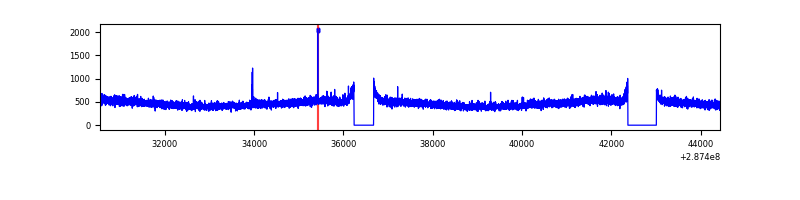 |
| D | 13877 | 12799 | 330 | 330 | 2.38% | 2.58% | 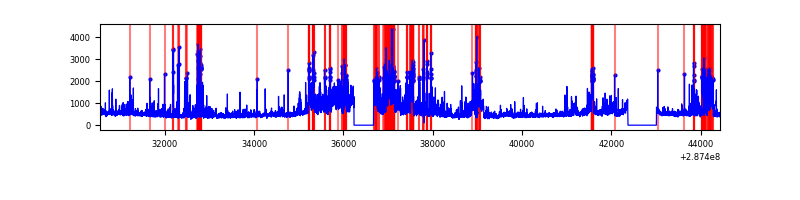 |
Top three noisy pixels from each quadrant. If the there are fewer than three noisy pixels in the level2.evt file, extra rows are filled as -1
| Pixel properties | Quadrant properties | ||||||
|---|---|---|---|---|---|---|---|
| Quadrant | DetID | PixID | Counts | Sigma | Mean | Median | Sigma |
| A | 15 | 174 | 947175 | 3088.5 | 1501 | 1468 | 306.2 |
| A | 0 | 226 | 12834 | 37.12 | 1501 | 1468 | 306.2 |
| A | 3 | 137 | 11545 | 32.91 | 1501 | 1468 | 306.2 |
| B | 7 | 220 | 41590 | 137.3 | 1520 | 1478 | 292.2 |
| B | 12 | 111 | 35008 | 114.77 | 1520 | 1478 | 292.2 |
| B | 11 | 111 | 29810 | 96.98 | 1520 | 1478 | 292.2 |
| C | 14 | 238 | 223534 | 646.31 | 1459 | 1469 | 343.6 |
| C | 3 | 233 | 82360 | 235.43 | 1459 | 1469 | 343.6 |
| C | 0 | 207 | 22552 | 61.36 | 1459 | 1469 | 343.6 |
| D | 5 | 222 | 1644472 | 4593.53 | 1464 | 1420 | 357.7 |
| D | 7 | 238 | 875694 | 2444.23 | 1464 | 1420 | 357.7 |
| D | 1 | 52 | 471596 | 1314.48 | 1464 | 1420 | 357.7 |
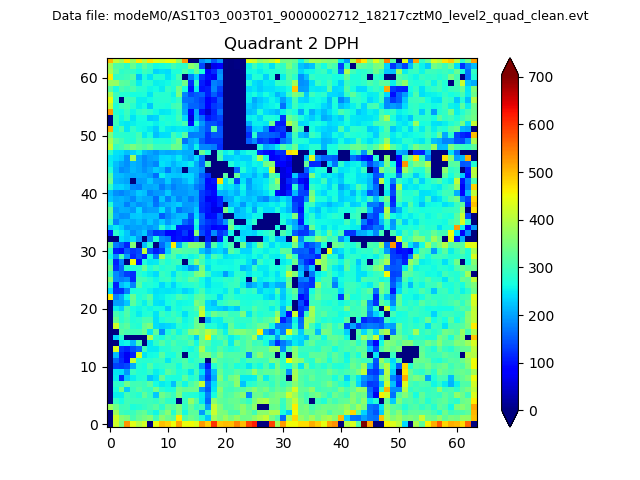
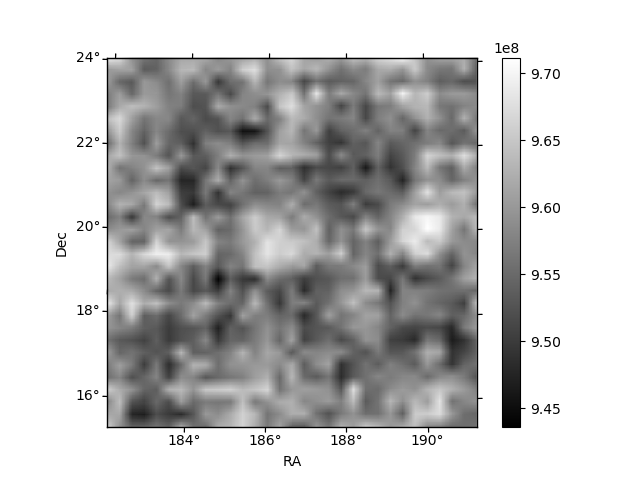
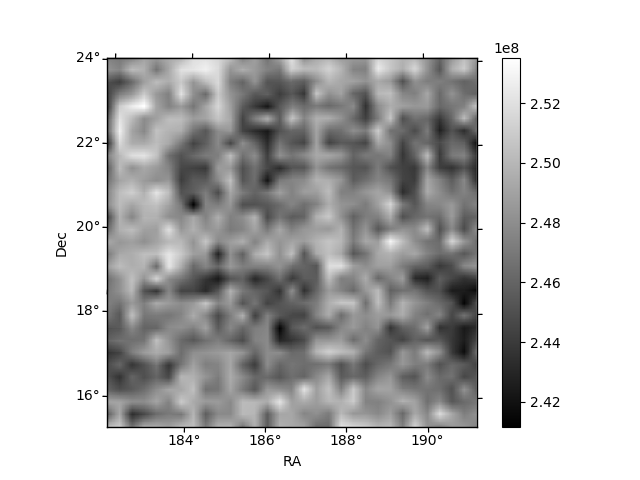
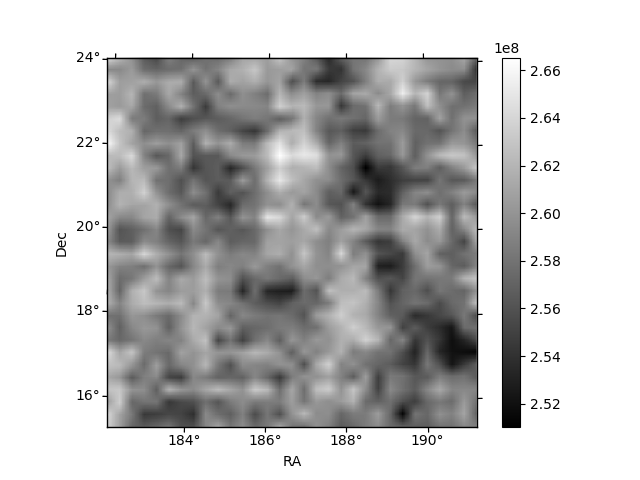
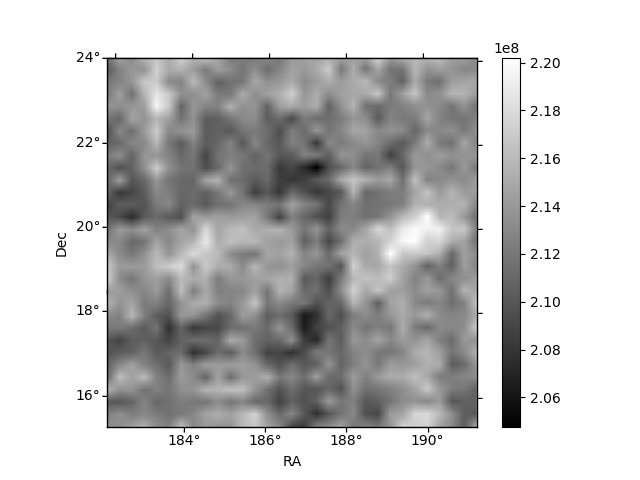
Histogram calculated using DETX and DETY for each event in the final _common_clean file
| Quadrant A | 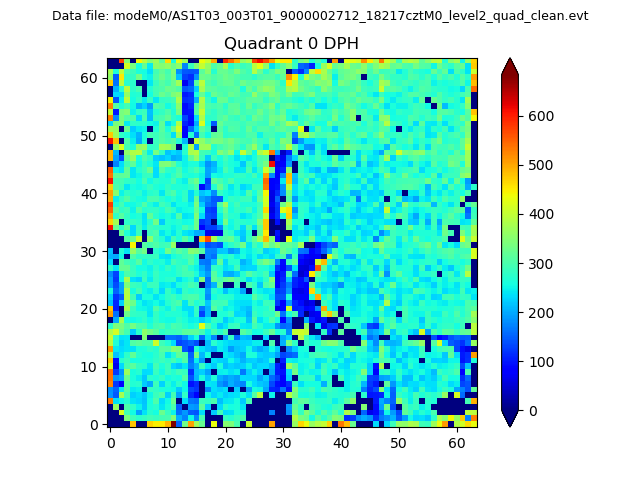 |
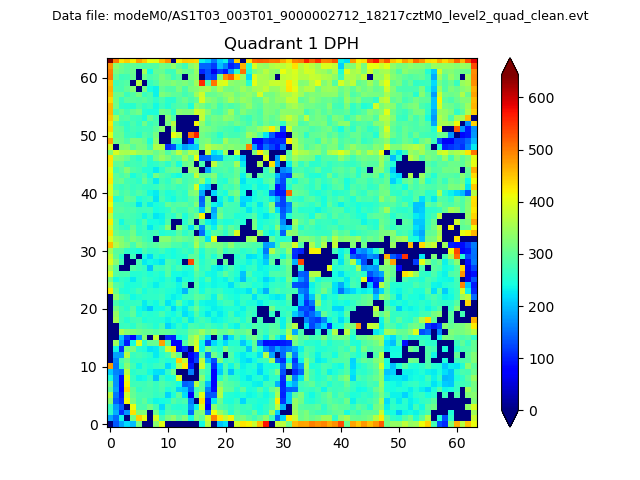 |
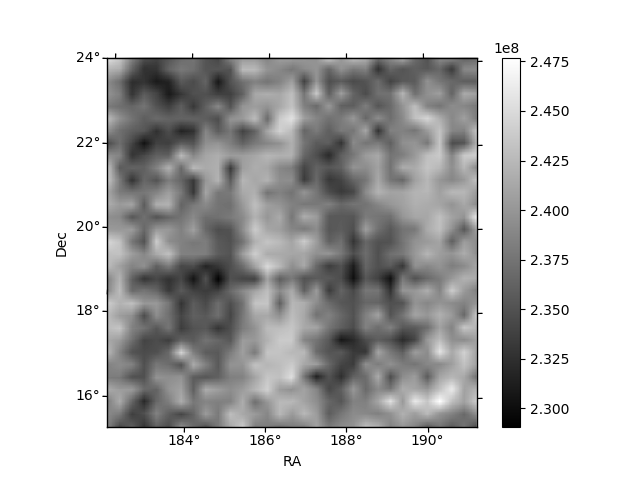
Quadrant B |
|---|---|---|---|
| Quadrant D | 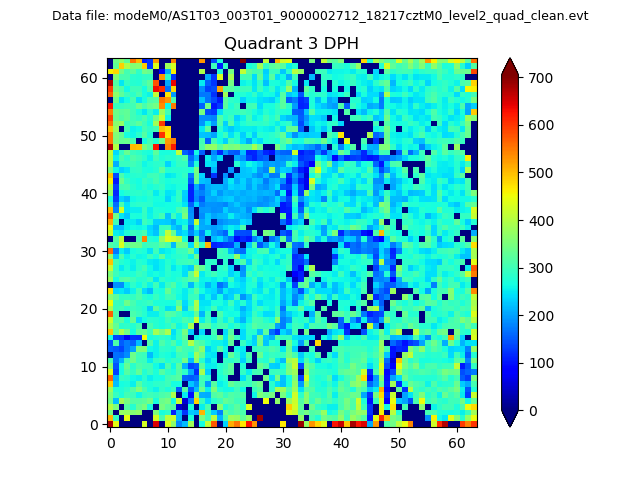 |
 |
Quadrant C |
| Plot type | Count rate plots | Images |
|---|---|---|
| Comparison with Poisson distribution Blue bars denote a histogram of data divided into 1 sec bins. Red curve is a Poisson curve with rate = median count rate of data. |
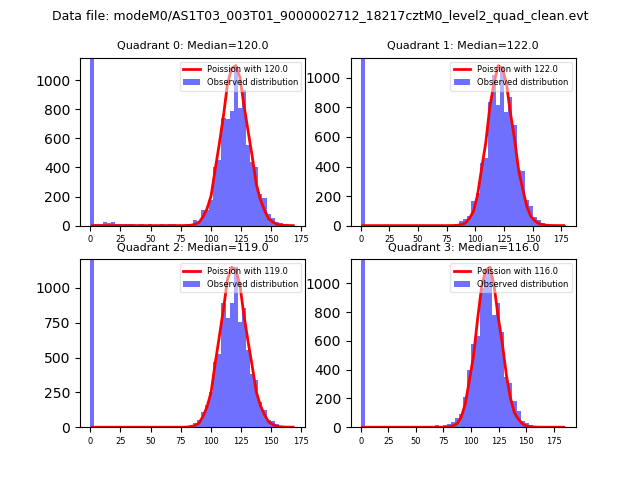 |
 |
| Quadrant-wise count rates Data is divided into 100 sec bins |
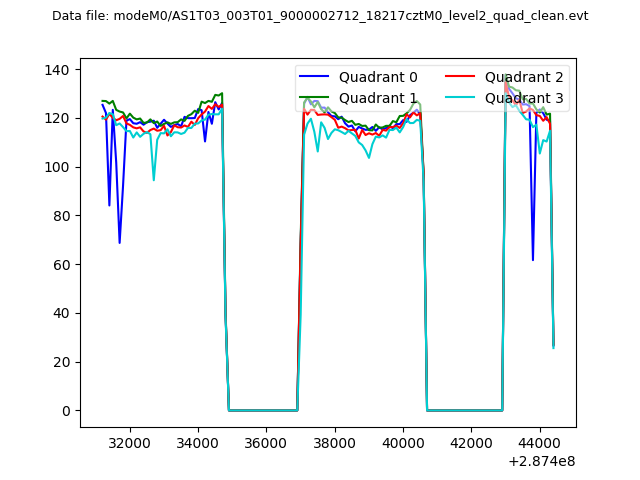 |
|
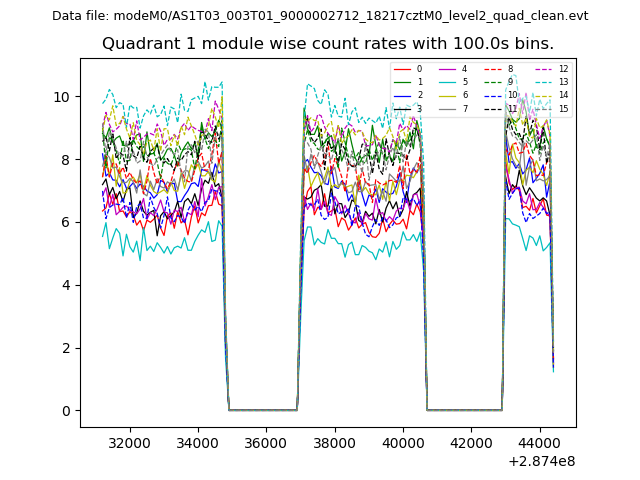
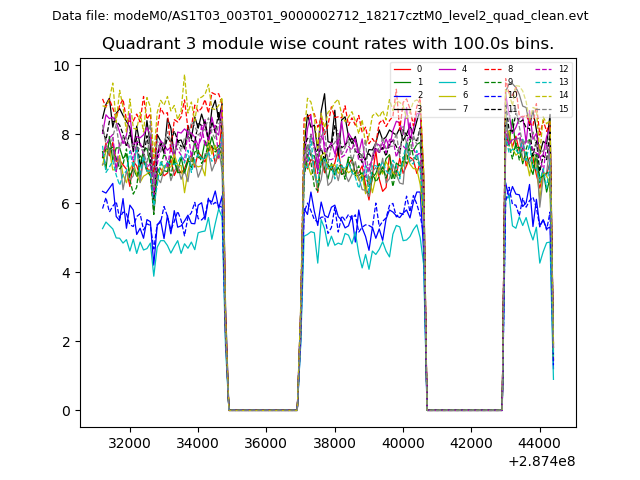
| Module-wise count rates for Quadrant A Data is divided into 100 sec bins |
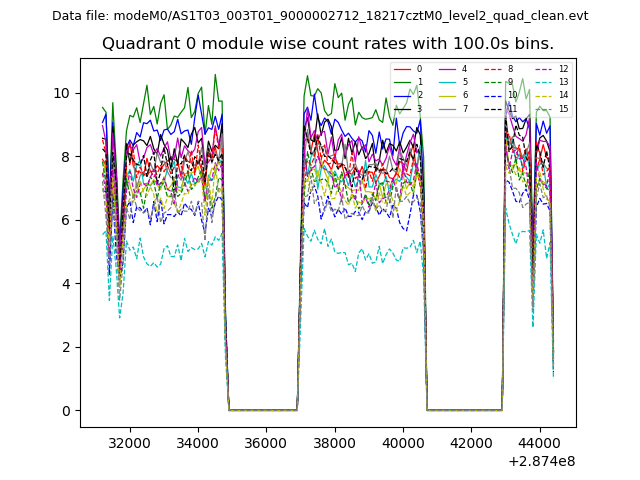 |
 |
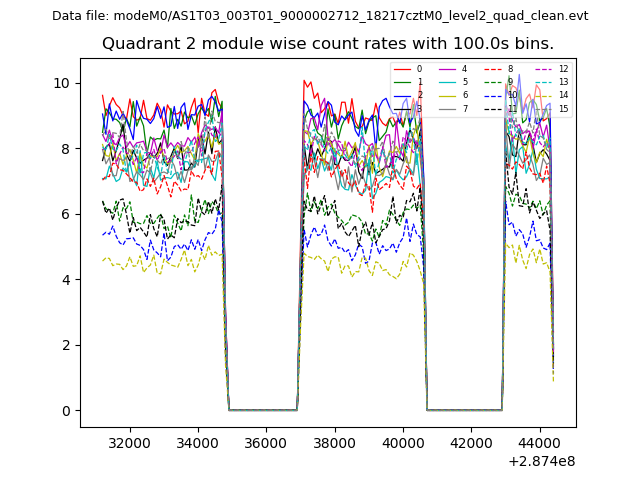
| Module-wise count rates for Quadrant B Data is divided into 100 sec bins |
 |
 |
| Module-wise count rates for Quadrant C Data is divided into 100 sec bins |
 |
 |
| Module-wise count rates for Quadrant D Data is divided into 100 sec bins |
 |
 |
| Parameter | Plot |
|---|---|
| CZT HV Monitor | 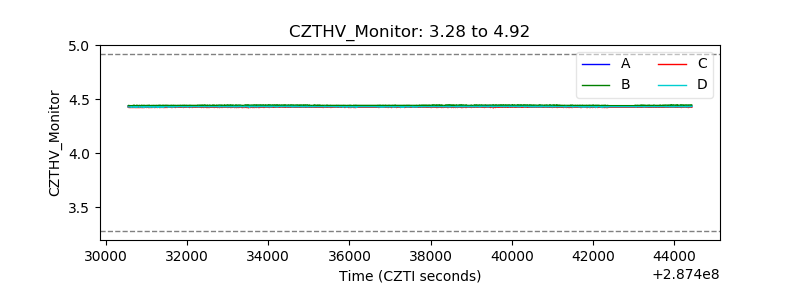 |
| D_VDD | 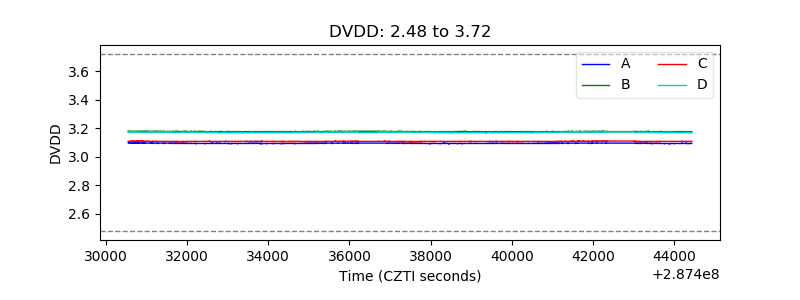 |
| Temperature 1 | 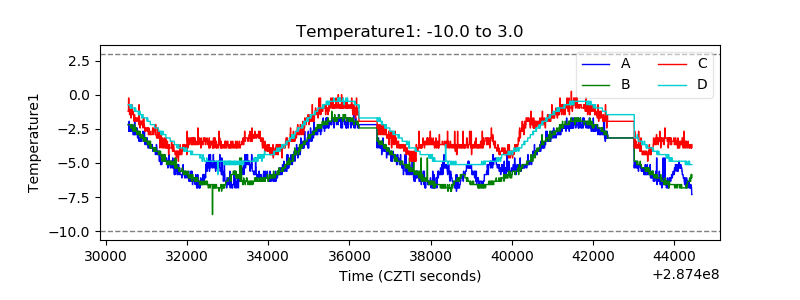 |
| Veto HV Monitor | 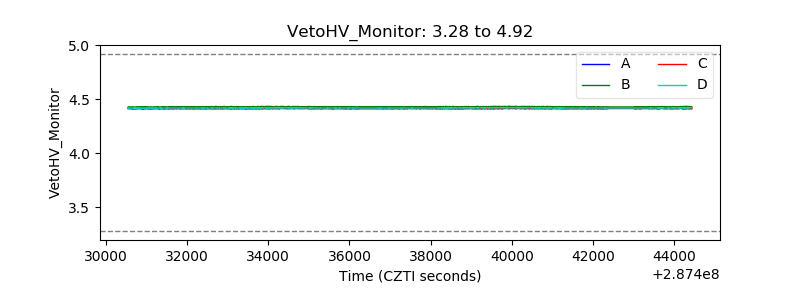 |
| Veto LLD | 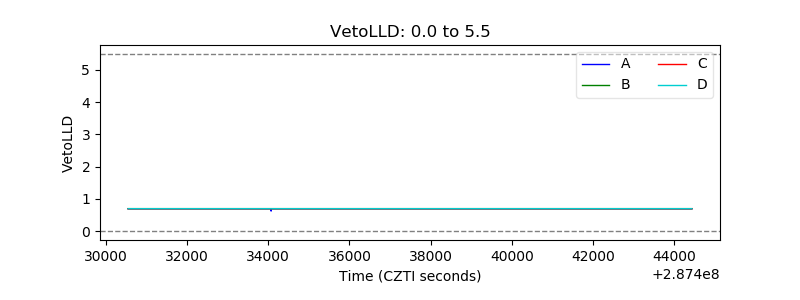 |
| Alpha Counter | 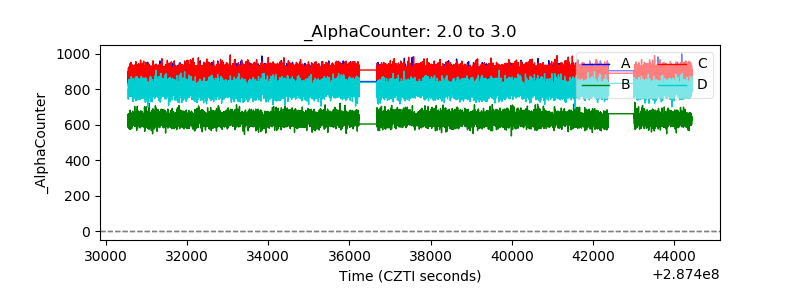 |
| _CPM_Rate | 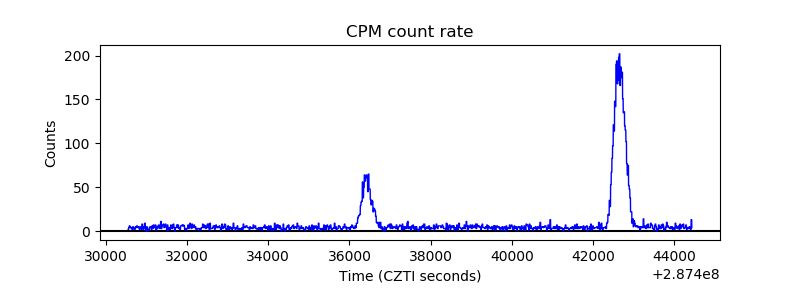 |
| CZT Counter | 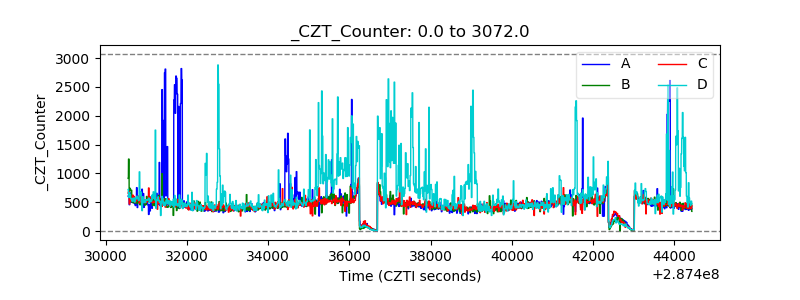 |
| +2.5 Volts monitor | 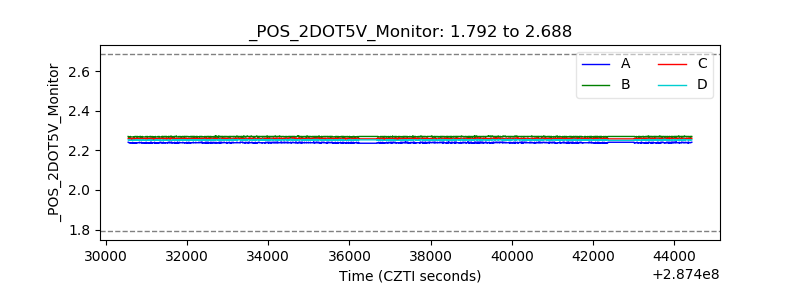 |
| +5 Volts monitor | 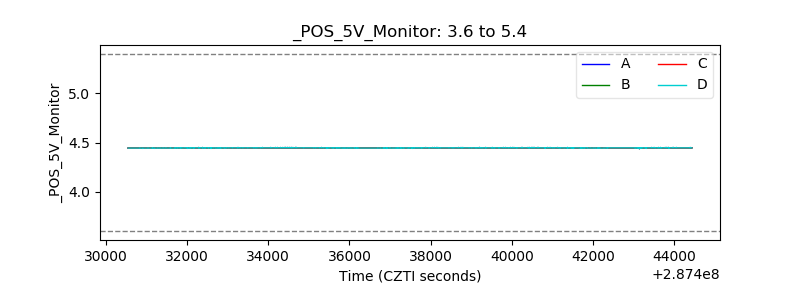 |
| _ROLL_ROT | 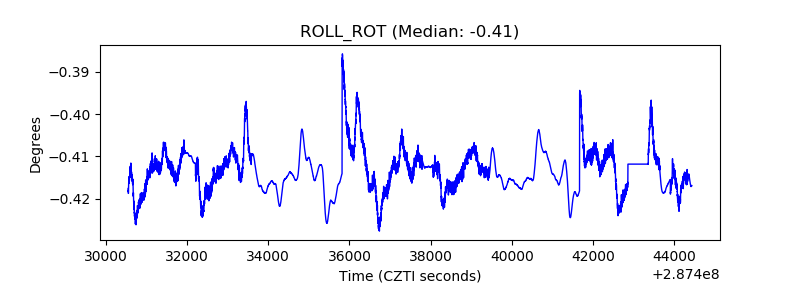 |
| _Roll_DEC | 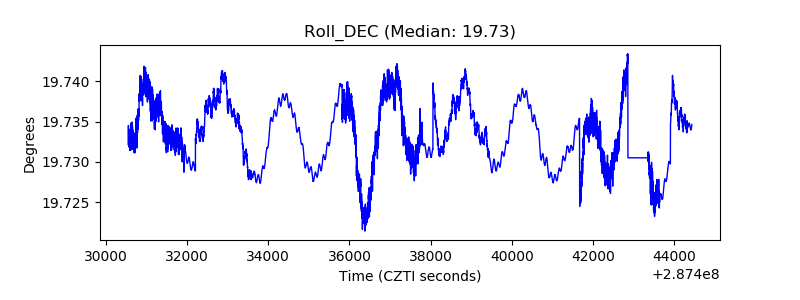 |
| _Roll_RA | 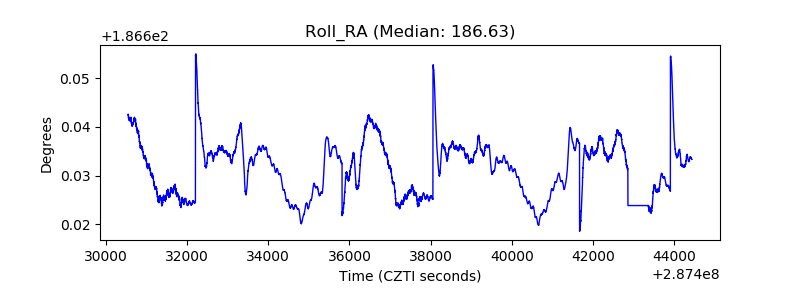 |
| Veto Counter | 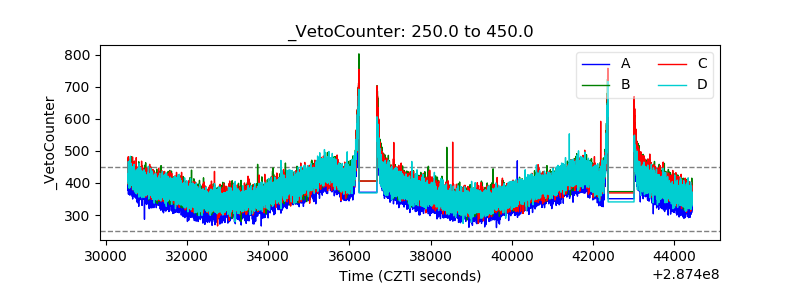 |