| Param | Original file | Final file |
|---|---|---|
| Filename | modeM0/AS1A05_163T01_9000002820_18938cztM0_level2.evt | modeM0/AS1A05_163T01_9000002820_18938cztM0_level2_quad_clean.evt |
| Size (bytes) | 917,282,880 | 69,912,000 |
| Size | 874.8 MB | 66.7 MB |
| Events in quadrant A | 10,973,102 | 307,853 |
| Events in quadrant B | 5,143,734 | 453,821 |
| Events in quadrant C | 3,568,819 | 447,302 |
| Events in quadrant D | 7,627,684 | 424,081 |
| Mode M0 | |||
|---|---|---|---|
| Quadrant | BADHDUFLAG | Total packets | Discarded packets |
| A | 0 | 37285 | 1 |
| B | 0 | 19799 | 4 |
| C | 0 | 14677 | 1 |
| D | 0 | 27446 | 1 |
| Mode SS | |||
|---|---|---|---|
| Quadrant | BADHDUFLAG | Total packets | Discarded packets |
| A | 0 | 140 | 0 |
| B | 0 | 140 | 0 |
| C | 0 | 140 | 0 |
| D | 0 | 140 | 0 |
| Mode M9 | |||
|---|---|---|---|
| Quadrant | BADHDUFLAG | Total packets | Discarded packets |
| A | 0 | 3 | 0 |
| B | 0 | 3 | 0 |
| C | 0 | 3 | 0 |
| D | 0 | 3 | 0 |
| Quadrant | Total seconds | Saturated seconds | Saturation percentage |
|---|---|---|---|
| A | 6928 | 2920 | 42.147806% |
| B | 6928 | 574 | 8.285219% |
| C | 6928 | 110 | 1.587760% |
| D | 6928 | 1282 | 18.504619% |
Noise dominated data is calculated using 1-second bins in cleaned event files. If a bin has >2000 counts, and if more than 50% of those come from <1% of pixels, then it is considered to be noise-dominated and hence unusable.
| Quadrant | # 1 sec bins | Bins with >0 counts | Bins with >2000 counts | High rate bins dominated by noise | Noise dominated (total time) | Noise dominated (detector-on time) | Marked lightcurve |
|---|---|---|---|---|---|---|---|
| A | 7258 | 6929 | 2292 | 2292 | 31.58% | 33.08% | 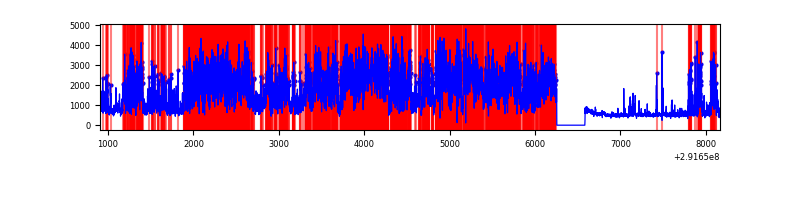 |
| B | 7258 | 6929 | 330 | 330 | 4.55% | 4.76% | 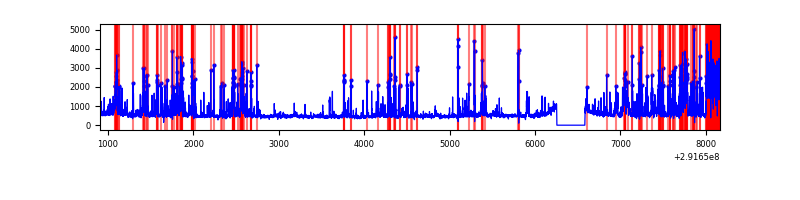 |
| C | 7258 | 6929 | 10 | 10 | 0.14% | 0.14% | 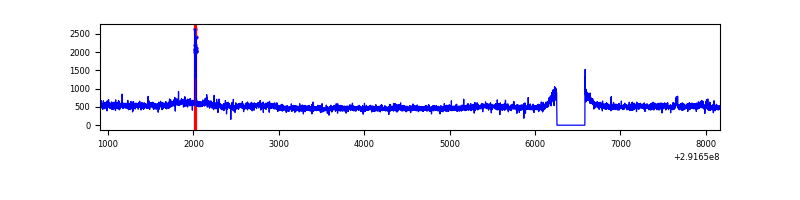 |
| D | 7258 | 6929 | 967 | 967 | 13.32% | 13.96% | 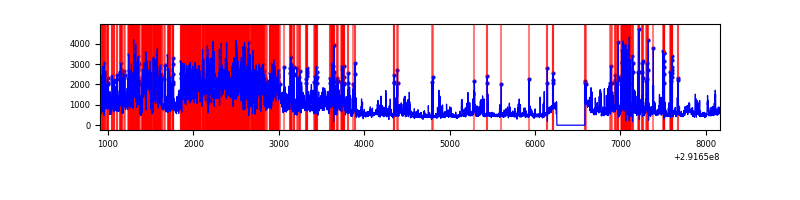 |
Top three noisy pixels from each quadrant. If the there are fewer than three noisy pixels in the level2.evt file, extra rows are filled as -1
| Pixel properties | Quadrant properties | ||||||
|---|---|---|---|---|---|---|---|
| Quadrant | DetID | PixID | Counts | Sigma | Mean | Median | Sigma |
| A | 14 | 235 | 8330980 | 59400.23 | 684 | 670 | 140.2 |
| A | 13 | 254 | 8885 | 58.58 | 684 | 670 | 140.2 |
| A | 0 | 226 | 5947 | 37.63 | 684 | 670 | 140.2 |
| B | 3 | 112 | 1695068 | 10844.37 | 810 | 790 | 156.2 |
| B | 7 | 220 | 169636 | 1080.71 | 810 | 790 | 156.2 |
| B | 0 | 189 | 41316 | 259.39 | 810 | 790 | 156.2 |
| C | 3 | 233 | 317704 | 1674.13 | 801 | 806 | 189.3 |
| C | 14 | 238 | 123041 | 645.75 | 801 | 806 | 189.3 |
| C | 13 | 61 | 5702 | 25.86 | 801 | 806 | 189.3 |
| D | 7 | 238 | 3510987 | 18466.67 | 768 | 744 | 190.1 |
| D | 1 | 52 | 661265 | 3474.86 | 768 | 744 | 190.1 |
| D | 14 | 34 | 220666 | 1156.96 | 768 | 744 | 190.1 |
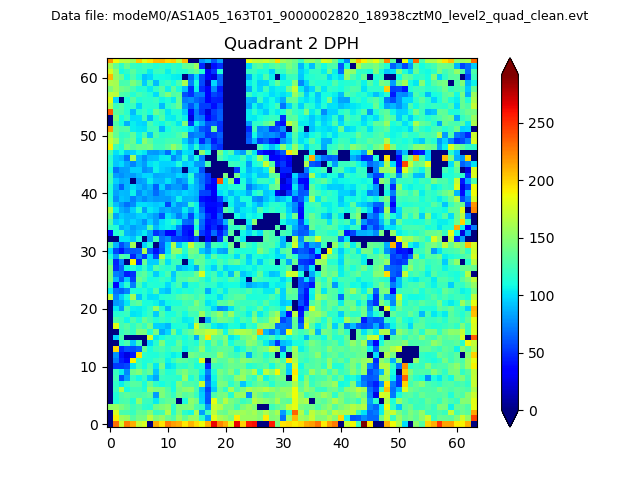
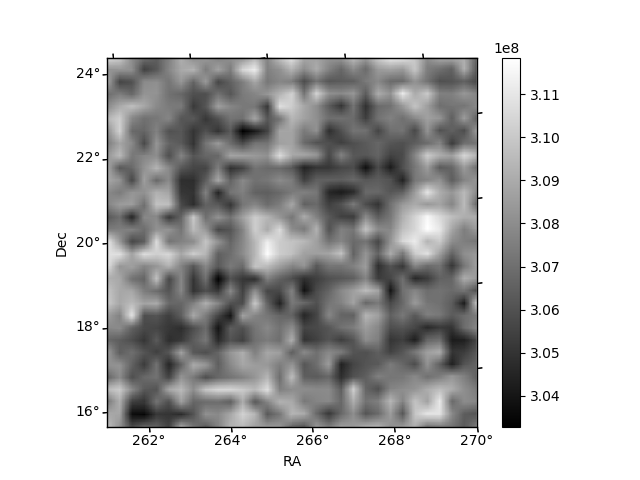
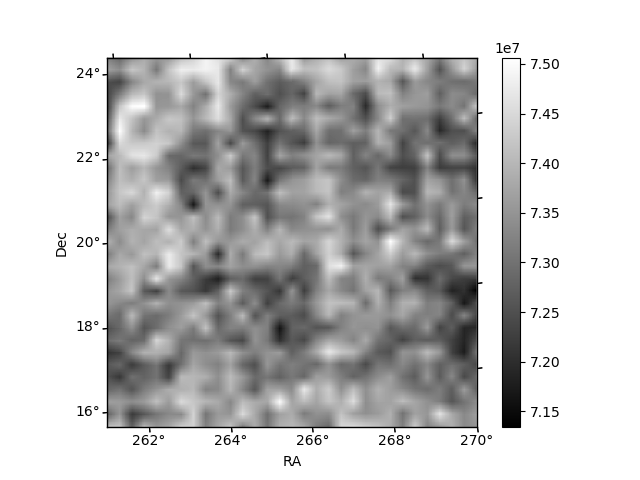
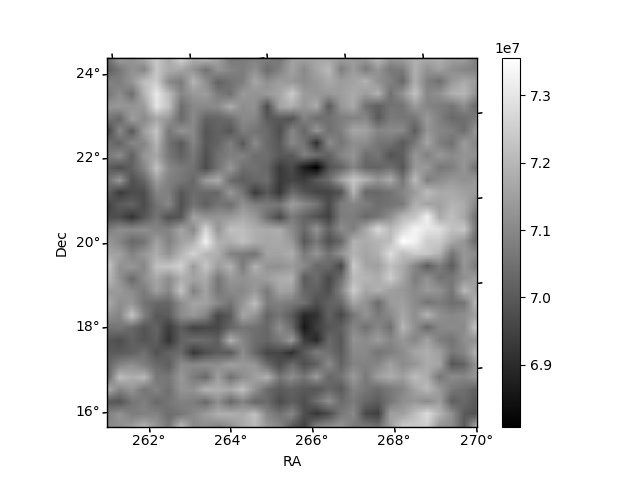
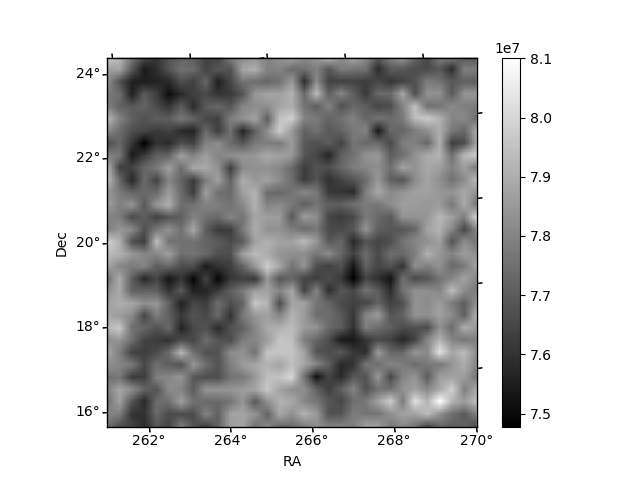
Histogram calculated using DETX and DETY for each event in the final _common_clean file
| Quadrant A | 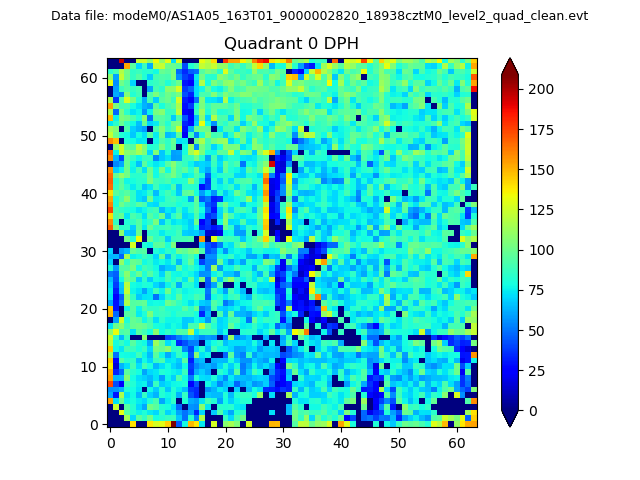 |
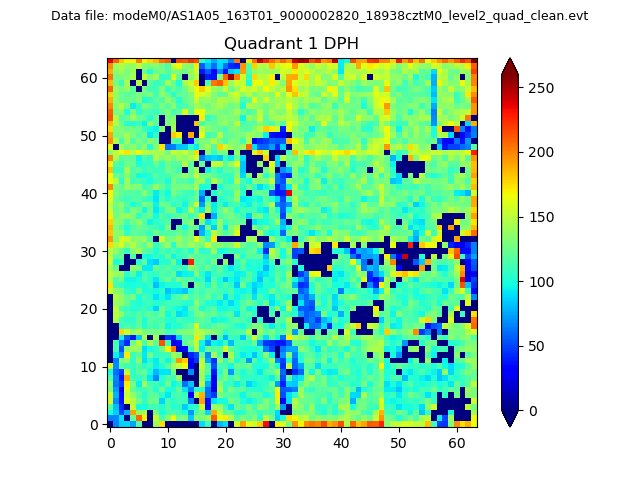 |
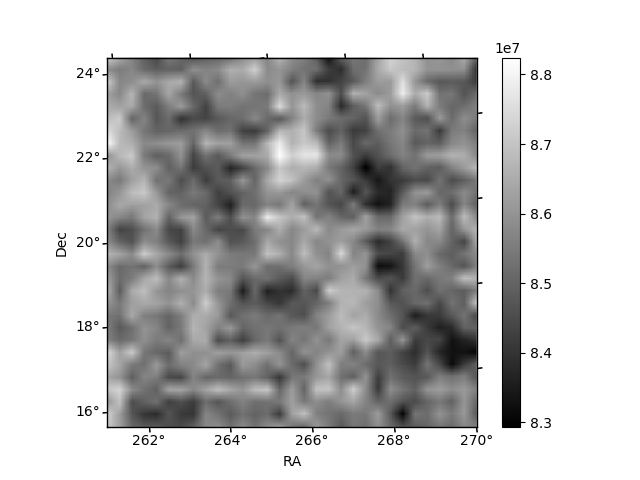
Quadrant B |
|---|---|---|---|
| Quadrant D | 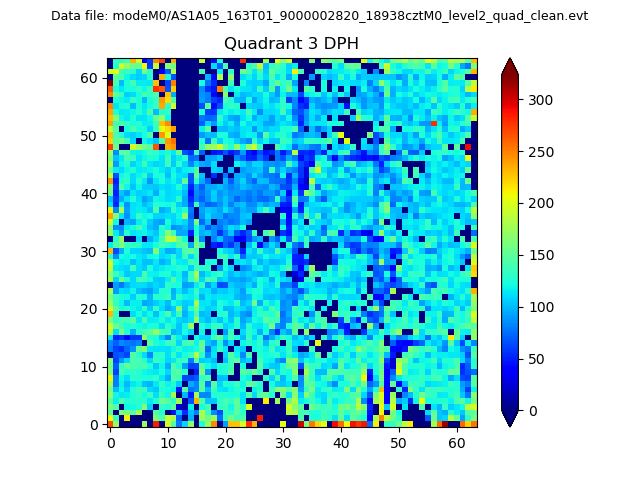 |
 |
Quadrant C |
| Plot type | Count rate plots | Images |
|---|---|---|
| Comparison with Poisson distribution Blue bars denote a histogram of data divided into 1 sec bins. Red curve is a Poisson curve with rate = median count rate of data. |
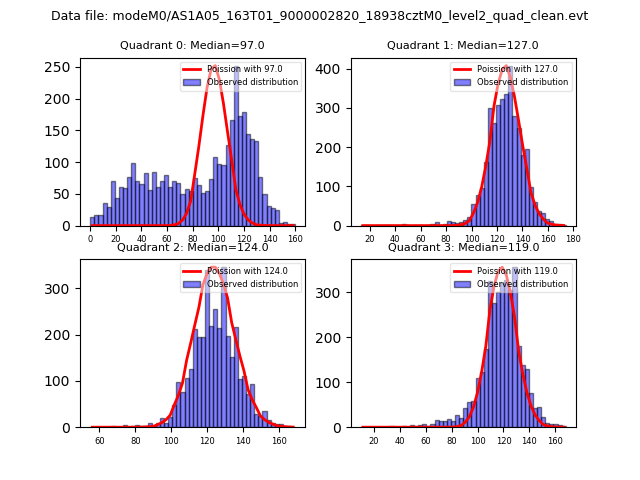 |
 |
| Quadrant-wise count rates Data is divided into 100 sec bins |
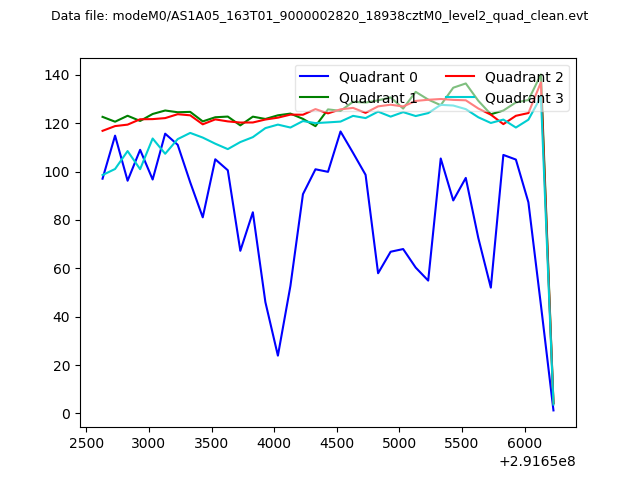 |
|
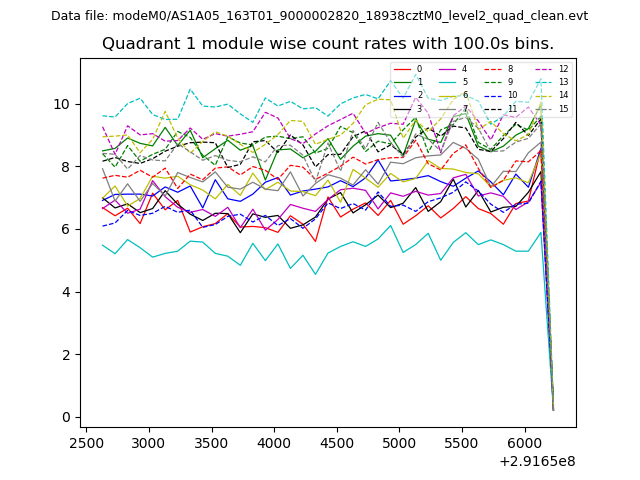
| Module-wise count rates for Quadrant A Data is divided into 100 sec bins |
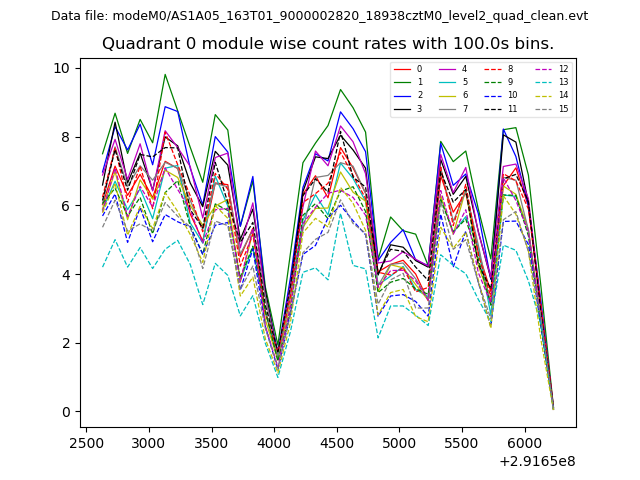 |
 |
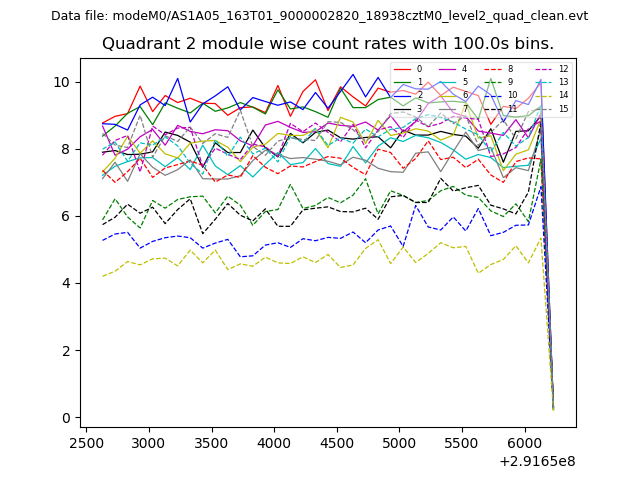
| Module-wise count rates for Quadrant B Data is divided into 100 sec bins |
 |
 |
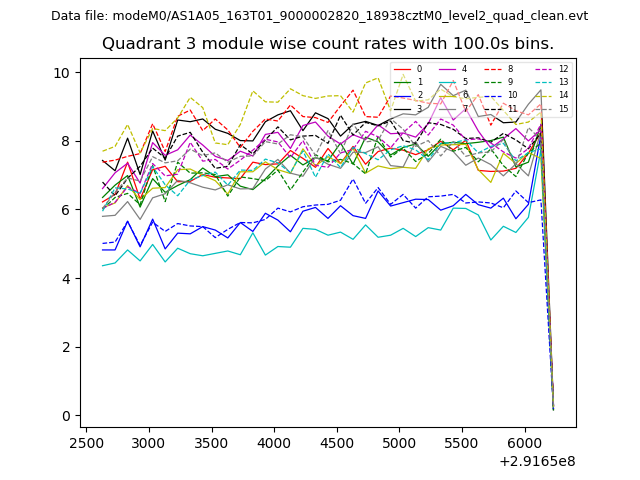
| Module-wise count rates for Quadrant C Data is divided into 100 sec bins |
 |
 |
| Module-wise count rates for Quadrant D Data is divided into 100 sec bins |
 |
 |
| Parameter | Plot |
|---|---|
| CZT HV Monitor | 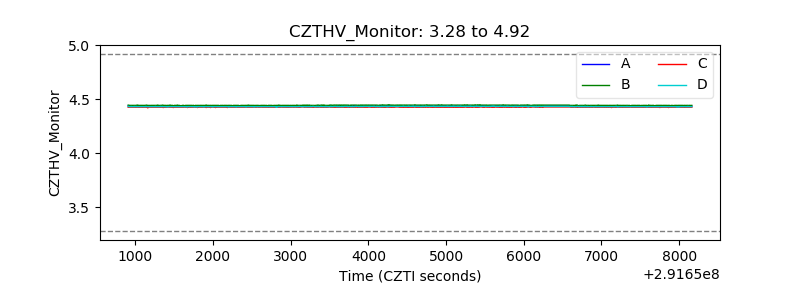 |
| D_VDD | 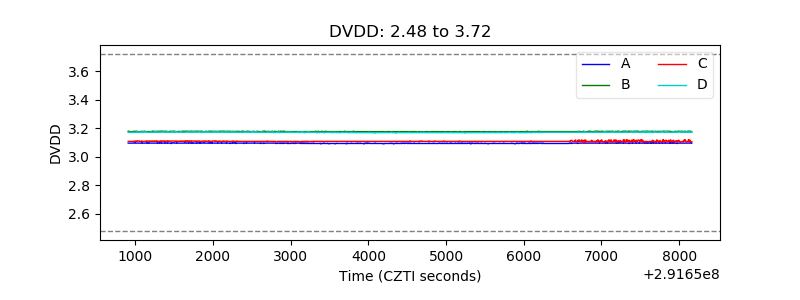 |
| Temperature 1 | 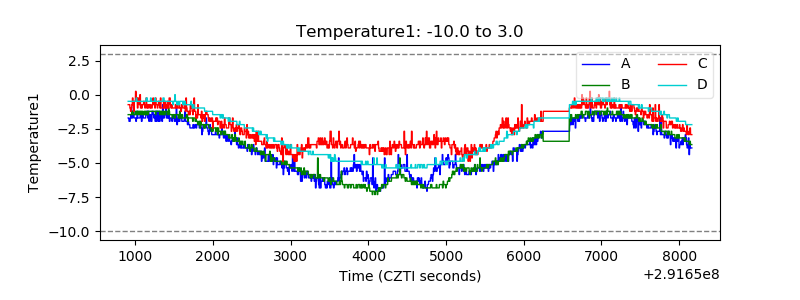 |
| Veto HV Monitor | 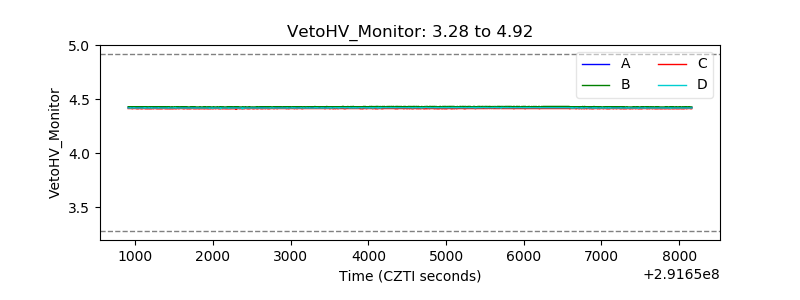 |
| Veto LLD | 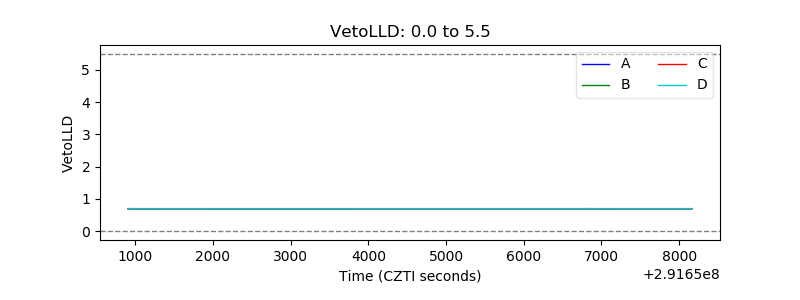 |
| Alpha Counter | 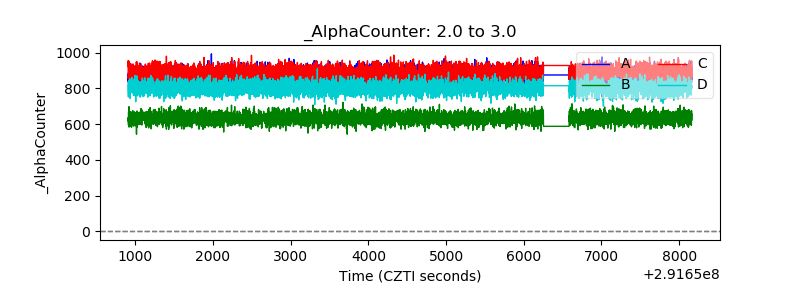 |
| _CPM_Rate | 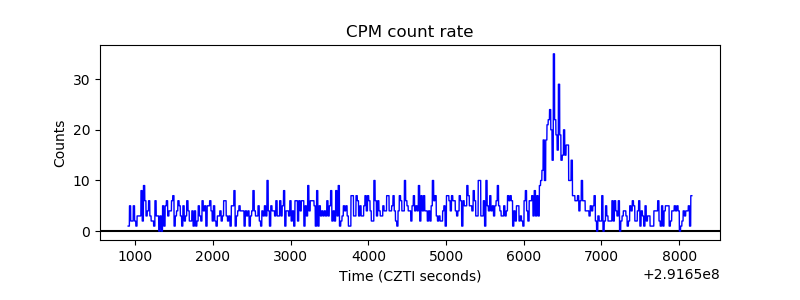 |
| CZT Counter | 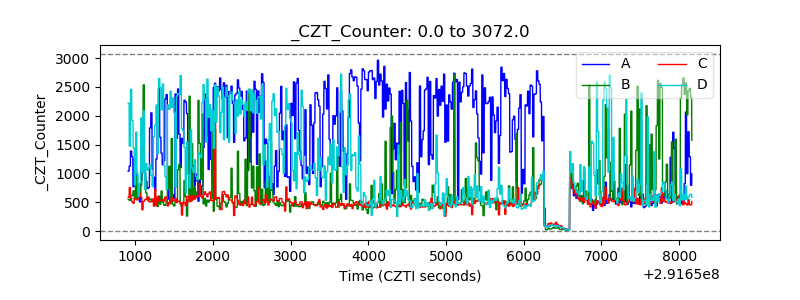 |
| +2.5 Volts monitor | 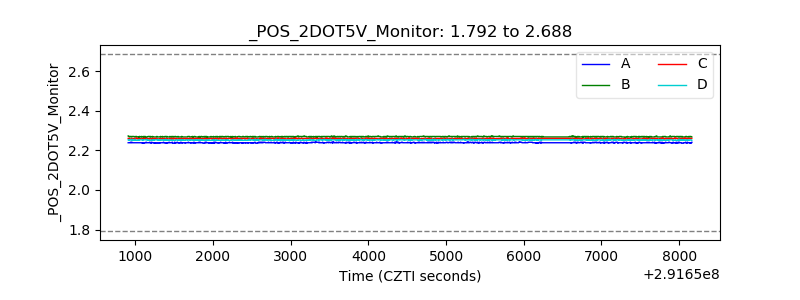 |
| +5 Volts monitor | 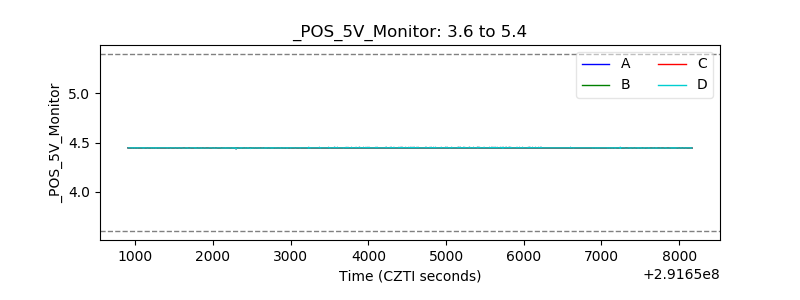 |
| _ROLL_ROT | 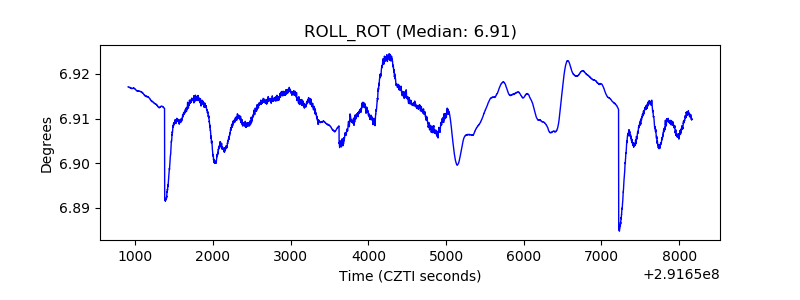 |
| _Roll_DEC | 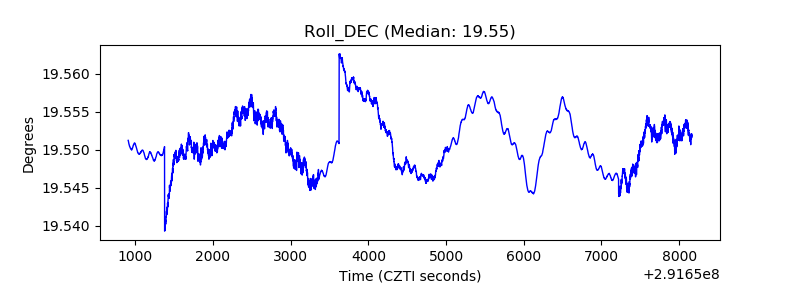 |
| _Roll_RA | 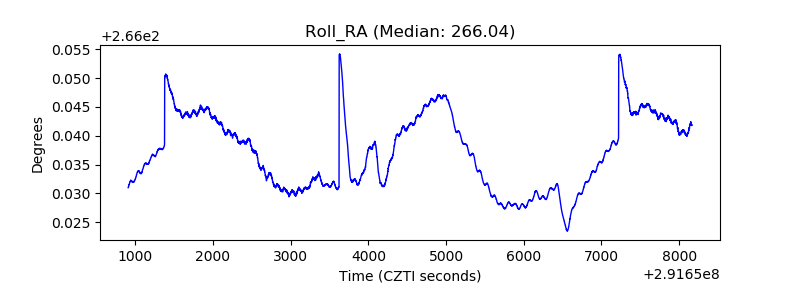 |
| Veto Counter | 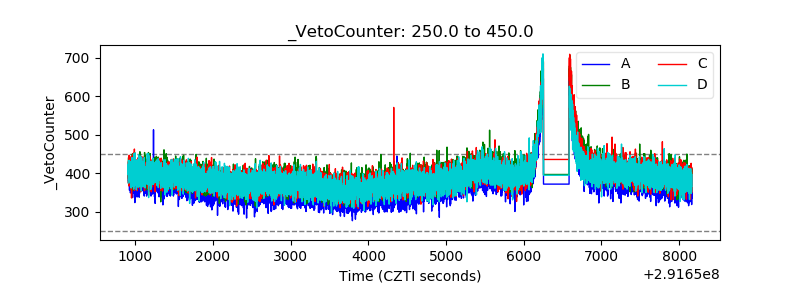 |