| Param | Original file | Final file |
|---|---|---|
| Filename | modeM0/AS1A05_064T01_9000002964_19903cztM0_level2.evt | modeM0/AS1A05_064T01_9000002964_19903cztM0_level2_quad_clean.evt |
| Size (bytes) | 627,024,960 | 110,283,840 |
| Size | 598.0 MB | 105.2 MB |
| Events in quadrant A | 2,843,396 | 759,168 |
| Events in quadrant B | 3,206,561 | 778,096 |
| Events in quadrant C | 3,552,078 | 758,286 |
| Events in quadrant D | 8,979,699 | 623,036 |
| Mode M0 | |||
|---|---|---|---|
| Quadrant | BADHDUFLAG | Total packets | Discarded packets |
| A | 0 | 12409 | 1 |
| B | 0 | 13453 | 1 |
| C | 0 | 14418 | 2 |
| D | 0 | 30809 | 1 |
| Mode SS | |||
|---|---|---|---|
| Quadrant | BADHDUFLAG | Total packets | Discarded packets |
| A | 0 | 124 | 0 |
| B | 0 | 124 | 0 |
| C | 0 | 124 | 0 |
| D | 0 | 124 | 0 |
| Mode M9 | |||
|---|---|---|---|
| Quadrant | BADHDUFLAG | Total packets | Discarded packets |
| A | 0 | 13 | 0 |
| B | 0 | 13 | 0 |
| C | 0 | 13 | 0 |
| D | 0 | 13 | 0 |
| Quadrant | Total seconds | Saturated seconds | Saturation percentage |
|---|---|---|---|
| A | 6017 | 19 | 0.315772% |
| B | 6018 | 36 | 0.598205% |
| C | 6017 | 209 | 3.473492% |
| D | 6017 | 1999 | 33.222536% |
Noise dominated data is calculated using 1-second bins in cleaned event files. If a bin has >2000 counts, and if more than 50% of those come from <1% of pixels, then it is considered to be noise-dominated and hence unusable.
| Quadrant | # 1 sec bins | Bins with >0 counts | Bins with >2000 counts | High rate bins dominated by noise | Noise dominated (total time) | Noise dominated (detector-on time) | Marked lightcurve |
|---|---|---|---|---|---|---|---|
| A | 7357 | 6018 | 3 | 3 | 0.04% | 0.05% | 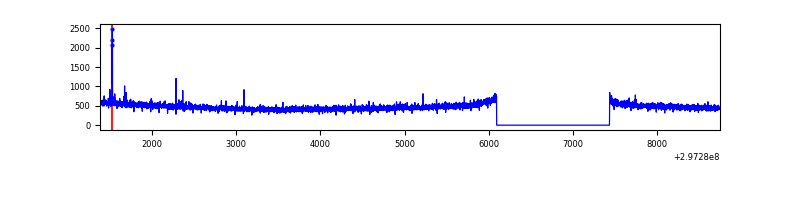 |
| B | 7358 | 6019 | 8 | 8 | 0.11% | 0.13% | 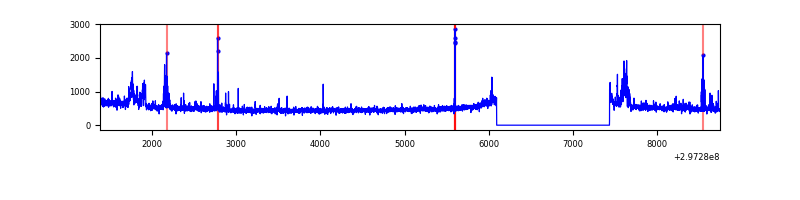 |
| C | 7357 | 6017 | 89 | 89 | 1.21% | 1.48% | 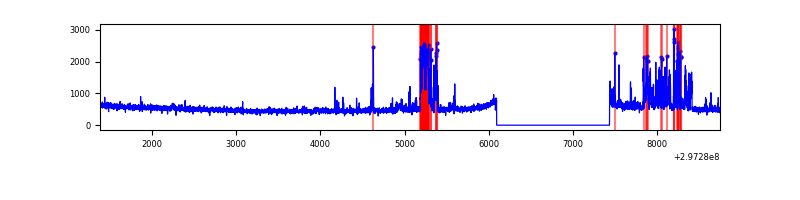 |
| D | 7357 | 6017 | 2093 | 2093 | 28.45% | 34.78% | 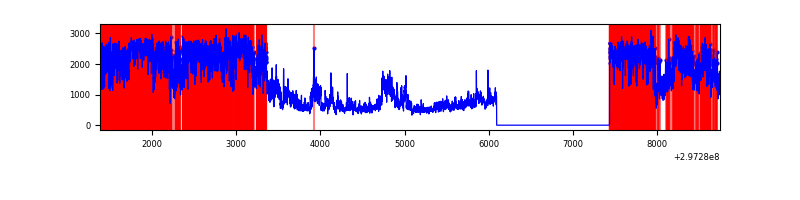 |
Top three noisy pixels from each quadrant. If the there are fewer than three noisy pixels in the level2.evt file, extra rows are filled as -1
| Pixel properties | Quadrant properties | ||||||
|---|---|---|---|---|---|---|---|
| Quadrant | DetID | PixID | Counts | Sigma | Mean | Median | Sigma |
| A | 9 | 143 | 15183 | 97.78 | 735 | 720 | 147.9 |
| A | 0 | 226 | 6411 | 38.47 | 735 | 720 | 147.9 |
| A | 12 | 194 | 5436 | 31.88 | 735 | 720 | 147.9 |
| B | 0 | 190 | 88584 | 635.77 | 745 | 724 | 138.2 |
| B | 4 | 216 | 79359 | 569.02 | 745 | 724 | 138.2 |
| B | 0 | 197 | 33354 | 236.12 | 745 | 724 | 138.2 |
| C | 9 | 221 | 589215 | 3490.16 | 728 | 735 | 168.6 |
| C | 14 | 238 | 114645 | 675.58 | 728 | 735 | 168.6 |
| C | 13 | 61 | 5041 | 25.54 | 728 | 735 | 168.6 |
| D | 2 | 184 | 5870634 | 36757.44 | 663 | 644 | 159.7 |
| D | 7 | 38 | 229853 | 1435.29 | 663 | 644 | 159.7 |
| D | 5 | 222 | 118491 | 737.95 | 663 | 644 | 159.7 |
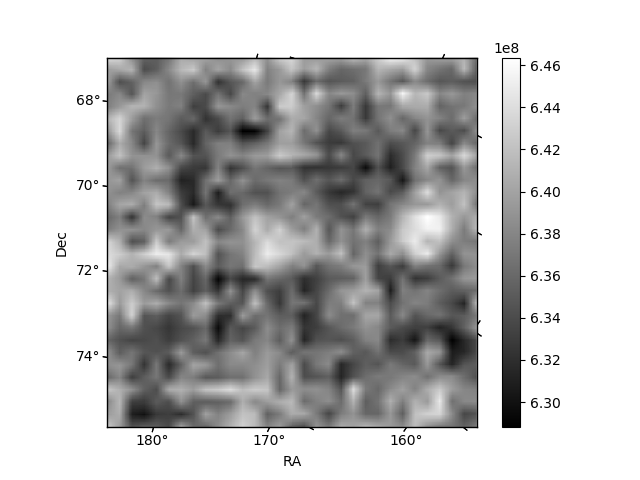
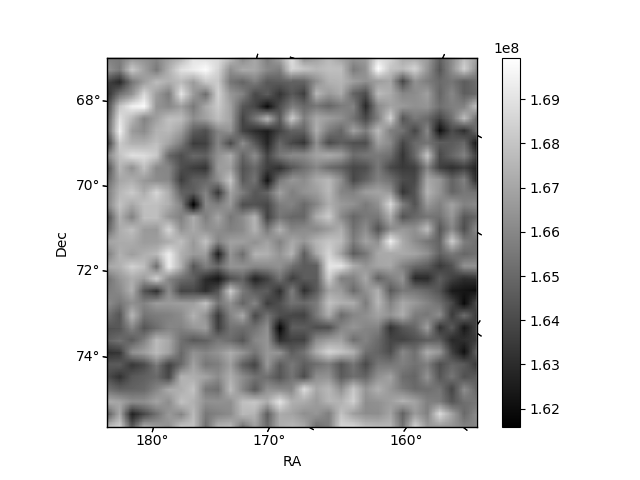
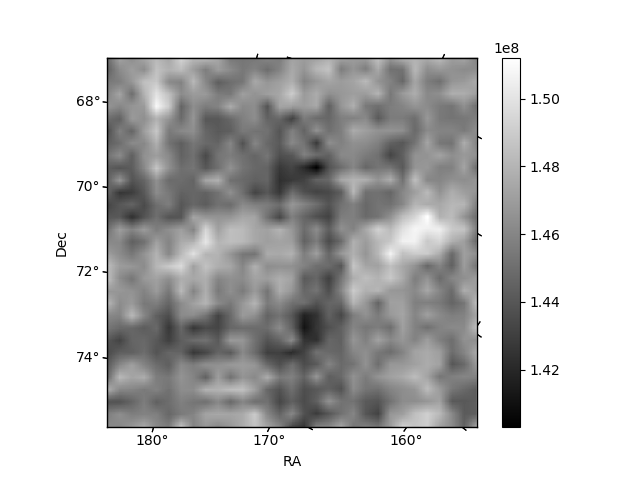
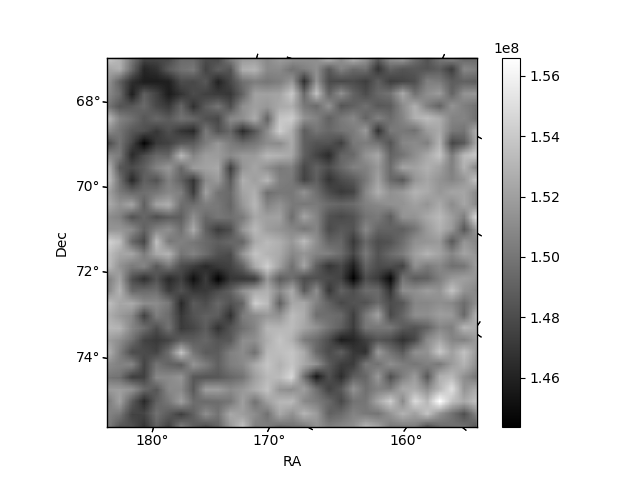
Histogram calculated using DETX and DETY for each event in the final _common_clean file
| Quadrant A | 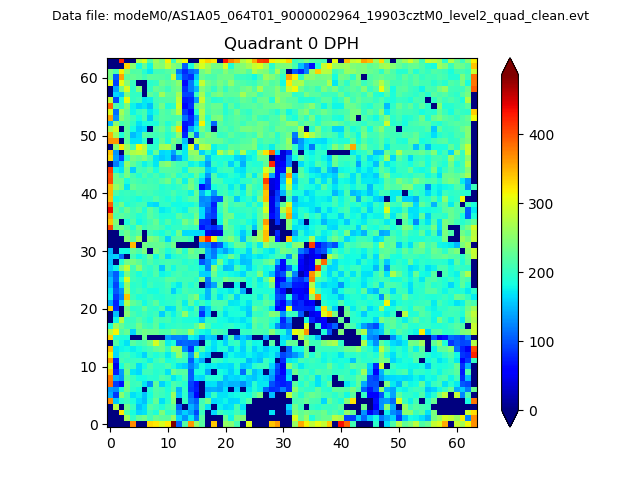 |
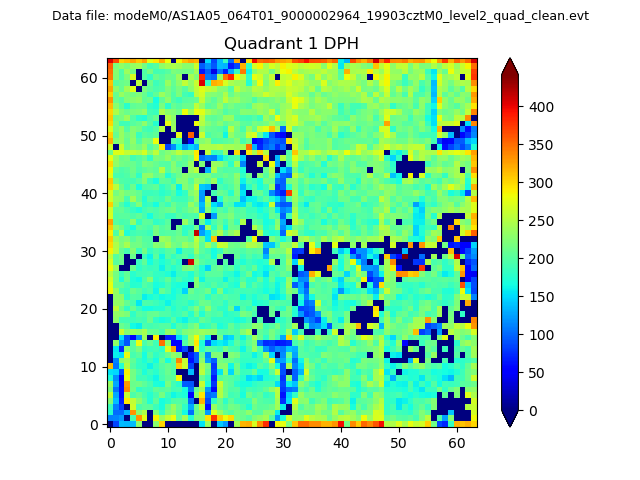 |
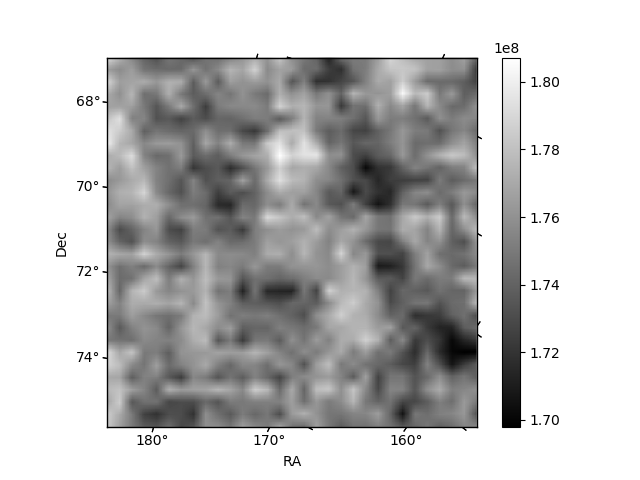
Quadrant B |
|---|---|---|---|
| Quadrant D | 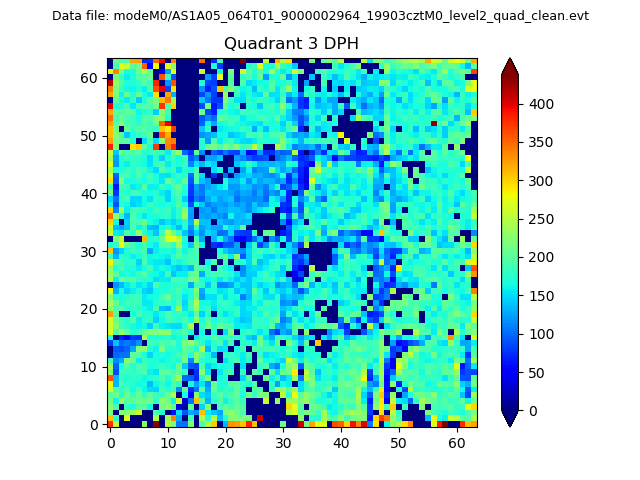 |
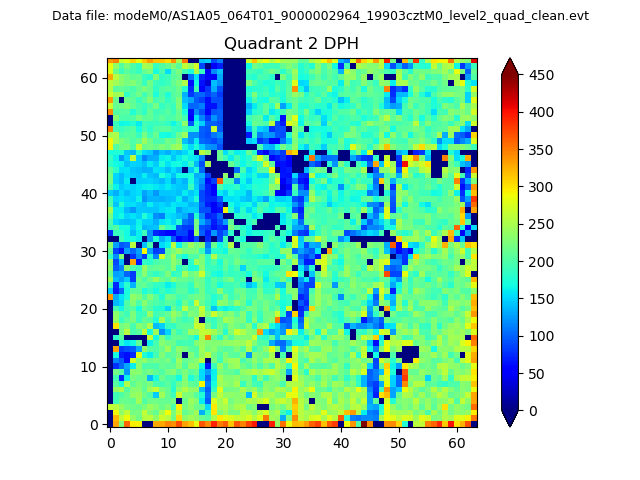 |
Quadrant C |
| Plot type | Count rate plots | Images |
|---|---|---|
| Comparison with Poisson distribution Blue bars denote a histogram of data divided into 1 sec bins. Red curve is a Poisson curve with rate = median count rate of data. |
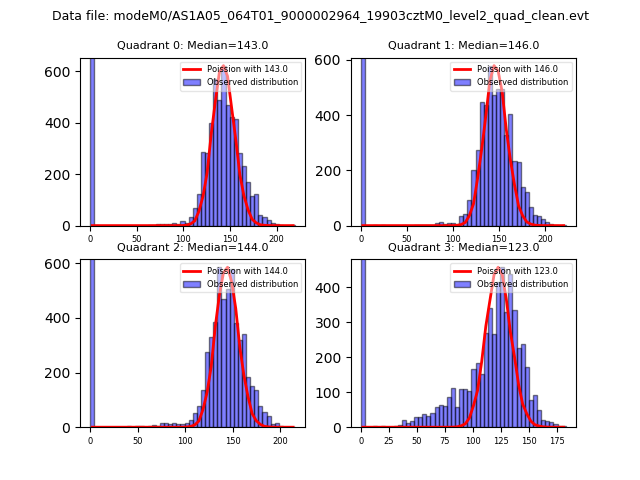 |
 |
| Quadrant-wise count rates Data is divided into 100 sec bins |
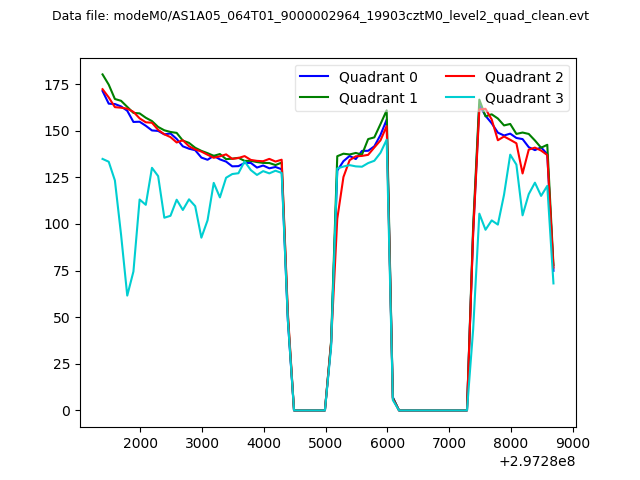 |
|
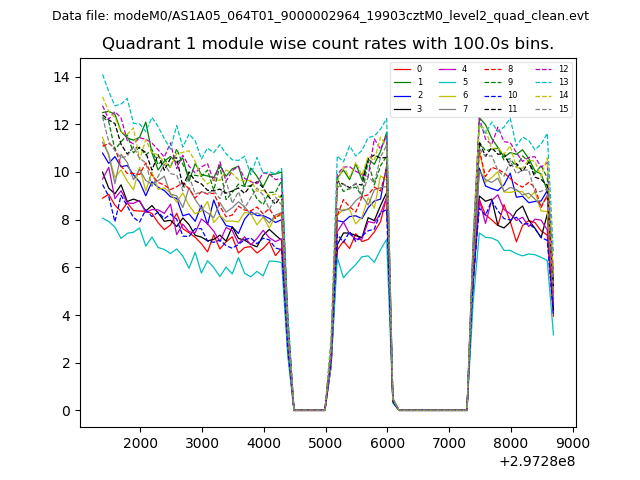
| Module-wise count rates for Quadrant A Data is divided into 100 sec bins |
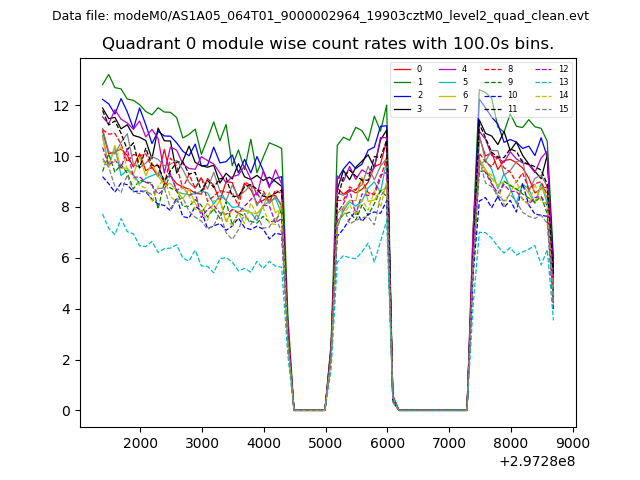 |
 |
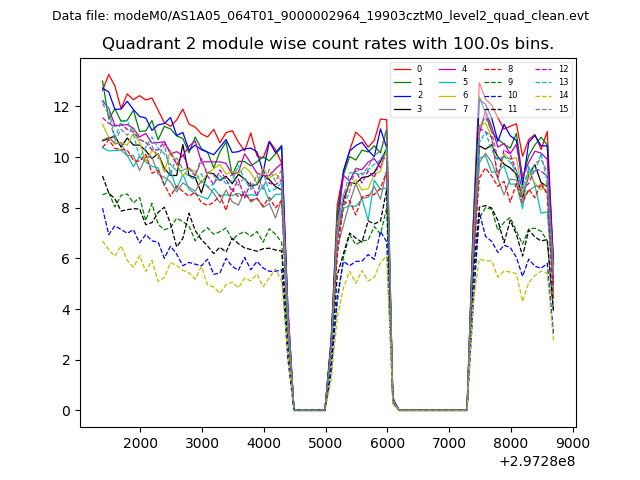
| Module-wise count rates for Quadrant B Data is divided into 100 sec bins |
 |
 |
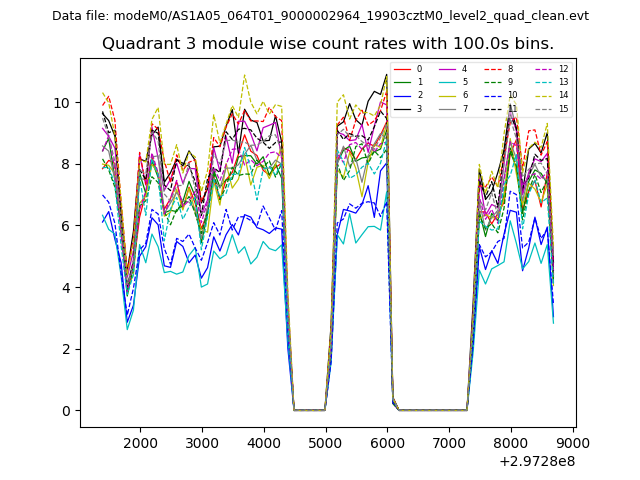
| Module-wise count rates for Quadrant C Data is divided into 100 sec bins |
 |
 |
| Module-wise count rates for Quadrant D Data is divided into 100 sec bins |
 |
 |
| Parameter | Plot |
|---|---|
| CZT HV Monitor | 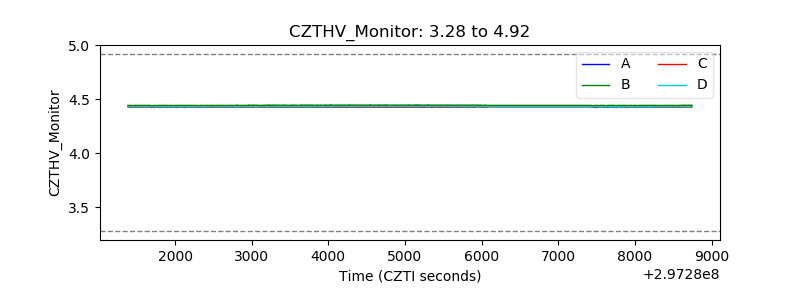 |
| D_VDD | 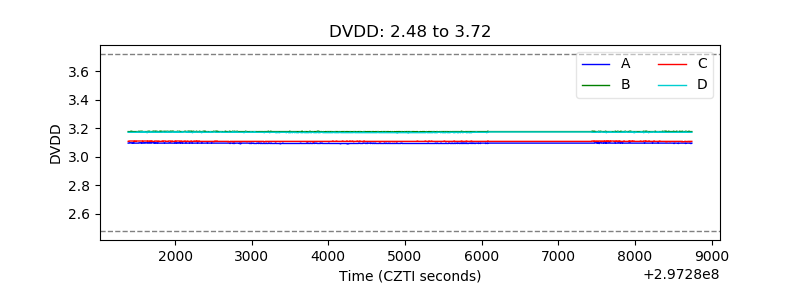 |
| Temperature 1 | 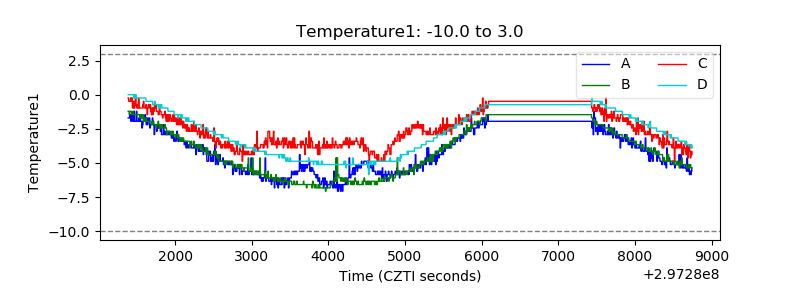 |
| Veto HV Monitor | 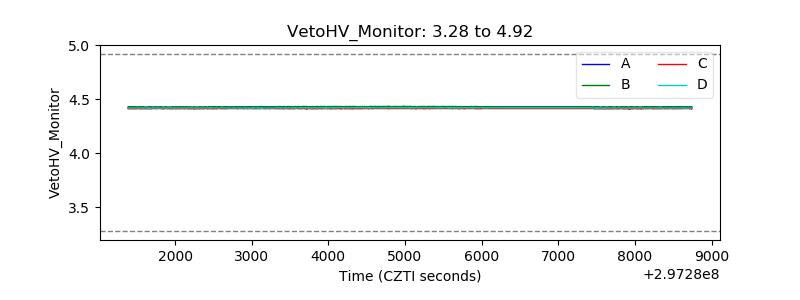 |
| Veto LLD | 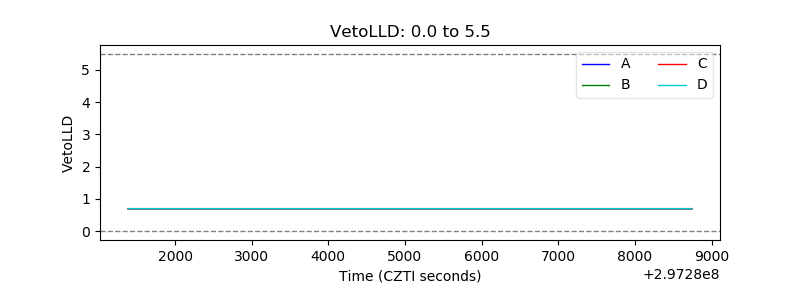 |
| Alpha Counter | 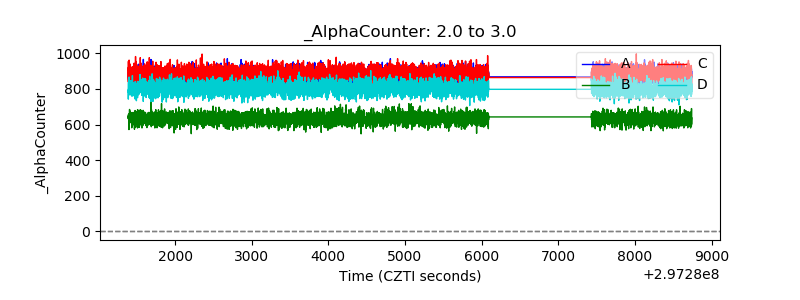 |
| _CPM_Rate | 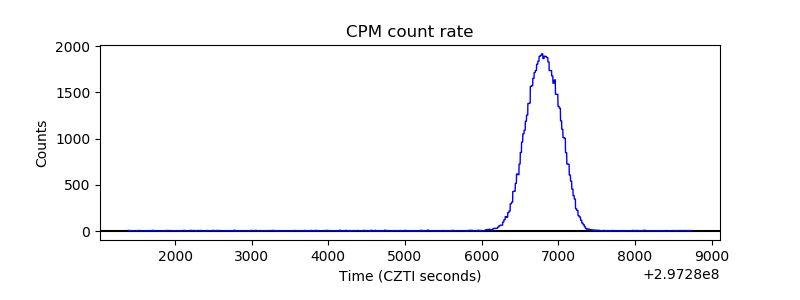 |
| CZT Counter | 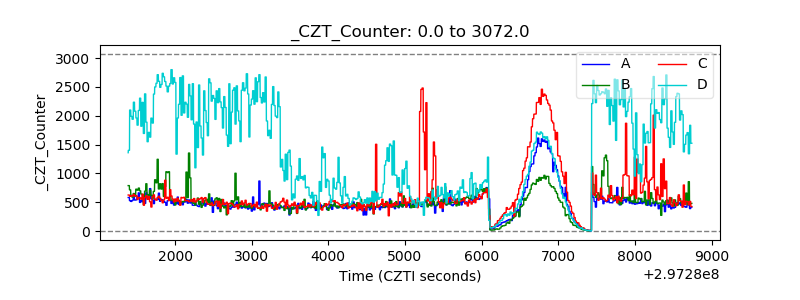 |
| +2.5 Volts monitor | 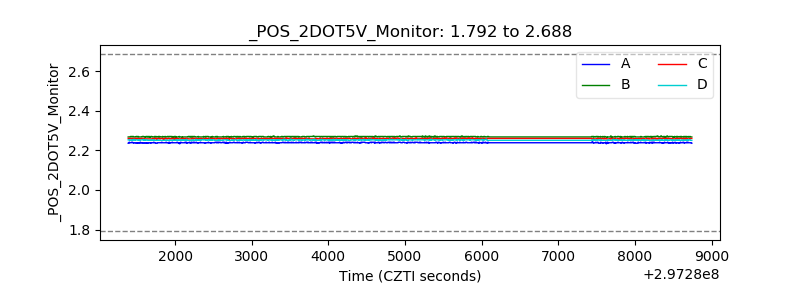 |
| +5 Volts monitor | 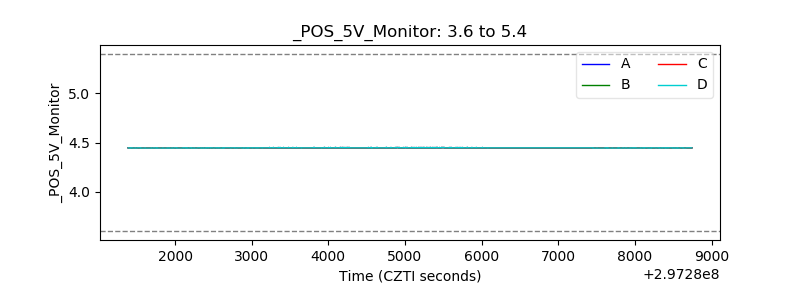 |
| _ROLL_ROT | 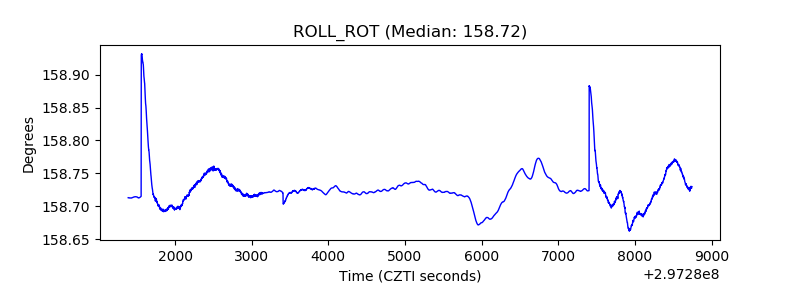 |
| _Roll_DEC | 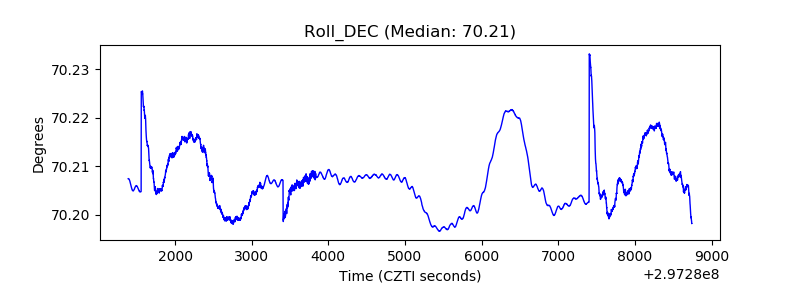 |
| _Roll_RA | 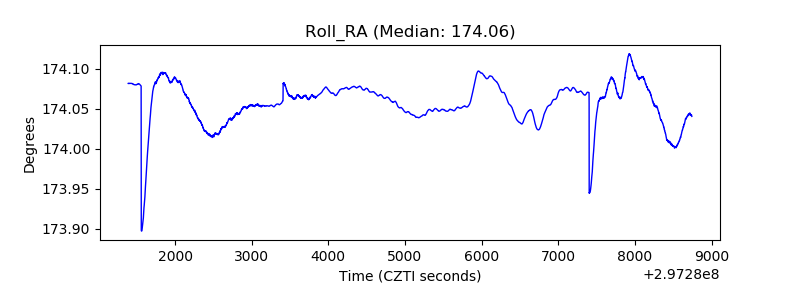 |
| Veto Counter | 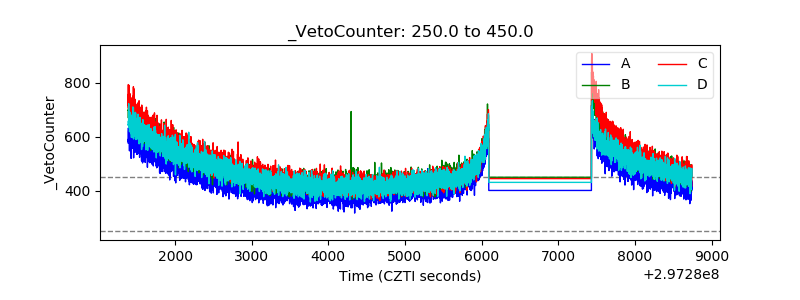 |