| Param | Original file | Final file |
|---|---|---|
| Filename | modeM0/AS1T03_191T01_9000003618_24685cztM0_level2.evt | modeM0/AS1T03_191T01_9000003618_24685cztM0_level2_quad_clean.evt |
| Size (bytes) | 709,015,680 | 140,952,960 |
| Size | 676.2 MB | 134.4 MB |
| Events in quadrant A | 3,528,324 | 975,411 |
| Events in quadrant B | 3,668,015 | 981,449 |
| Events in quadrant C | 3,610,091 | 928,645 |
| Events in quadrant D | 10,150,107 | 852,312 |
| Mode M9 | |||
|---|---|---|---|
| Quadrant | BADHDUFLAG | Total packets | Discarded packets |
| A | 0 | 4 | 0 |
| B | 0 | 5 | 0 |
| C | 0 | 5 | 0 |
| D | 0 | 5 | 0 |
| Mode M0 | |||
|---|---|---|---|
| Quadrant | BADHDUFLAG | Total packets | Discarded packets |
| A | 0 | 15701 | 2 |
| B | 0 | 15999 | 2 |
| C | 0 | 15715 | 2 |
| D | 0 | 35373 | 2 |
| Mode SS | |||
|---|---|---|---|
| Quadrant | BADHDUFLAG | Total packets | Discarded packets |
| A | 0 | 154 | 0 |
| B | 0 | 154 | 0 |
| C | 0 | 154 | 0 |
| D | 0 | 154 | 0 |
| Quadrant | Total seconds | Saturated seconds | Saturation percentage |
|---|---|---|---|
| A | 7635 | 84 | 1.100196% |
| B | 7635 | 94 | 1.231172% |
| C | 7635 | 112 | 1.466929% |
| D | 7635 | 1354 | 17.734119% |
Noise dominated data is calculated using 1-second bins in cleaned event files. If a bin has >2000 counts, and if more than 50% of those come from <1% of pixels, then it is considered to be noise-dominated and hence unusable.
| Quadrant | # 1 sec bins | Bins with >0 counts | Bins with >2000 counts | High rate bins dominated by noise | Noise dominated (total time) | Noise dominated (detector-on time) | Marked lightcurve |
|---|---|---|---|---|---|---|---|
| A | 7955 | 7635 | 1 | 1 | 0.01% | 0.01% | 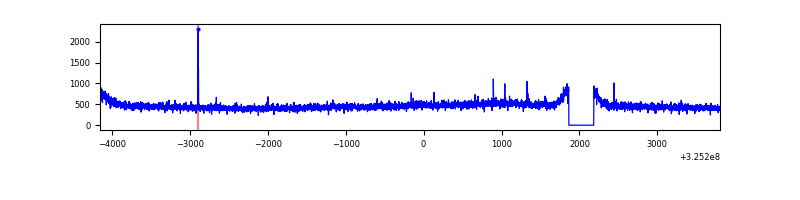 |
| B | 7955 | 7635 | 0 | 0 | 0.00% | 0.00% | 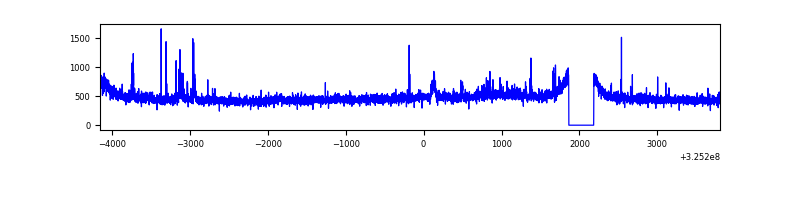 |
| C | 7955 | 7635 | 1 | 1 | 0.01% | 0.01% | 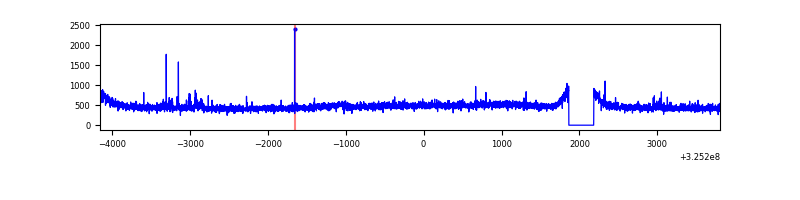 |
| D | 7955 | 7635 | 1289 | 1289 | 16.20% | 16.88% | 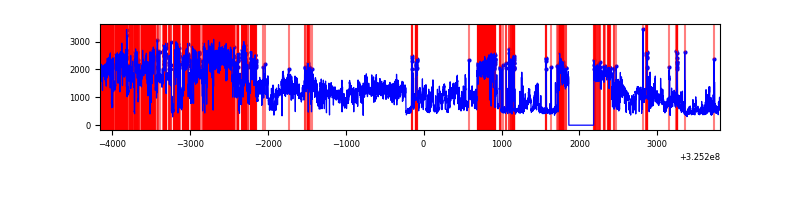 |
Top three noisy pixels from each quadrant. If the there are fewer than three noisy pixels in the level2.evt file, extra rows are filled as -1
| Pixel properties | Quadrant properties | ||||||
|---|---|---|---|---|---|---|---|
| Quadrant | DetID | PixID | Counts | Sigma | Mean | Median | Sigma |
| A | 13 | 254 | 11559 | 57.79 | 910 | 887 | 184.7 |
| A | 4 | 2 | 11305 | 56.41 | 910 | 887 | 184.7 |
| A | 3 | 137 | 8365 | 40.49 | 910 | 887 | 184.7 |
| B | 3 | 64 | 50819 | 286.94 | 904 | 878 | 174.0 |
| B | 0 | 189 | 34267 | 191.84 | 904 | 878 | 174.0 |
| B | 0 | 190 | 28802 | 160.44 | 904 | 878 | 174.0 |
| C | 14 | 238 | 137782 | 683.72 | 862 | 866 | 200.3 |
| C | 2 | 16 | 30368 | 147.32 | 862 | 866 | 200.3 |
| C | 10 | 91 | 24630 | 118.67 | 862 | 866 | 200.3 |
| D | 1 | 52 | 6678023 | 32560.23 | 839 | 811 | 205.1 |
| D | 8 | 195 | 128625 | 623.26 | 839 | 811 | 205.1 |
| D | 7 | 238 | 123325 | 597.42 | 839 | 811 | 205.1 |
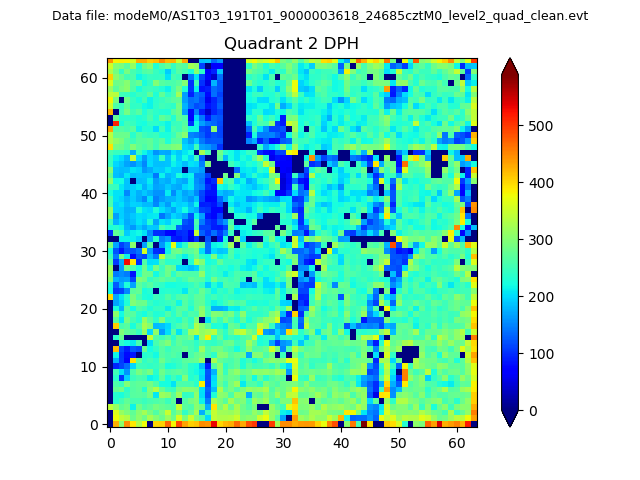
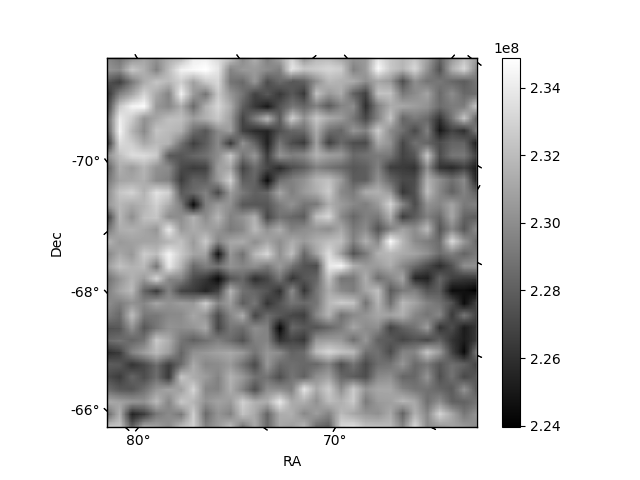
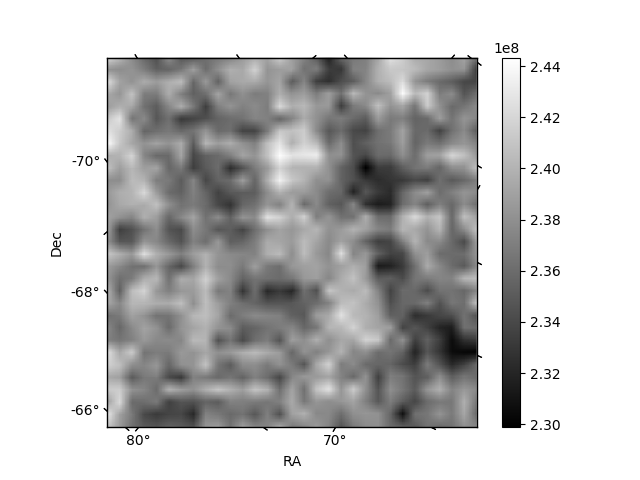
Histogram calculated using DETX and DETY for each event in the final _common_clean file
| Quadrant A | 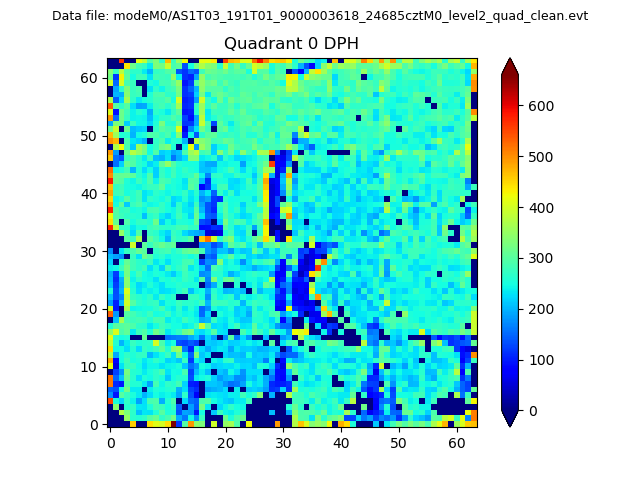 |
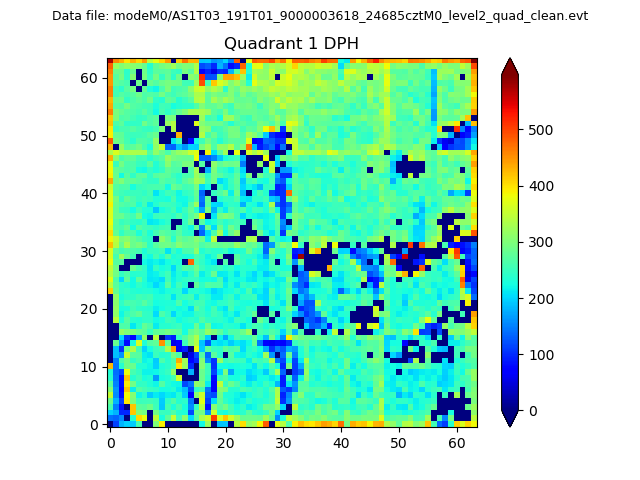 |
Quadrant B |
|---|---|---|---|
| Quadrant D | 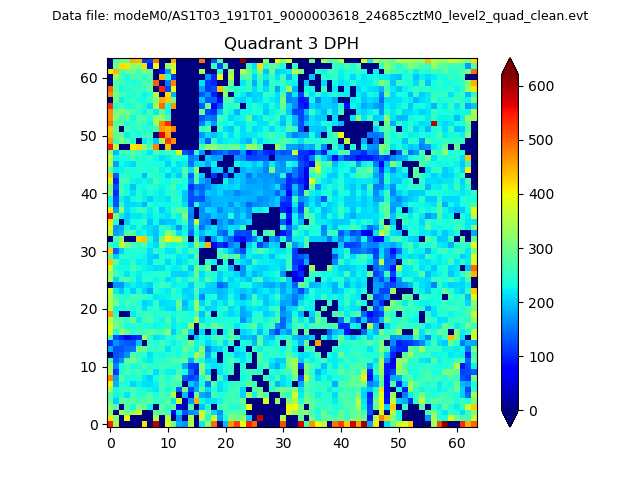 |
 |
Quadrant C |
| Plot type | Count rate plots | Images |
|---|---|---|
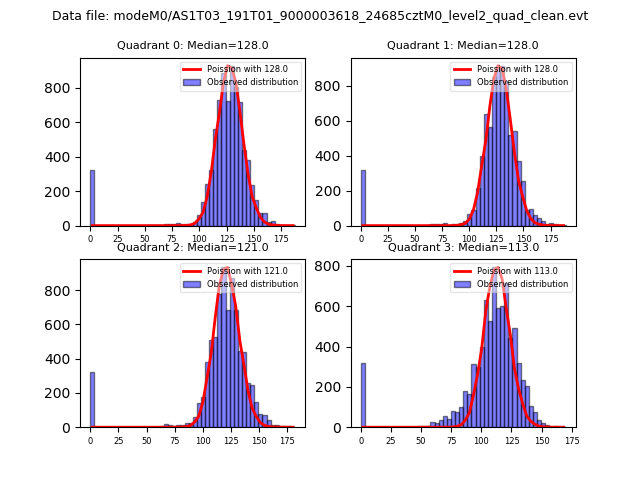
| Comparison with Poisson distribution Blue bars denote a histogram of data divided into 1 sec bins. Red curve is a Poisson curve with rate = median count rate of data. |
 |
 |
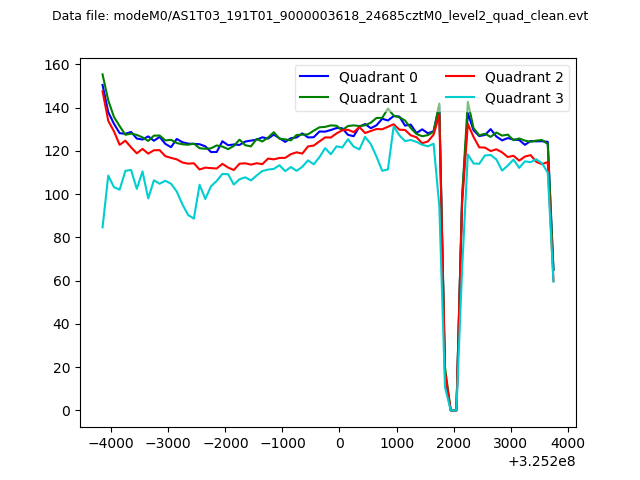
| Quadrant-wise count rates Data is divided into 100 sec bins |
 |
|
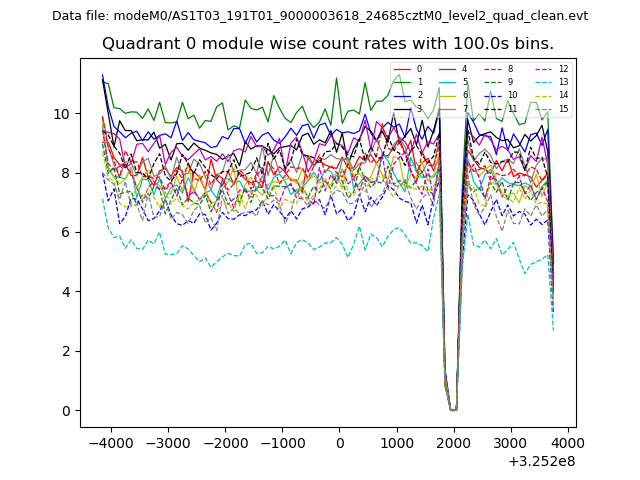
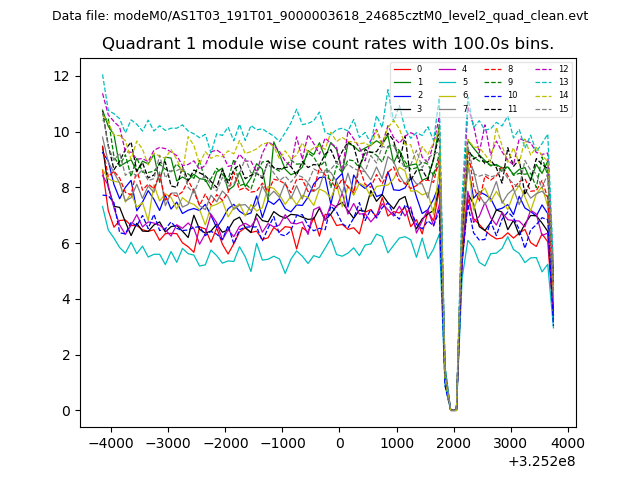
| Module-wise count rates for Quadrant A Data is divided into 100 sec bins |
 |
 |
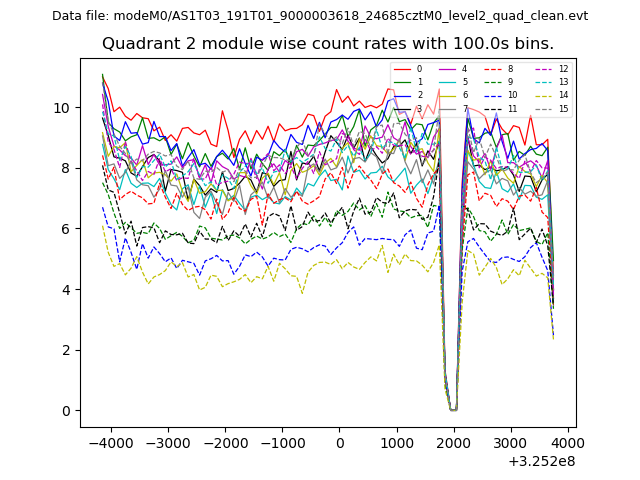
| Module-wise count rates for Quadrant B Data is divided into 100 sec bins |
 |
 |
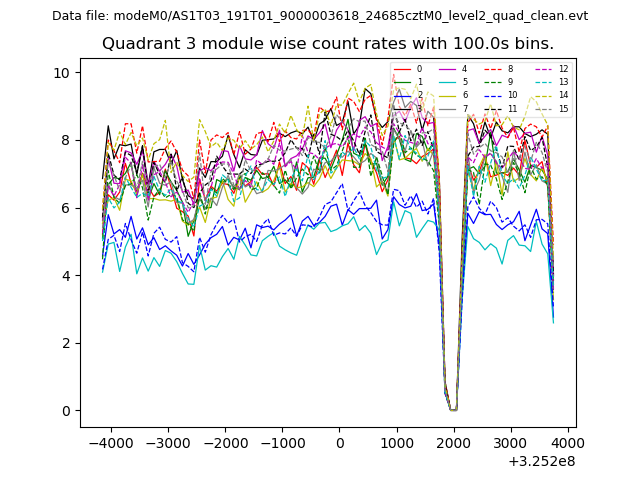
| Module-wise count rates for Quadrant C Data is divided into 100 sec bins |
 |
 |
| Module-wise count rates for Quadrant D Data is divided into 100 sec bins |
 |
 |
| Parameter | Plot |
|---|---|
| CZT HV Monitor | 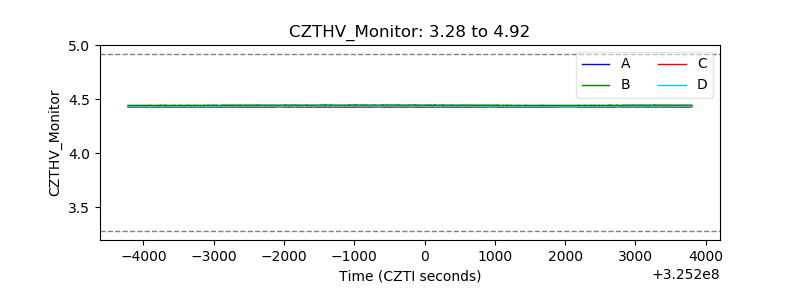 |
| D_VDD | 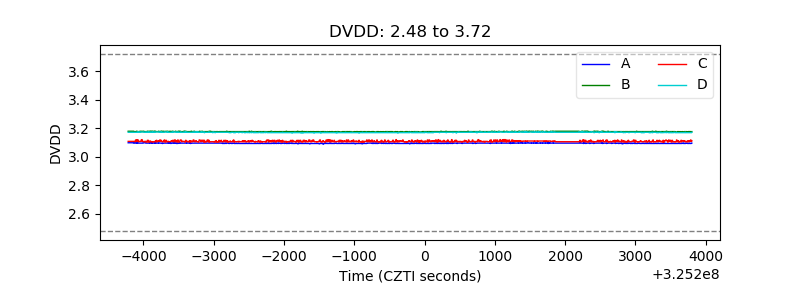 |
| Temperature 1 | 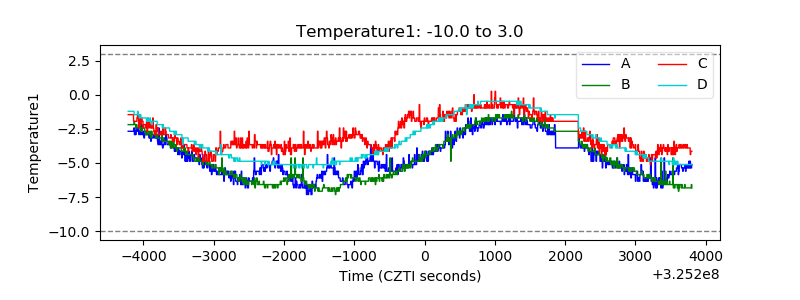 |
| Veto HV Monitor | 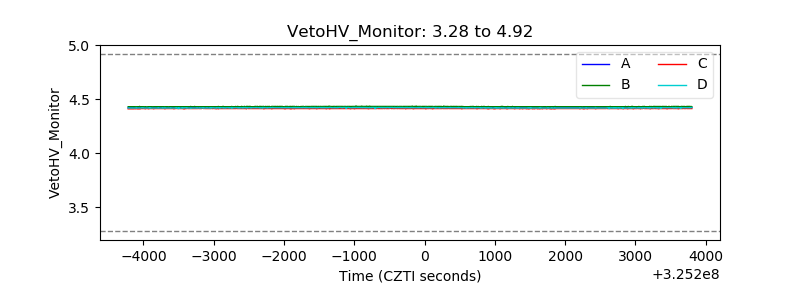 |
| Veto LLD | 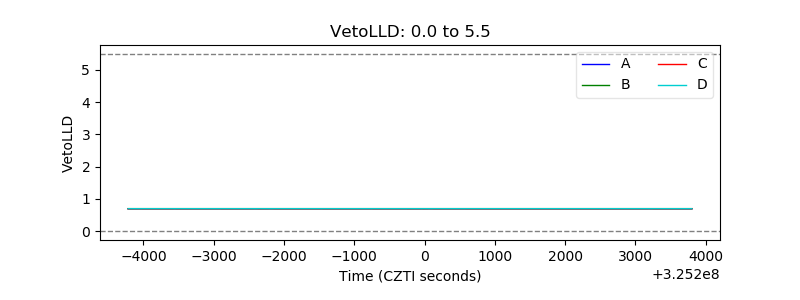 |
| Alpha Counter | 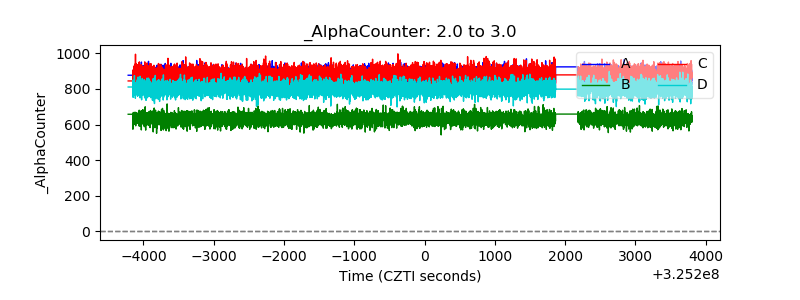 |
| _CPM_Rate | 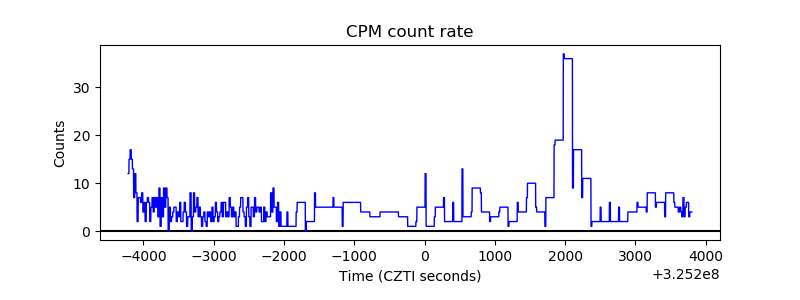 |
| CZT Counter | 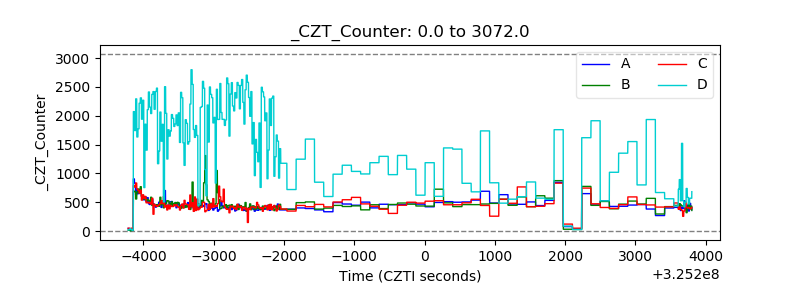 |
| +2.5 Volts monitor |  |
| +5 Volts monitor | 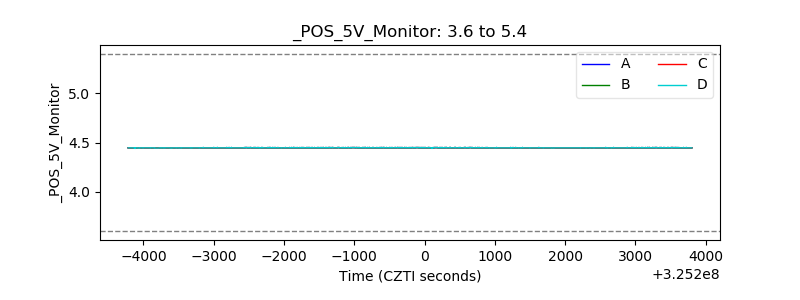 |
| _ROLL_ROT | 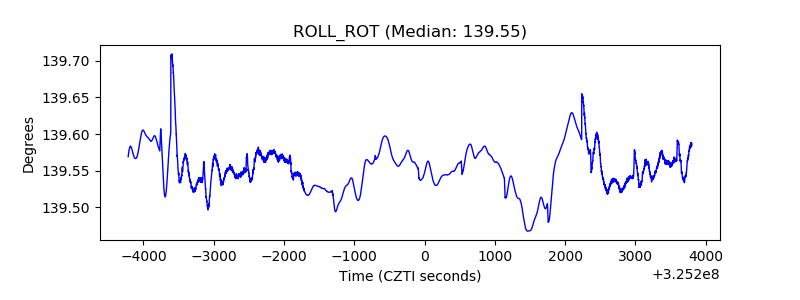 |
| _Roll_DEC | 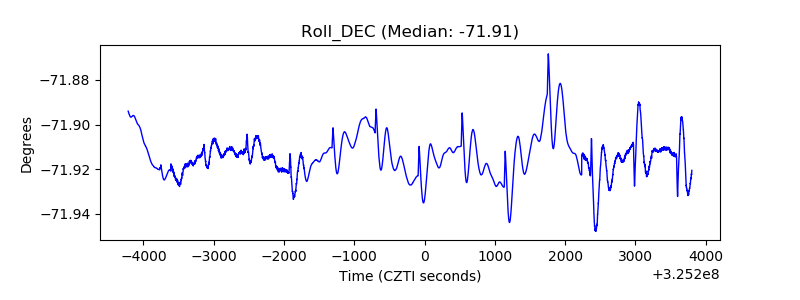 |
| _Roll_RA | 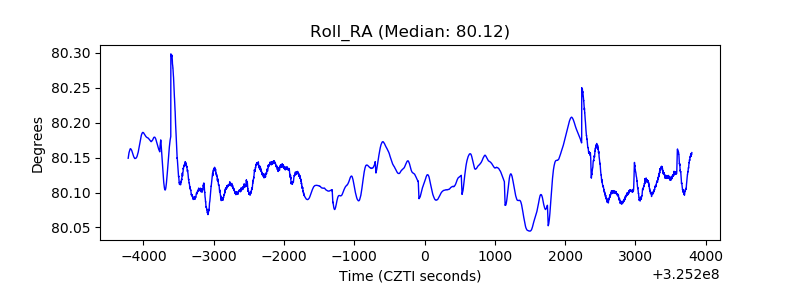 |
| Veto Counter | 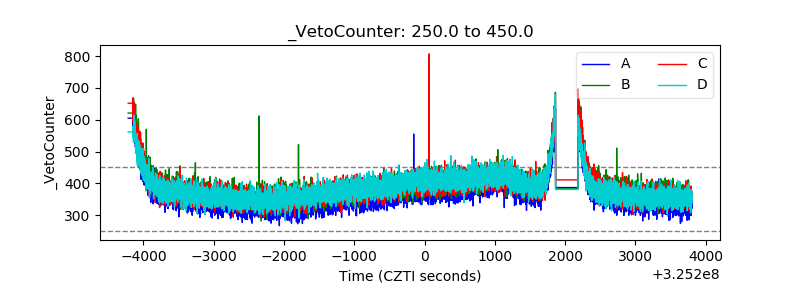 |