| Param | Original file | Final file |
|---|---|---|
| Filename | modeM0/AS1A08_003T09_9000003644_24890cztM0_level2.evt | modeM0/AS1A08_003T09_9000003644_24890cztM0_level2_quad_clean.evt |
| Size (bytes) | 869,541,120 | 162,374,400 |
| Size | 829.3 MB | 154.9 MB |
| Events in quadrant A | 6,123,000 | 1,033,188 |
| Events in quadrant B | 5,981,104 | 1,047,601 |
| Events in quadrant C | 6,242,278 | 1,000,305 |
| Events in quadrant D | 7,146,350 | 977,523 |
| Mode M9 | |||
|---|---|---|---|
| Quadrant | BADHDUFLAG | Total packets | Discarded packets |
| A | 0 | 14 | 0 |
| B | 0 | 14 | 0 |
| C | 0 | 14 | 0 |
| D | 0 | 14 | 0 |
| Mode M0 | |||
|---|---|---|---|
| Quadrant | BADHDUFLAG | Total packets | Discarded packets |
| A | 0 | 26327 | 2 |
| B | 0 | 25687 | 2 |
| C | 0 | 26334 | 2 |
| D | 0 | 29606 | 2 |
| Mode SS | |||
|---|---|---|---|
| Quadrant | BADHDUFLAG | Total packets | Discarded packets |
| A | 0 | 252 | 0 |
| B | 0 | 252 | 0 |
| C | 0 | 252 | 0 |
| D | 0 | 252 | 0 |
| Quadrant | Total seconds | Saturated seconds | Saturation percentage |
|---|---|---|---|
| A | 12429 | 149 | 1.198809% |
| B | 12430 | 105 | 0.844730% |
| C | 12430 | 255 | 2.051488% |
| D | 12430 | 223 | 1.794047% |
Noise dominated data is calculated using 1-second bins in cleaned event files. If a bin has >2000 counts, and if more than 50% of those come from <1% of pixels, then it is considered to be noise-dominated and hence unusable.
| Quadrant | # 1 sec bins | Bins with >0 counts | Bins with >2000 counts | High rate bins dominated by noise | Noise dominated (total time) | Noise dominated (detector-on time) | Marked lightcurve |
|---|---|---|---|---|---|---|---|
| A | 13779 | 12431 | 45 | 45 | 0.33% | 0.36% | 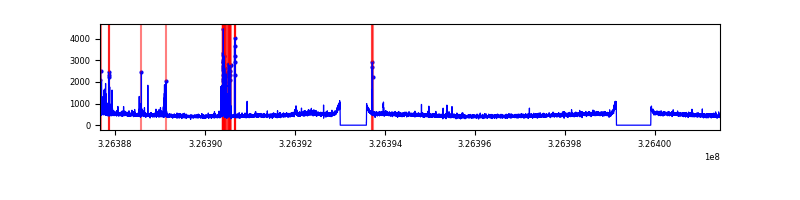 |
| B | 13780 | 12432 | 0 | 0 | 0.00% | 0.00% | 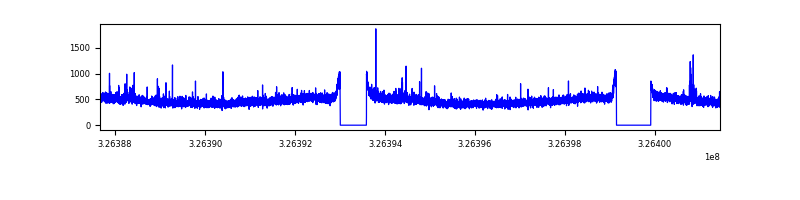 |
| C | 13780 | 12432 | 65 | 65 | 0.47% | 0.52% | 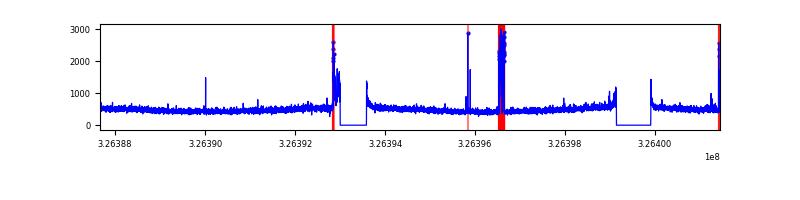 |
| D | 13780 | 12432 | 140 | 140 | 1.02% | 1.13% | 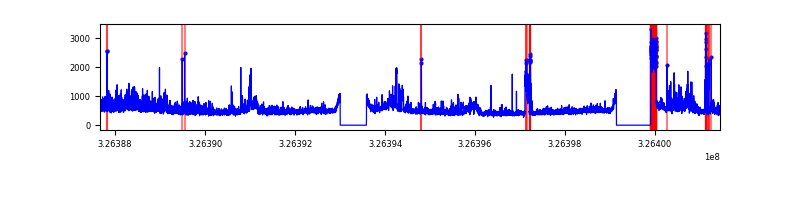 |
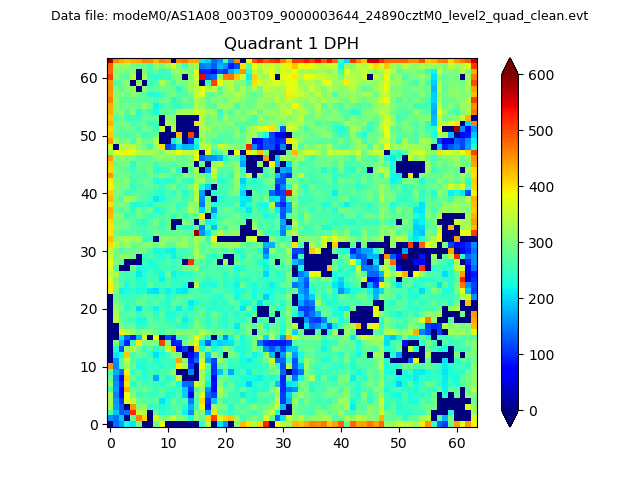
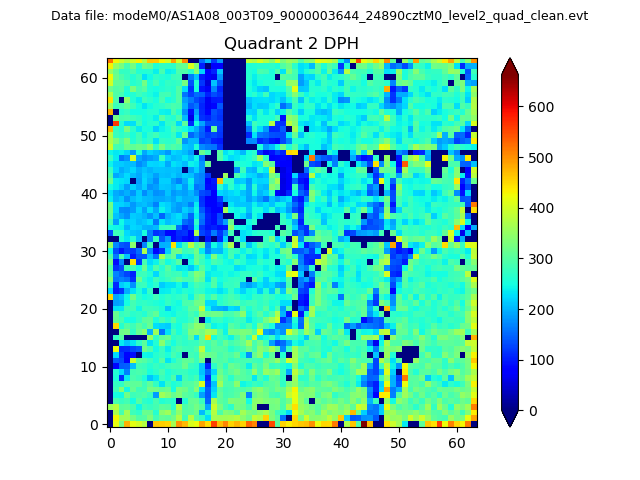
Top three noisy pixels from each quadrant. If the there are fewer than three noisy pixels in the level2.evt file, extra rows are filled as -1
| Pixel properties | Quadrant properties | ||||||
|---|---|---|---|---|---|---|---|
| Quadrant | DetID | PixID | Counts | Sigma | Mean | Median | Sigma |
| A | 6 | 16 | 272603 | 894.14 | 1507 | 1475 | 303.2 |
| A | 4 | 2 | 40958 | 130.21 | 1507 | 1475 | 303.2 |
| A | 13 | 254 | 18926 | 57.55 | 1507 | 1475 | 303.2 |
| B | 0 | 190 | 36428 | 121.15 | 1496 | 1453 | 288.7 |
| B | 12 | 111 | 36379 | 120.98 | 1496 | 1453 | 288.7 |
| B | 11 | 111 | 32873 | 108.84 | 1496 | 1453 | 288.7 |
| C | 14 | 238 | 229233 | 669.75 | 1447 | 1457 | 340.1 |
| C | 2 | 16 | 193654 | 565.13 | 1447 | 1457 | 340.1 |
| C | 7 | 247 | 155983 | 454.37 | 1447 | 1457 | 340.1 |
| D | 7 | 238 | 599340 | 1675.5 | 1463 | 1420 | 356.9 |
| D | 8 | 195 | 528905 | 1478.13 | 1463 | 1420 | 356.9 |
| D | 1 | 52 | 450106 | 1257.31 | 1463 | 1420 | 356.9 |
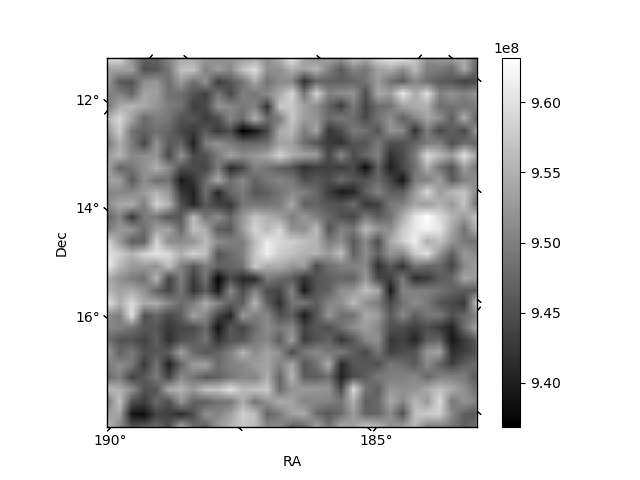
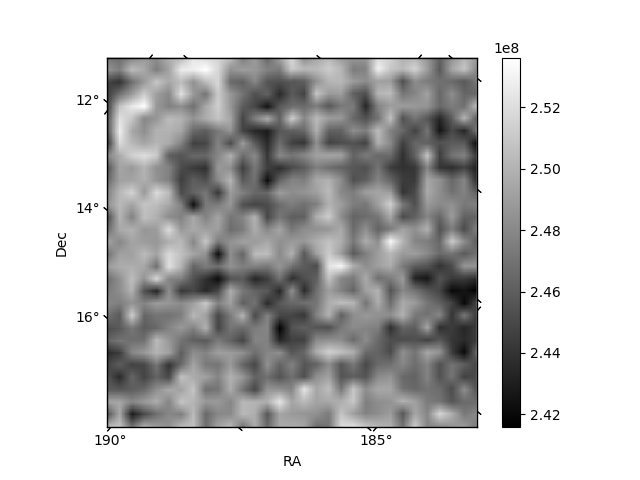
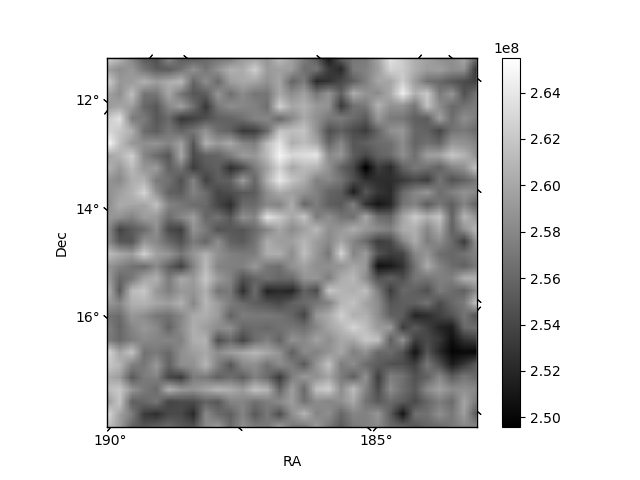
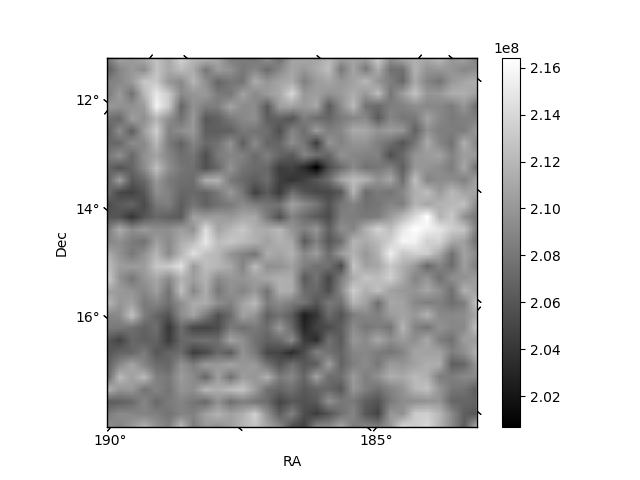
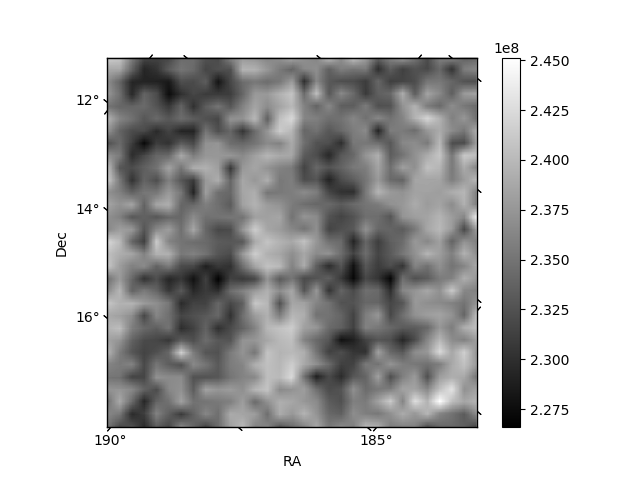
Histogram calculated using DETX and DETY for each event in the final _common_clean file
| Quadrant A | 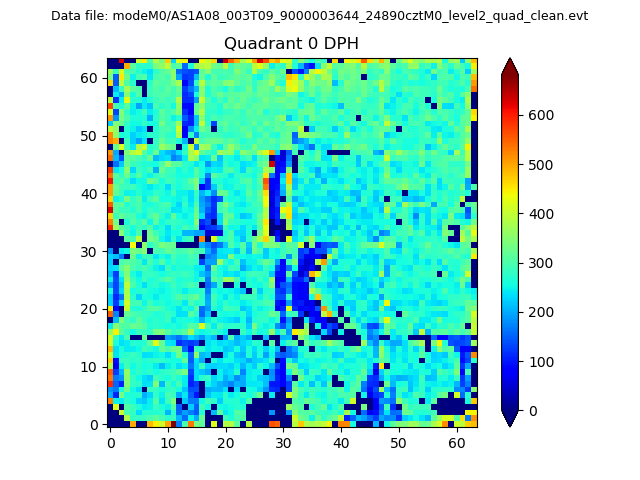 |
 |
Quadrant B |
|---|---|---|---|
| Quadrant D | 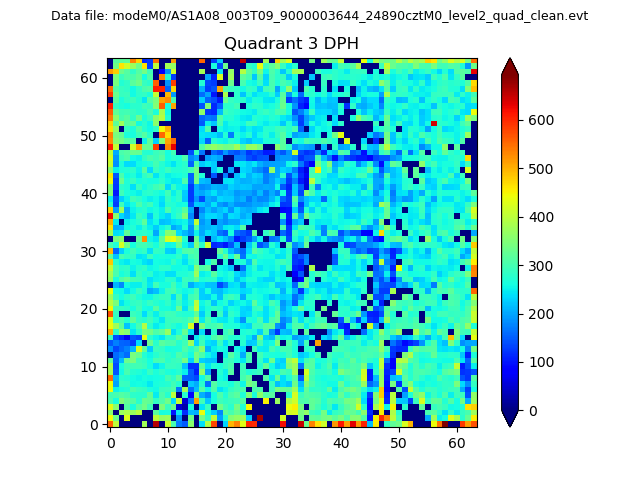 |
 |
Quadrant C |
| Plot type | Count rate plots | Images |
|---|---|---|
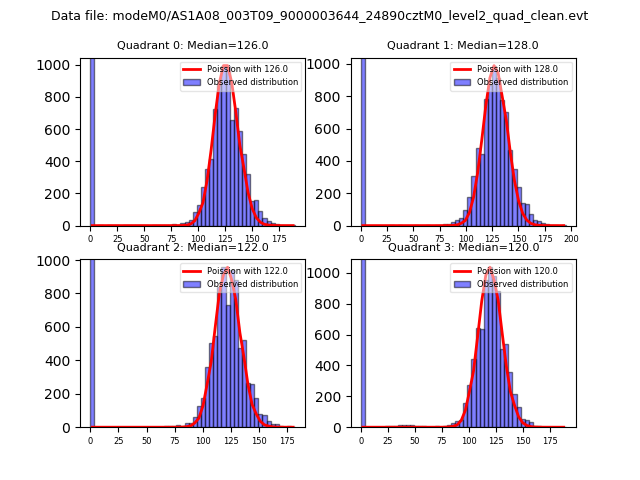
| Comparison with Poisson distribution Blue bars denote a histogram of data divided into 1 sec bins. Red curve is a Poisson curve with rate = median count rate of data. |
 |
 |
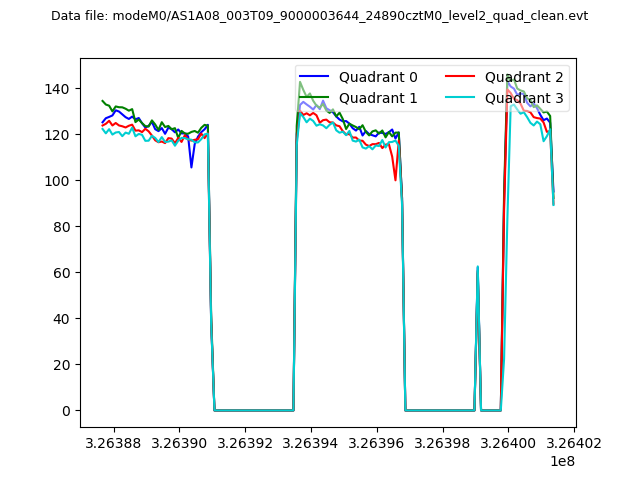
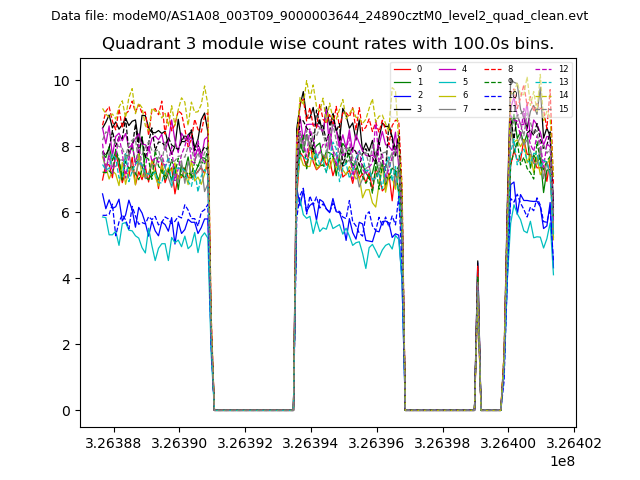
| Quadrant-wise count rates Data is divided into 100 sec bins |
 |
|
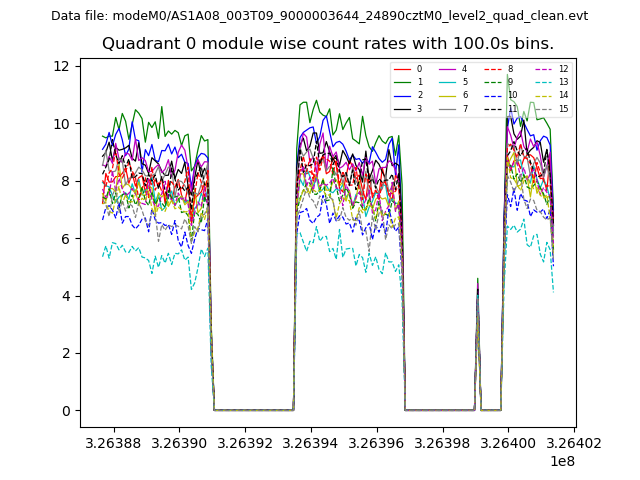
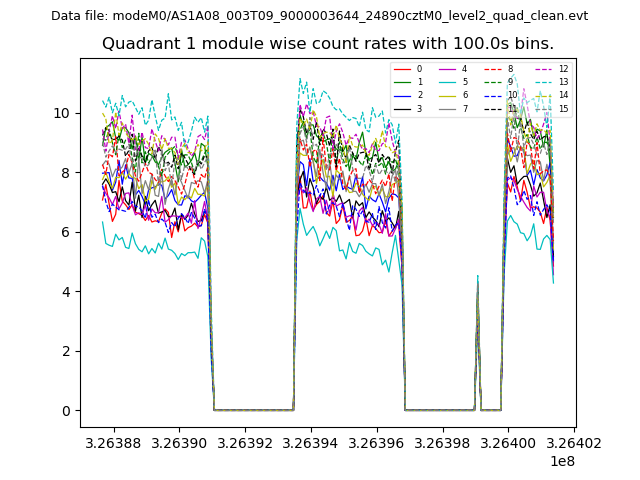
| Module-wise count rates for Quadrant A Data is divided into 100 sec bins |
 |
 |
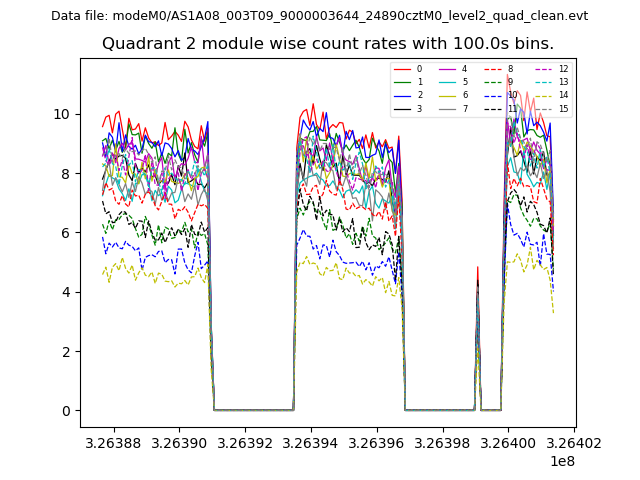
| Module-wise count rates for Quadrant B Data is divided into 100 sec bins |
 |
 |
| Module-wise count rates for Quadrant C Data is divided into 100 sec bins |
 |
 |
| Module-wise count rates for Quadrant D Data is divided into 100 sec bins |
 |
 |
| Parameter | Plot |
|---|---|
| CZT HV Monitor | 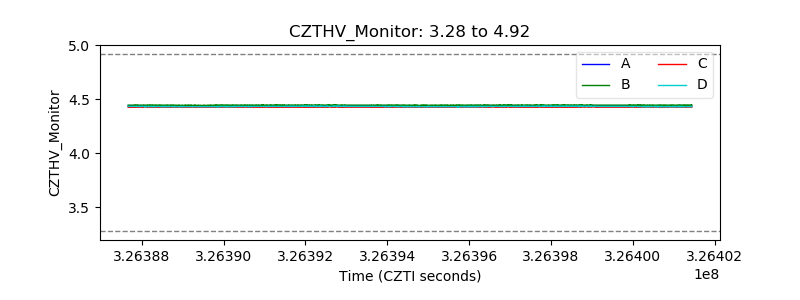 |
| D_VDD | 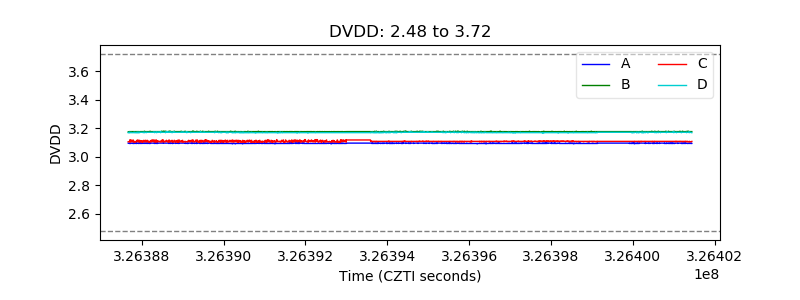 |
| Temperature 1 | 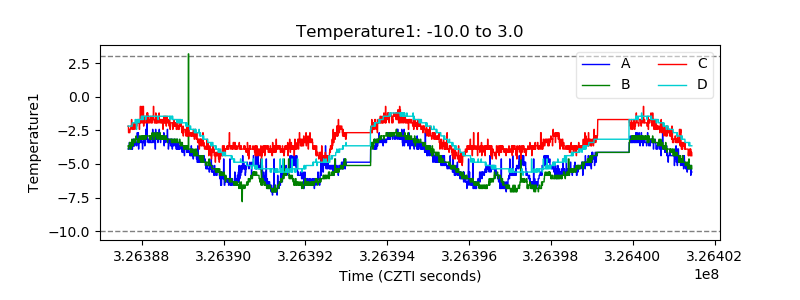 |
| Veto HV Monitor | 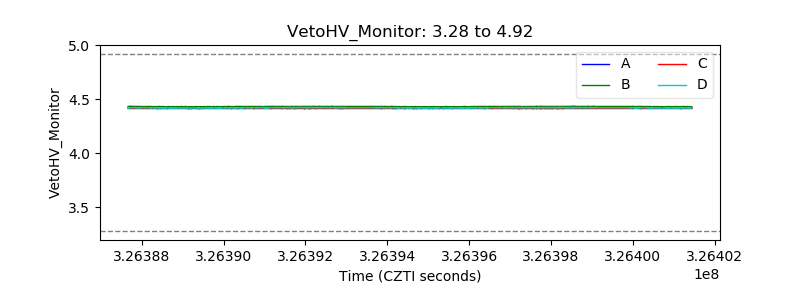 |
| Veto LLD | 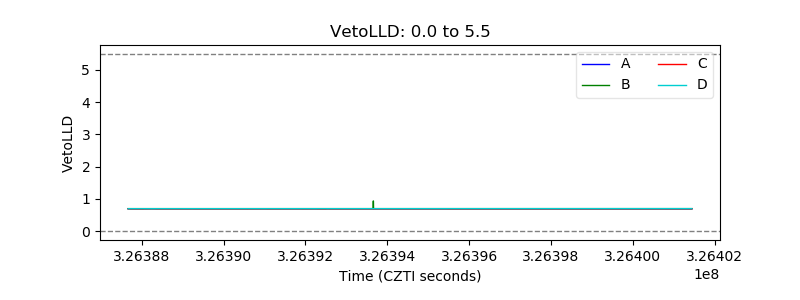 |
| Alpha Counter | 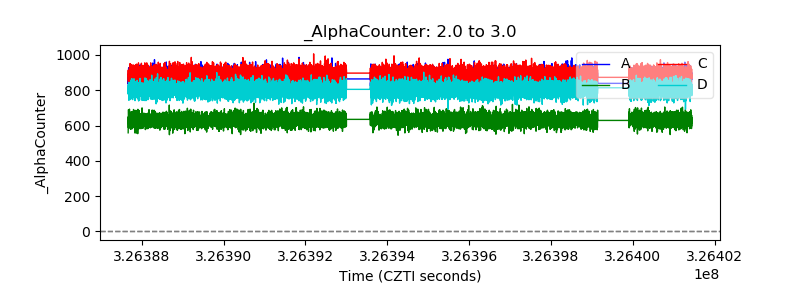 |
| _CPM_Rate | 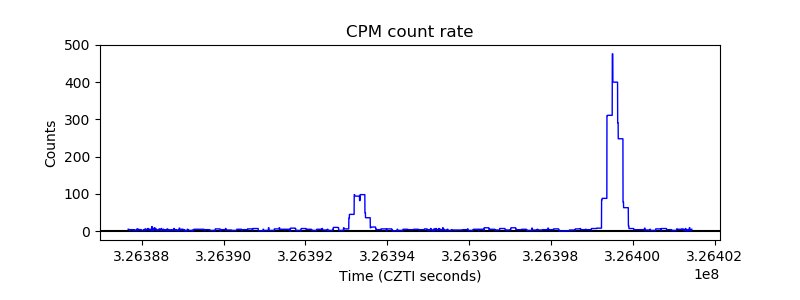 |
| CZT Counter | 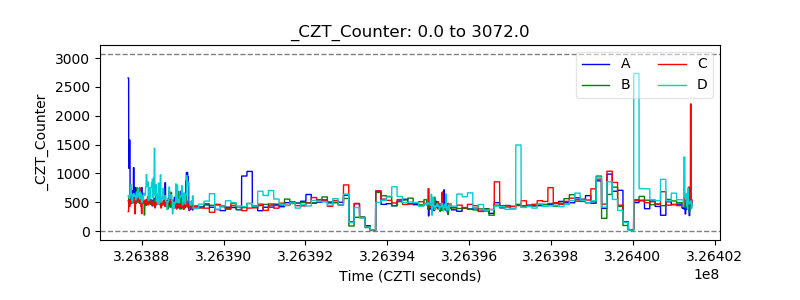 |
| +2.5 Volts monitor | 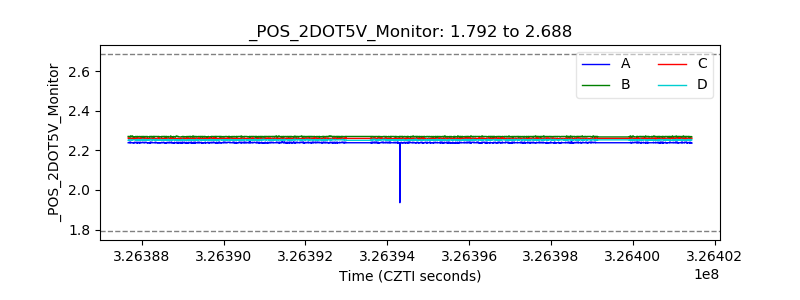 |
| +5 Volts monitor | 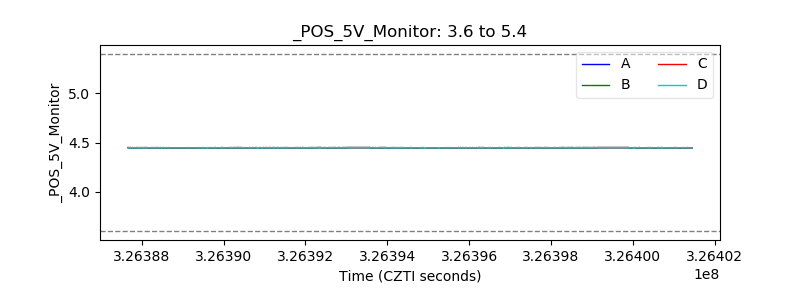 |
| _ROLL_ROT | 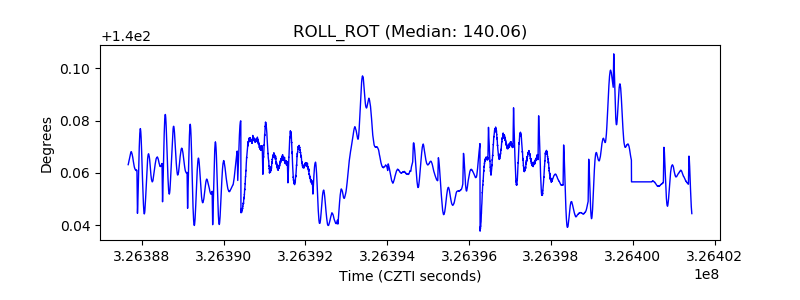 |
| _Roll_DEC | 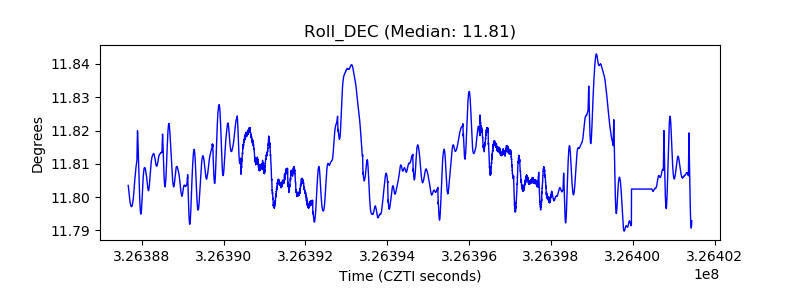 |
| _Roll_RA | 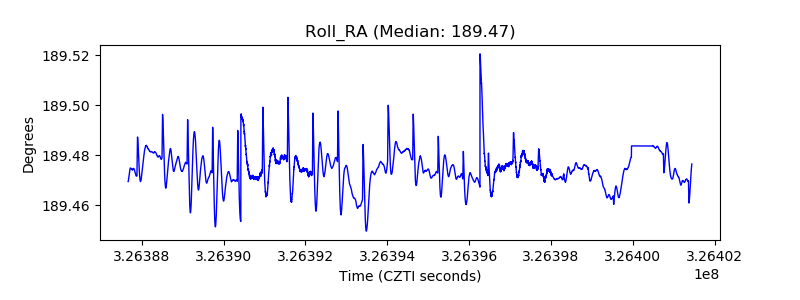 |
| Veto Counter | 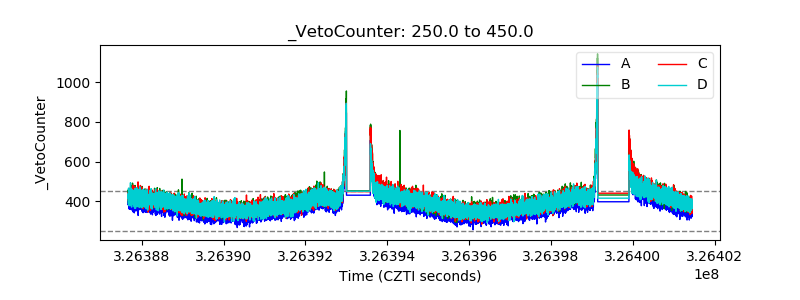 |