| Param | Original file | Final file |
|---|---|---|
| Filename | modeM0/AS1A09_027T02_9000003696_25274cztM0_level2.evt | modeM0/AS1A09_027T02_9000003696_25274cztM0_level2_quad_clean.evt |
| Size (bytes) | 1,355,137,920 | 282,372,480 |
| Size | 1.3 GB | 269.3 MB |
| Events in quadrant A | 7,921,289 | 1,936,635 |
| Events in quadrant B | 9,227,558 | 1,915,280 |
| Events in quadrant C | 8,280,169 | 1,847,476 |
| Events in quadrant D | 14,555,555 | 1,772,691 |
| Mode M0 | |||
|---|---|---|---|
| Quadrant | BADHDUFLAG | Total packets | Discarded packets |
| A | 0 | 33275 | 0 |
| B | 0 | 37360 | 0 |
| C | 0 | 34097 | 0 |
| D | 0 | 54481 | 0 |
| Mode M9 | |||
|---|---|---|---|
| Quadrant | BADHDUFLAG | Total packets | Discarded packets |
| A | 0 | 40 | 0 |
| B | 0 | 40 | 0 |
| C | 0 | 40 | 0 |
| D | 0 | 40 | 0 |
| Quadrant | Total seconds | Saturated seconds | Saturation percentage |
|---|---|---|---|
| A | 15677 | 174 | 1.109906% |
| B | 15678 | 539 | 3.437939% |
| C | 15678 | 286 | 1.824212% |
| D | 15678 | 708 | 4.515882% |
Noise dominated data is calculated using 1-second bins in cleaned event files. If a bin has >2000 counts, and if more than 50% of those come from <1% of pixels, then it is considered to be noise-dominated and hence unusable.
| Quadrant | # 1 sec bins | Bins with >0 counts | Bins with >2000 counts | High rate bins dominated by noise | Noise dominated (total time) | Noise dominated (detector-on time) | Marked lightcurve |
|---|---|---|---|---|---|---|---|
| A | 19612 | 15680 | 0 | 0 | 0.00% | 0.00% |  |
| B | 19613 | 15681 | 211 | 211 | 1.08% | 1.35% | 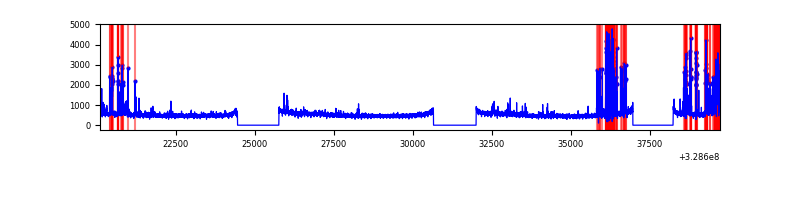 |
| C | 19613 | 15681 | 5 | 5 | 0.03% | 0.03% | 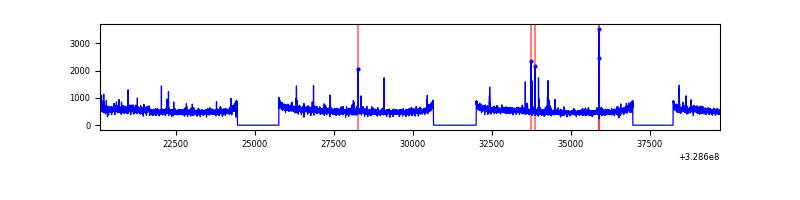 |
| D | 19613 | 15681 | 413 | 413 | 2.11% | 2.63% | 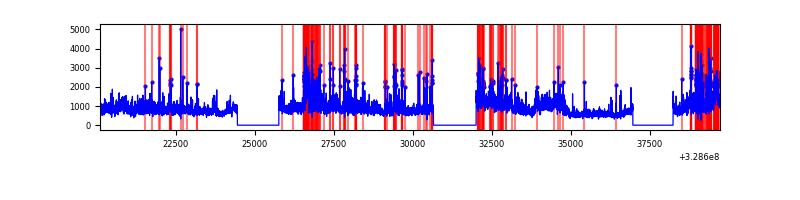 |
Top three noisy pixels from each quadrant. If the there are fewer than three noisy pixels in the level2.evt file, extra rows are filled as -1
| Pixel properties | Quadrant properties | ||||||
|---|---|---|---|---|---|---|---|
| Quadrant | DetID | PixID | Counts | Sigma | Mean | Median | Sigma |
| A | 3 | 1 | 54357 | 130.47 | 2041 | 2003 | 401.3 |
| A | 13 | 254 | 26074 | 59.99 | 2041 | 2003 | 401.3 |
| A | 0 | 226 | 18176 | 40.3 | 2041 | 2003 | 401.3 |
| B | 3 | 64 | 1208412 | 3352.9 | 1997 | 1954 | 359.8 |
| B | 0 | 190 | 75330 | 203.92 | 1997 | 1954 | 359.8 |
| B | 15 | 33 | 69638 | 188.1 | 1997 | 1954 | 359.8 |
| C | 14 | 238 | 317531 | 706.73 | 1964 | 1982 | 446.5 |
| C | 0 | 239 | 117361 | 258.41 | 1964 | 1982 | 446.5 |
| C | 0 | 207 | 95112 | 208.58 | 1964 | 1982 | 446.5 |
| D | 8 | 195 | 3944176 | 8496.72 | 1981 | 1931 | 464.0 |
| D | 1 | 52 | 2060109 | 4435.99 | 1981 | 1931 | 464.0 |
| D | 7 | 38 | 540986 | 1161.83 | 1981 | 1931 | 464.0 |
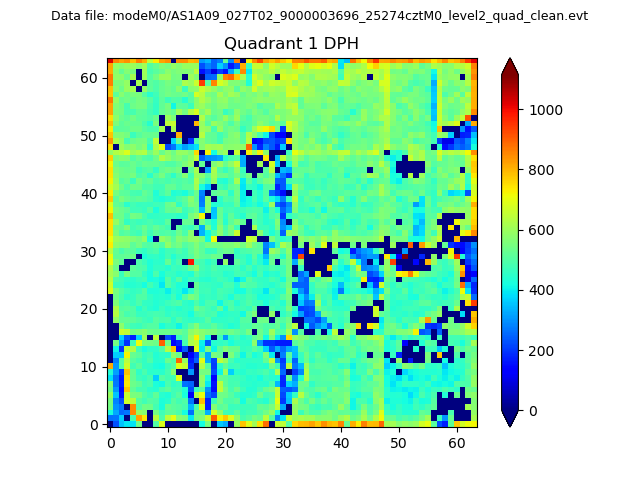
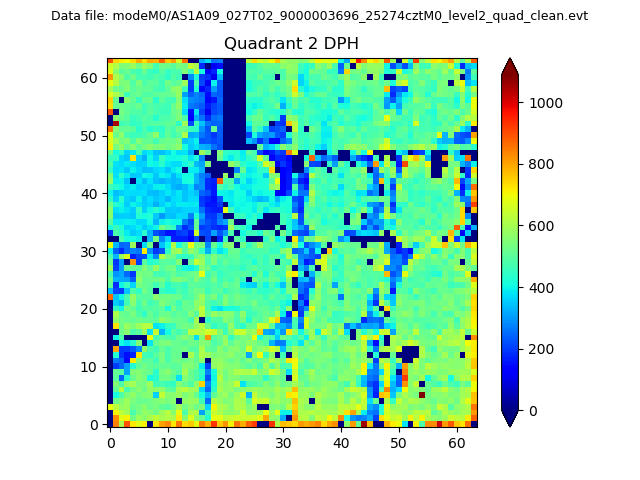
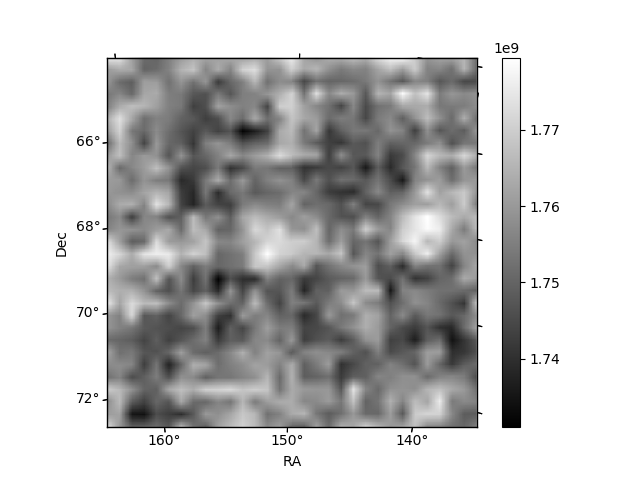
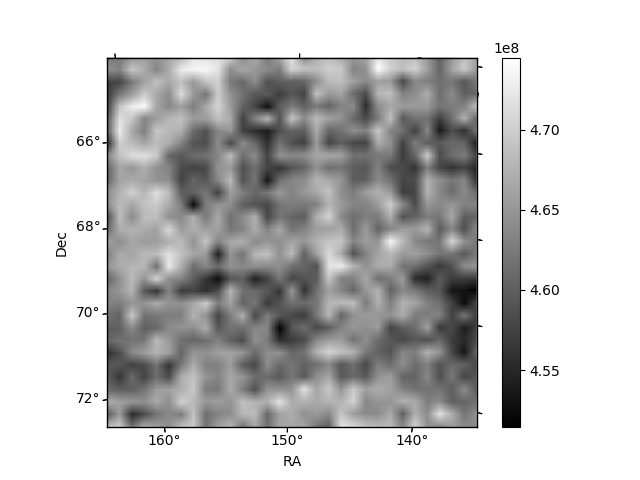
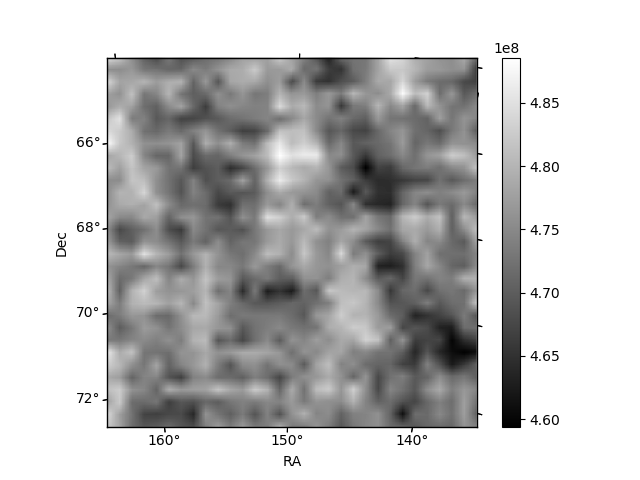
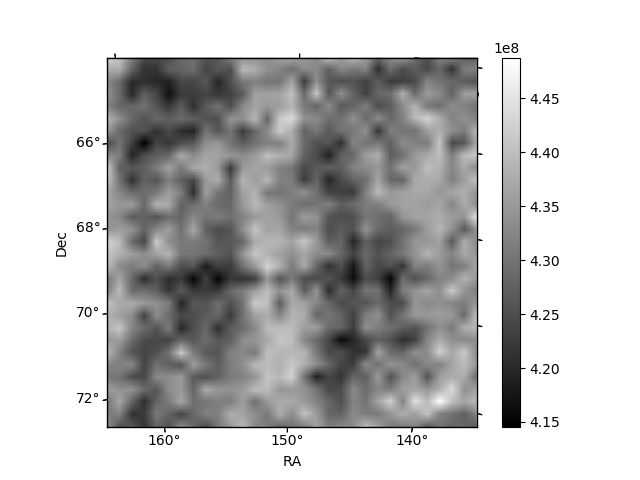
Histogram calculated using DETX and DETY for each event in the final _common_clean file
| Quadrant A | 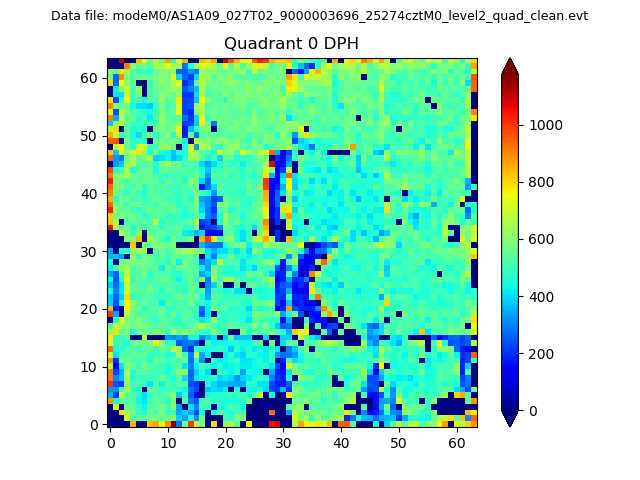 |
 |
Quadrant B |
|---|---|---|---|
| Quadrant D | 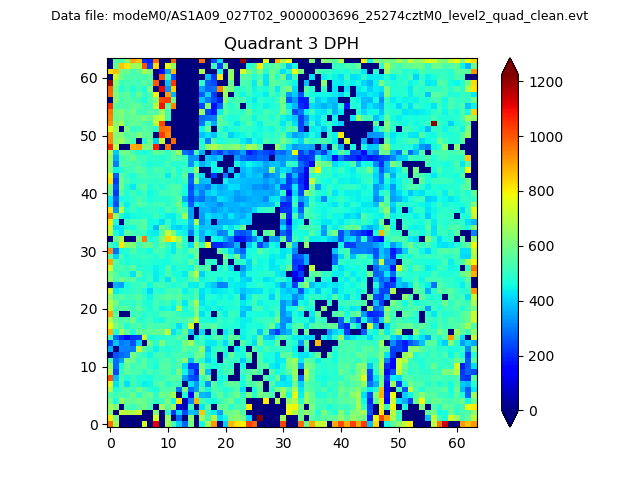 |
 |
Quadrant C |
| Plot type | Count rate plots | Images |
|---|---|---|
| Comparison with Poisson distribution Blue bars denote a histogram of data divided into 1 sec bins. Red curve is a Poisson curve with rate = median count rate of data. |
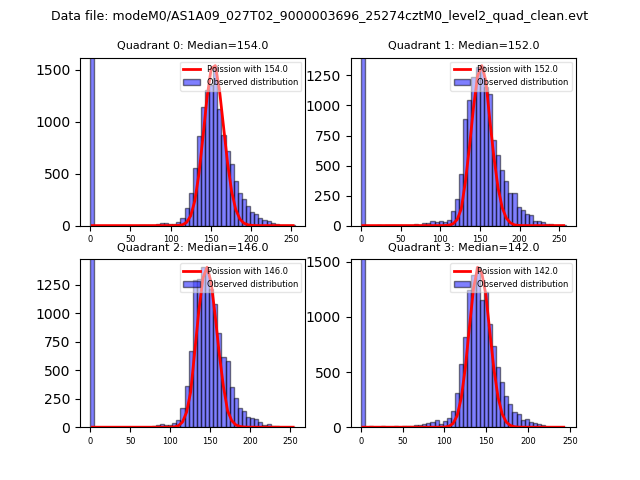 |
 |
| Quadrant-wise count rates Data is divided into 100 sec bins |
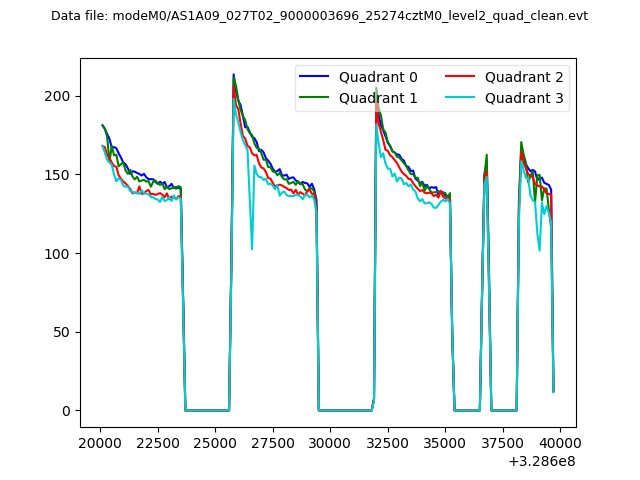 |
|
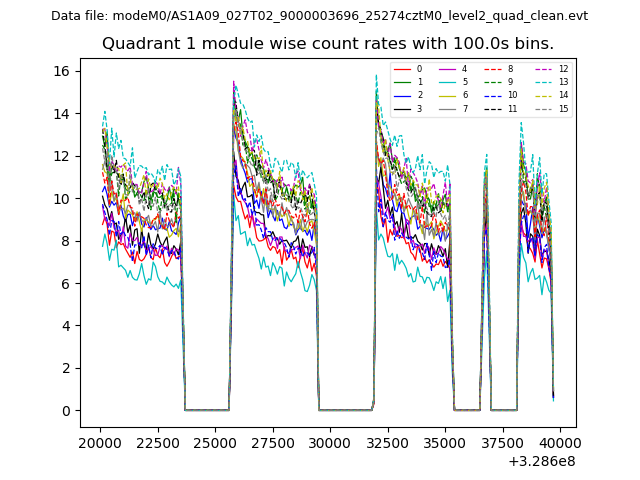
| Module-wise count rates for Quadrant A Data is divided into 100 sec bins |
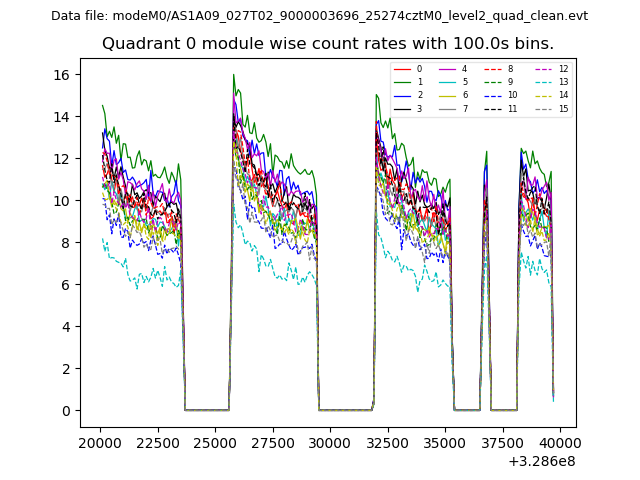 |
 |
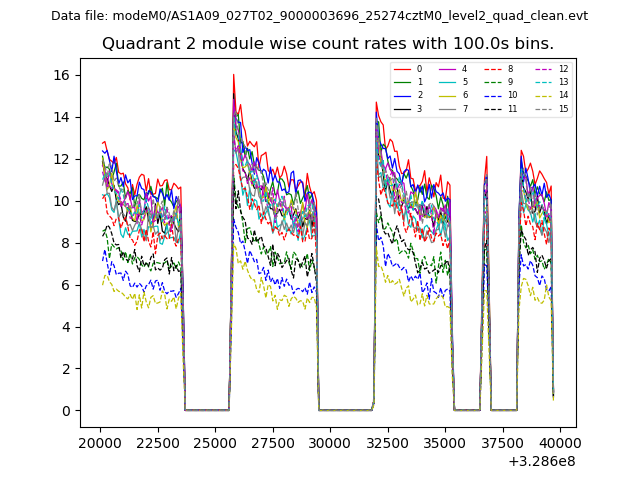
| Module-wise count rates for Quadrant B Data is divided into 100 sec bins |
 |
 |
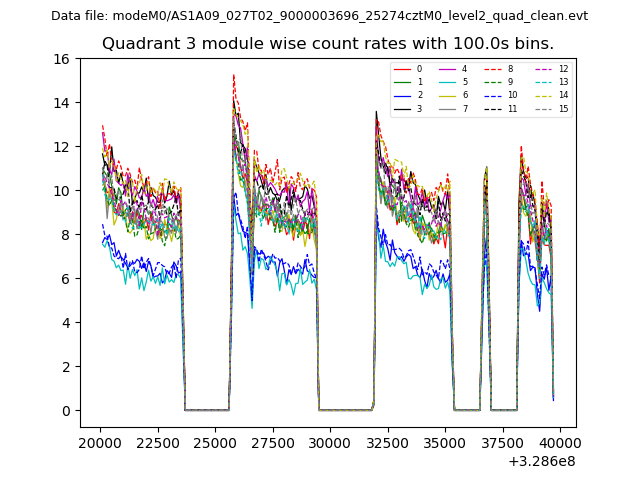
| Module-wise count rates for Quadrant C Data is divided into 100 sec bins |
 |
 |
| Module-wise count rates for Quadrant D Data is divided into 100 sec bins |
 |
 |
| Parameter | Plot |
|---|---|
| CZT HV Monitor | 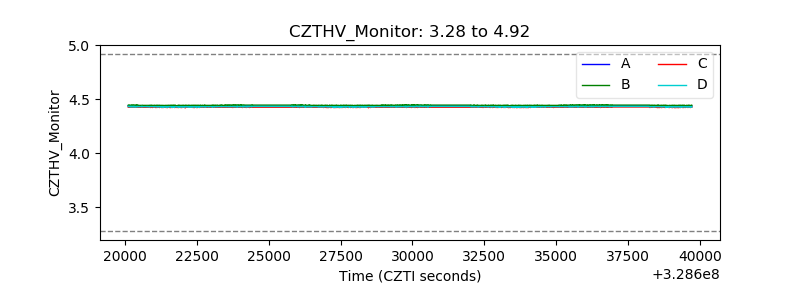 |
| D_VDD | 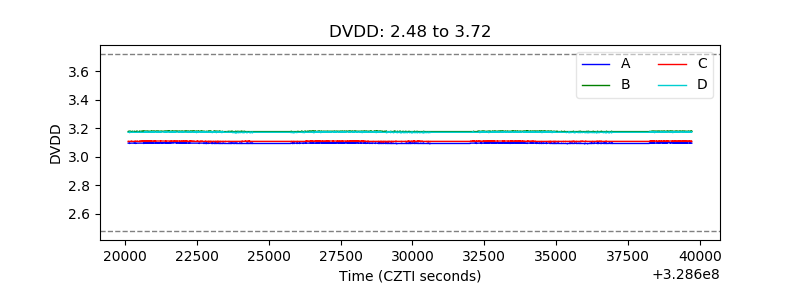 |
| Temperature 1 | 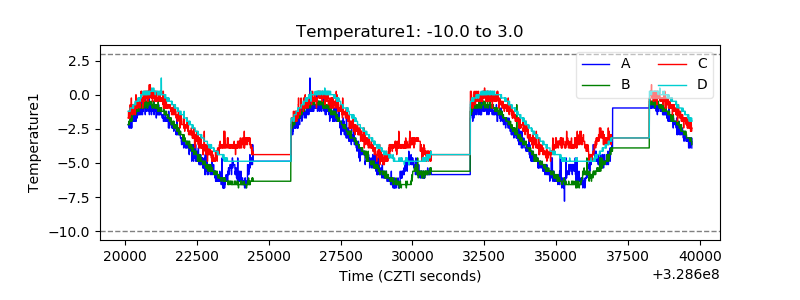 |
| Veto HV Monitor | 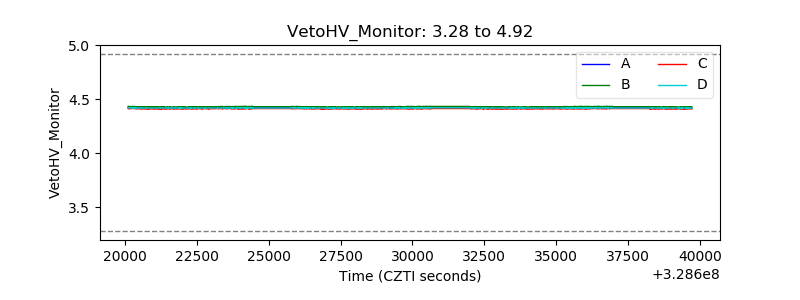 |
| Veto LLD | 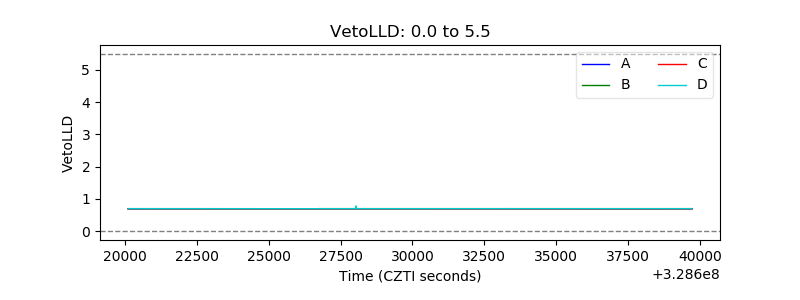 |
| Alpha Counter | 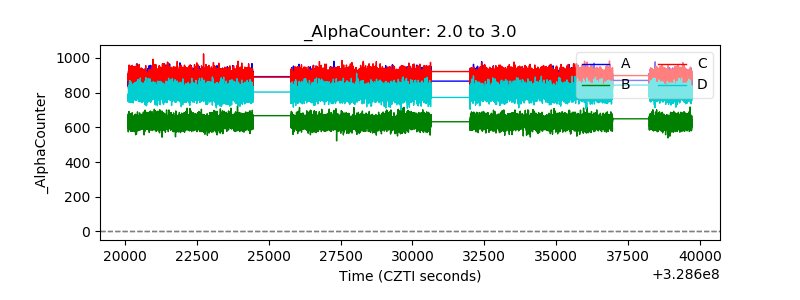 |
| _CPM_Rate | 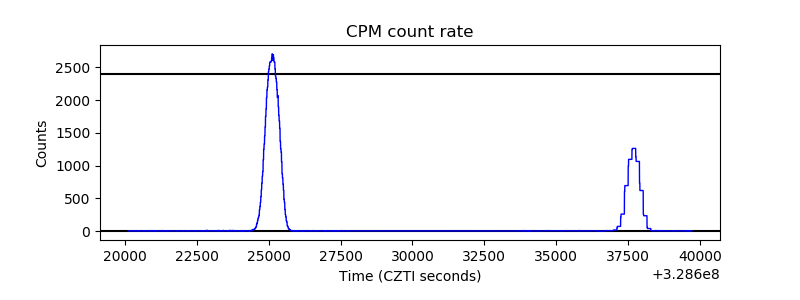 |
| CZT Counter | 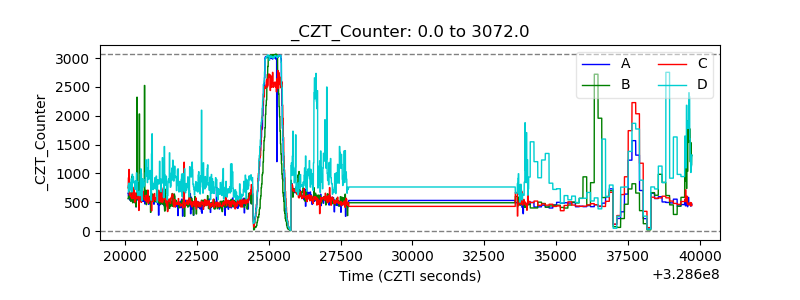 |
| +2.5 Volts monitor |  |
| +5 Volts monitor | 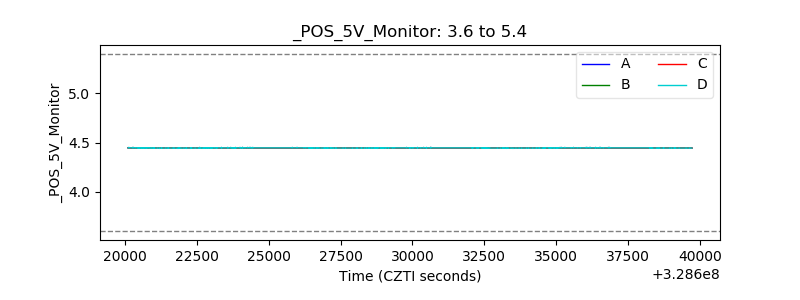 |
| _ROLL_ROT | 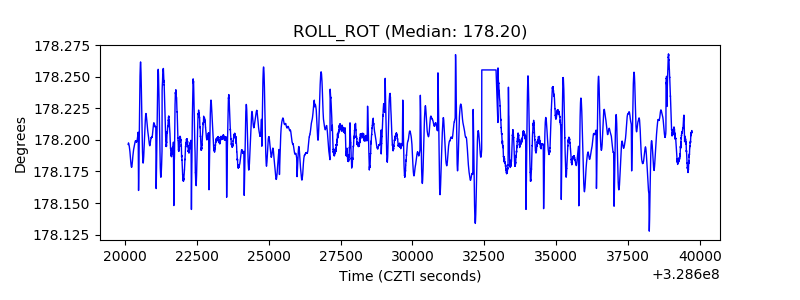 |
| _Roll_DEC | 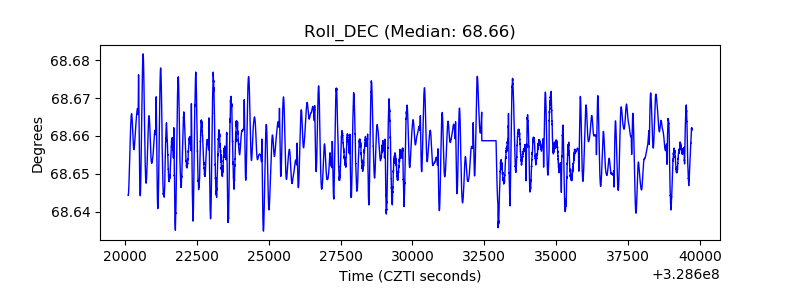 |
| _Roll_RA | 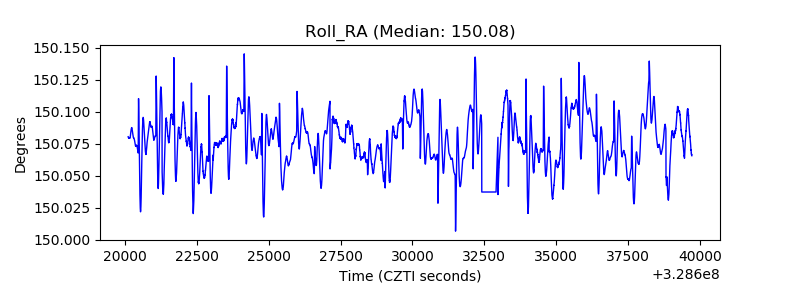 |
| Veto Counter | 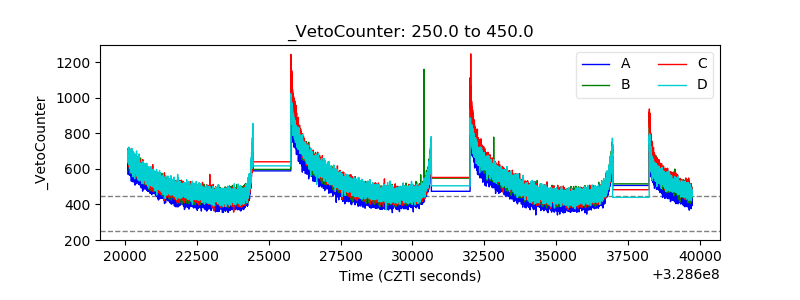 |