| Param | Original file | Final file |
|---|---|---|
| Filename | modeM0/AS1T03_243T01_9000003918_27175cztM0_level2.evt | modeM0/AS1T03_243T01_9000003918_27175cztM0_level2_quad_clean.evt |
| Size (bytes) | 623,482,560 | 68,172,480 |
| Size | 594.6 MB | 65.0 MB |
| Events in quadrant A | 7,691,106 | 353,465 |
| Events in quadrant B | 3,503,524 | 422,943 |
| Events in quadrant C | 3,241,056 | 411,822 |
| Events in quadrant D | 3,983,940 | 399,522 |
| Mode M9 | |||
|---|---|---|---|
| Quadrant | BADHDUFLAG | Total packets | Discarded packets |
| A | 0 | 3 | 0 |
| B | 0 | 3 | 0 |
| C | 0 | 3 | 0 |
| D | 0 | 3 | 0 |
| Mode M0 | |||
|---|---|---|---|
| Quadrant | BADHDUFLAG | Total packets | Discarded packets |
| A | 0 | 27397 | 0 |
| B | 0 | 14702 | 0 |
| C | 0 | 13994 | 0 |
| D | 0 | 16489 | 0 |
| Quadrant | Total seconds | Saturated seconds | Saturation percentage |
|---|---|---|---|
| A | 6820 | 1452 | 21.290323% |
| B | 6821 | 159 | 2.331037% |
| C | 6821 | 117 | 1.715291% |
| D | 6821 | 121 | 1.773933% |
Noise dominated data is calculated using 1-second bins in cleaned event files. If a bin has >2000 counts, and if more than 50% of those come from <1% of pixels, then it is considered to be noise-dominated and hence unusable.
| Quadrant | # 1 sec bins | Bins with >0 counts | Bins with >2000 counts | High rate bins dominated by noise | Noise dominated (total time) | Noise dominated (detector-on time) | Marked lightcurve |
|---|---|---|---|---|---|---|---|
| A | 7160 | 6821 | 1190 | 1190 | 16.62% | 17.45% | 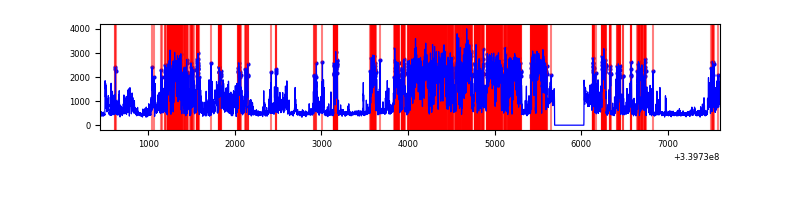 |
| B | 7161 | 6822 | 36 | 36 | 0.50% | 0.53% | 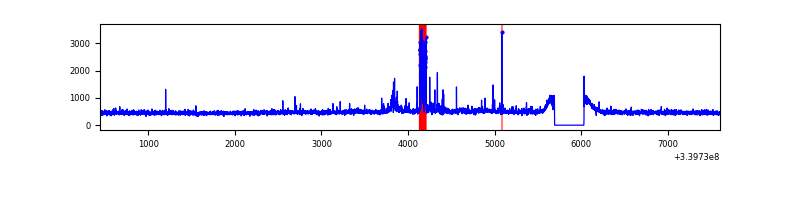 |
| C | 7161 | 6822 | 0 | 0 | 0.00% | 0.00% | 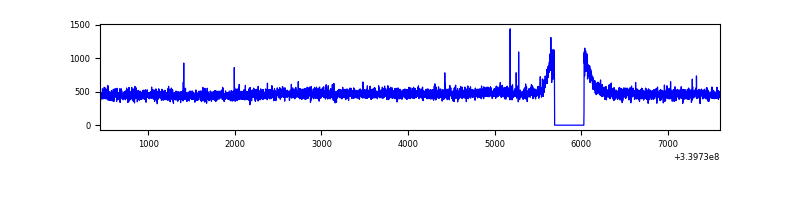 |
| D | 7161 | 6822 | 60 | 60 | 0.84% | 0.88% | 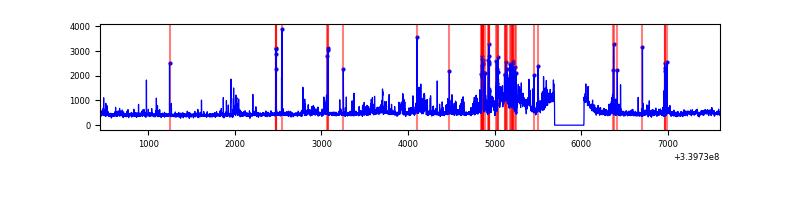 |
Top three noisy pixels from each quadrant. If the there are fewer than three noisy pixels in the level2.evt file, extra rows are filled as -1
| Pixel properties | Quadrant properties | ||||||
|---|---|---|---|---|---|---|---|
| Quadrant | DetID | PixID | Counts | Sigma | Mean | Median | Sigma |
| A | 6 | 16 | 4654935 | 29441.31 | 774 | 758 | 158.1 |
| A | 13 | 248 | 29579 | 182.32 | 774 | 758 | 158.1 |
| A | 13 | 254 | 11499 | 67.95 | 774 | 758 | 158.1 |
| B | 5 | 172 | 143374 | 891.73 | 825 | 804 | 159.9 |
| B | 0 | 190 | 54711 | 337.17 | 825 | 804 | 159.9 |
| B | 15 | 33 | 48964 | 301.23 | 825 | 804 | 159.9 |
| C | 14 | 238 | 125111 | 653.03 | 798 | 804 | 190.4 |
| C | 15 | 208 | 7218 | 33.7 | 798 | 804 | 190.4 |
| C | 13 | 61 | 5586 | 25.12 | 798 | 804 | 190.4 |
| D | 1 | 52 | 473780 | 2460.06 | 796 | 775 | 192.3 |
| D | 7 | 38 | 174496 | 903.51 | 796 | 775 | 192.3 |
| D | 12 | 233 | 117634 | 607.77 | 796 | 775 | 192.3 |
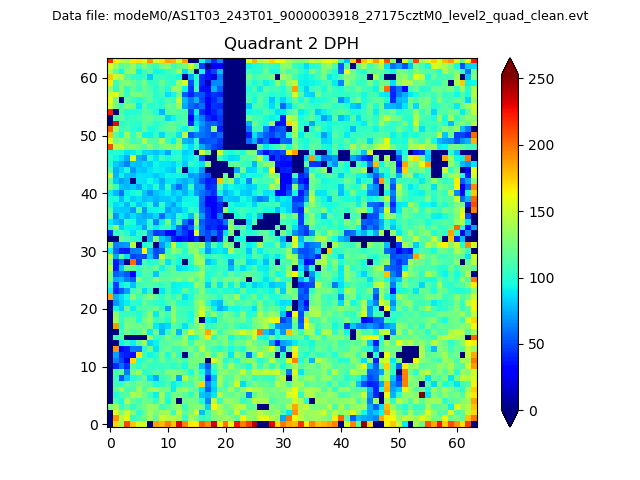
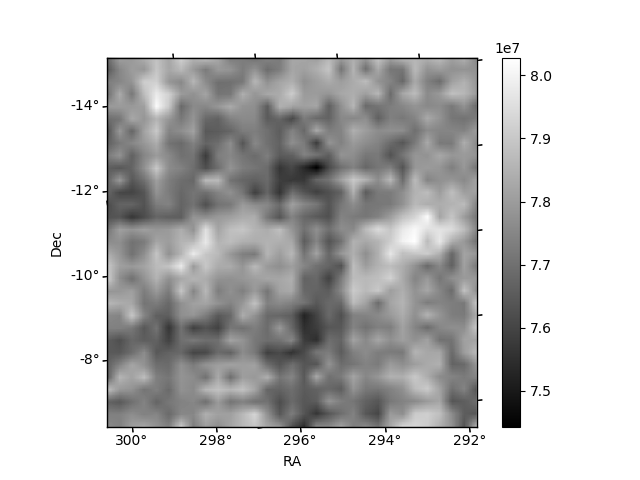
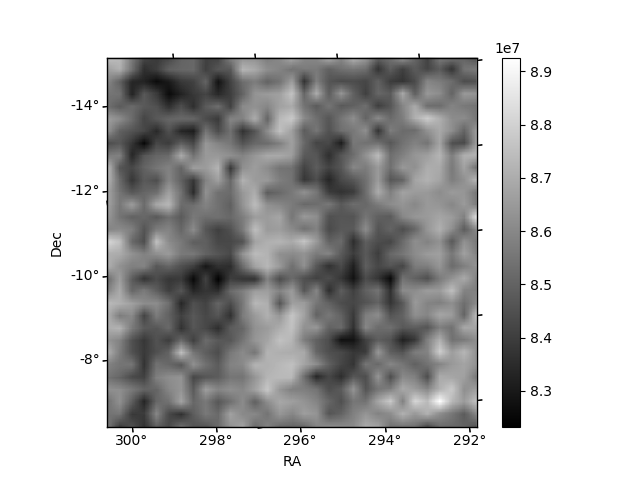
Histogram calculated using DETX and DETY for each event in the final _common_clean file
| Quadrant A | 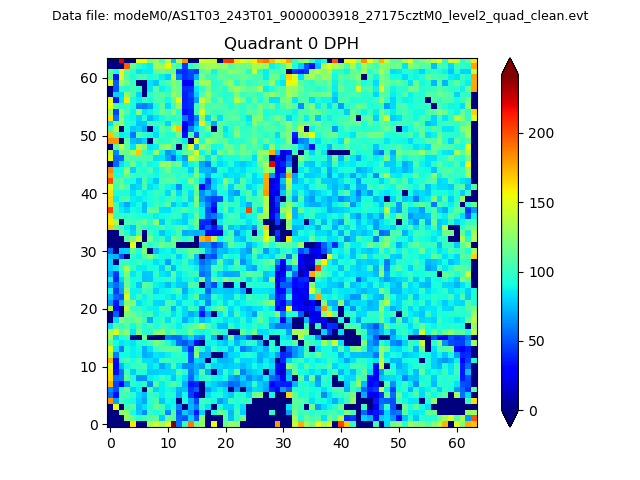 |
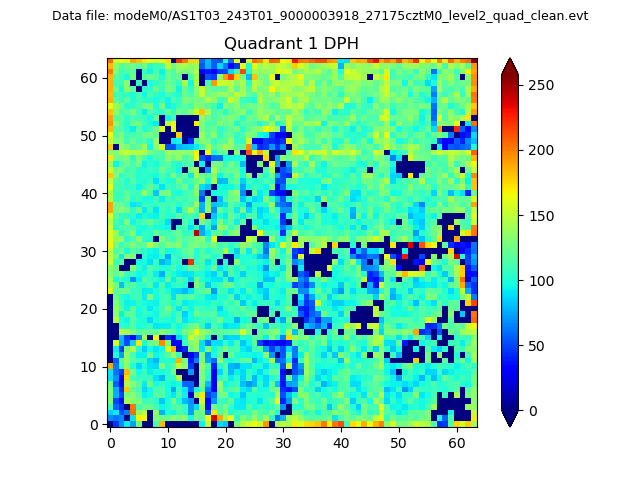 |
Quadrant B |
|---|---|---|---|
| Quadrant D | 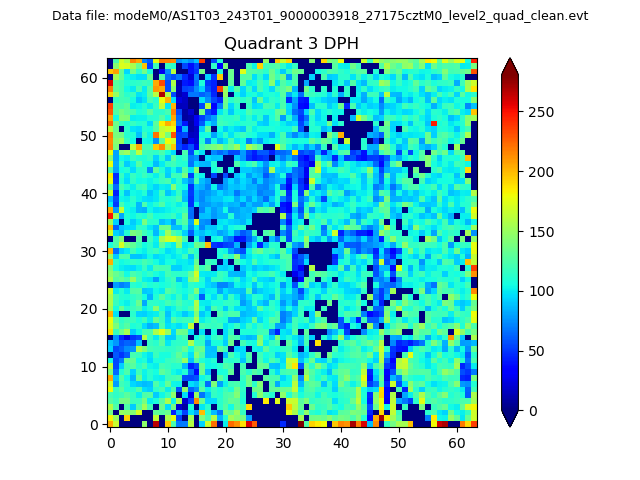 |
 |
Quadrant C |
| Plot type | Count rate plots | Images |
|---|---|---|
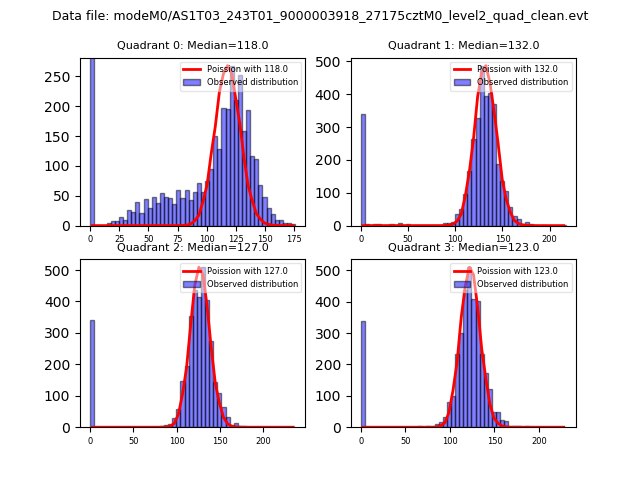
| Comparison with Poisson distribution Blue bars denote a histogram of data divided into 1 sec bins. Red curve is a Poisson curve with rate = median count rate of data. |
 |
 |
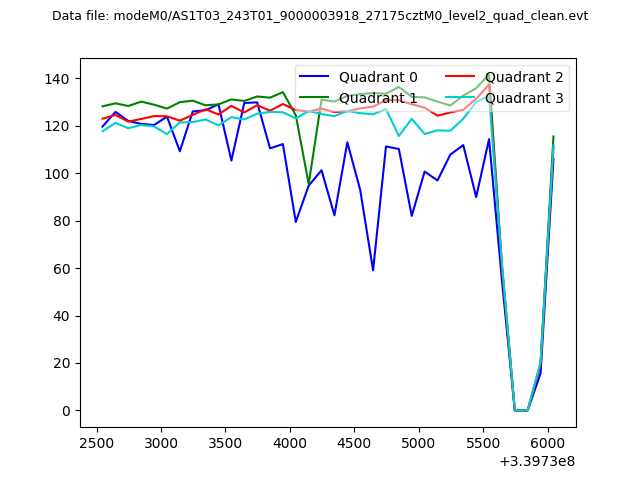
| Quadrant-wise count rates Data is divided into 100 sec bins |
 |
|
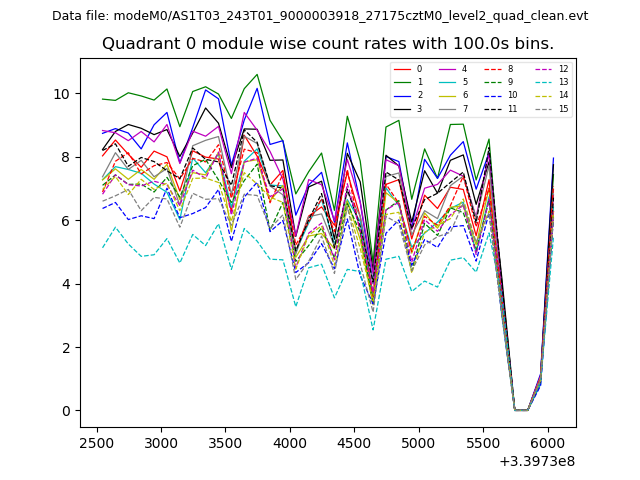
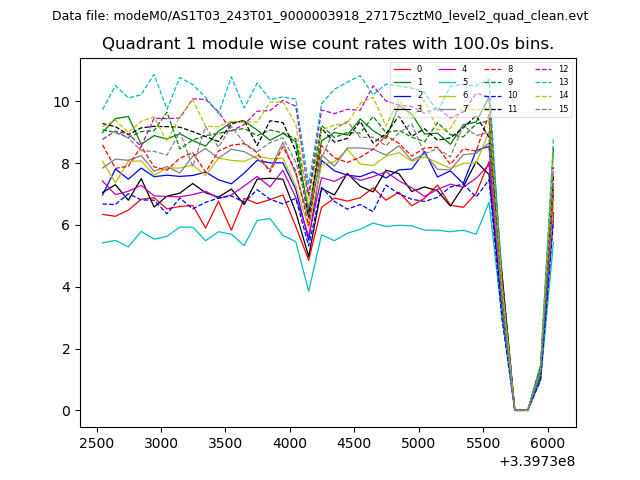
| Module-wise count rates for Quadrant A Data is divided into 100 sec bins |
 |
 |
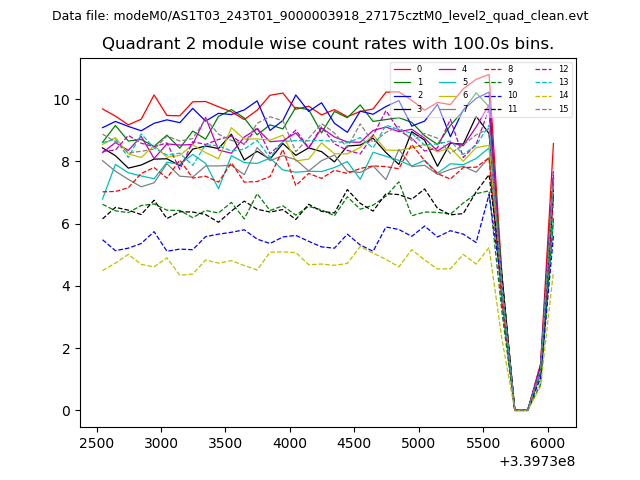
| Module-wise count rates for Quadrant B Data is divided into 100 sec bins |
 |
 |
| Module-wise count rates for Quadrant C Data is divided into 100 sec bins |
 |
 |
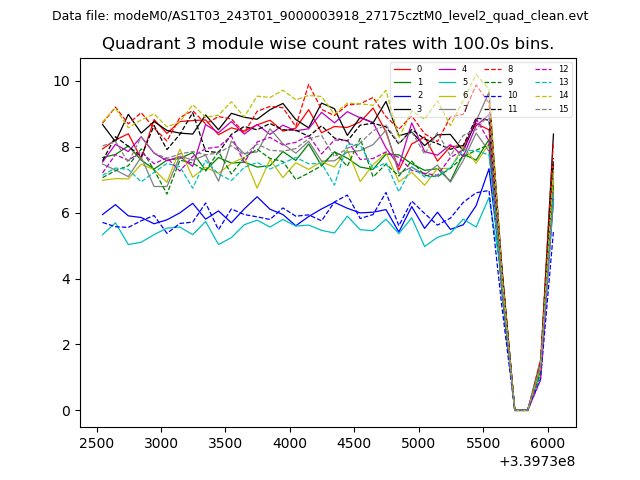
| Module-wise count rates for Quadrant D Data is divided into 100 sec bins |
 |
 |
| Parameter | Plot |
|---|---|
| CZT HV Monitor | 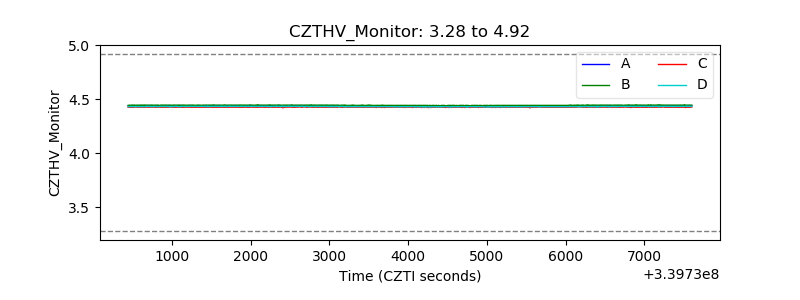 |
| D_VDD | 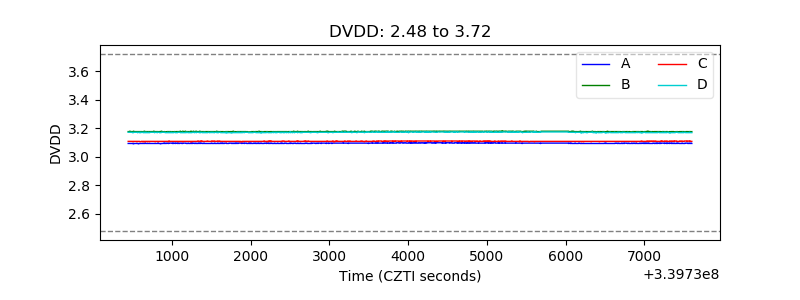 |
| Temperature 1 | 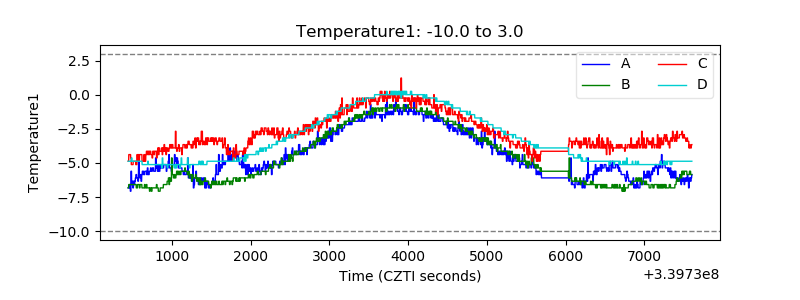 |
| Veto HV Monitor | 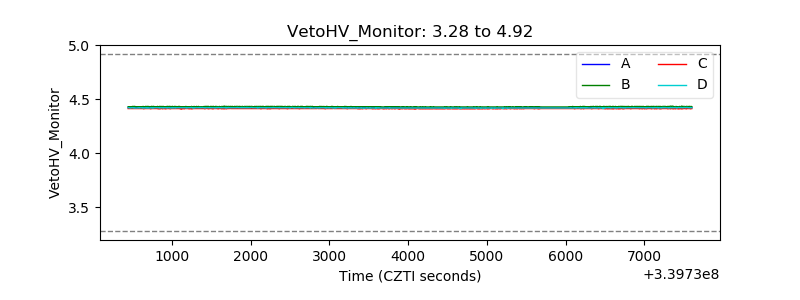 |
| Veto LLD | 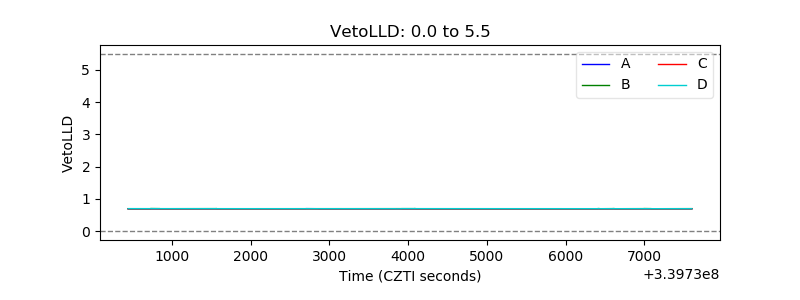 |
| Alpha Counter | 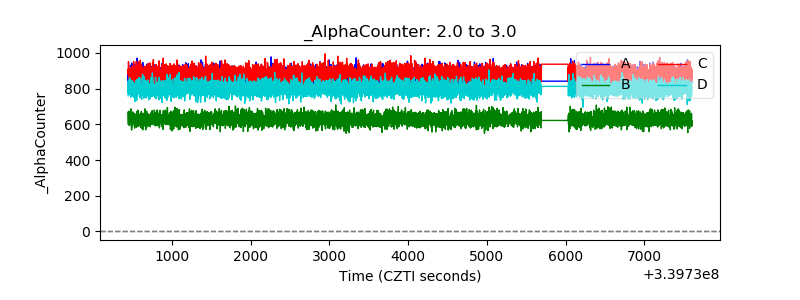 |
| _CPM_Rate | 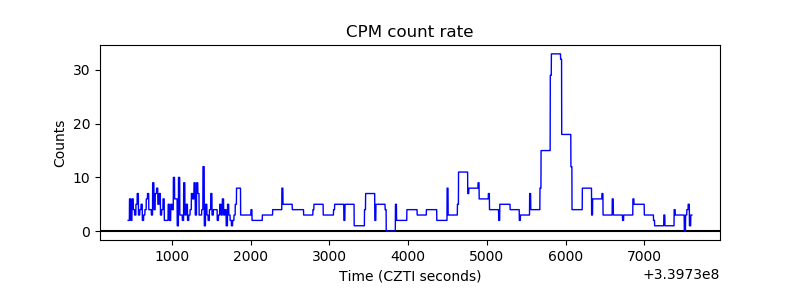 |
| CZT Counter | 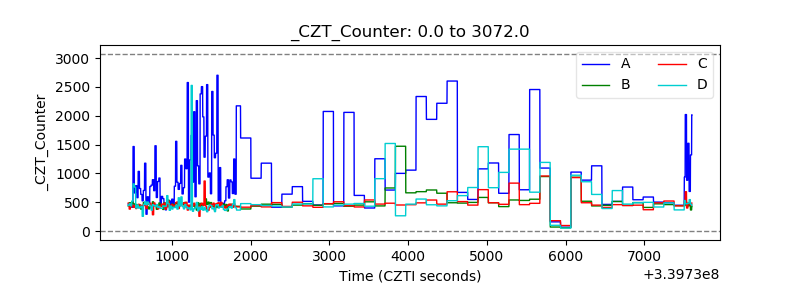 |
| +2.5 Volts monitor | 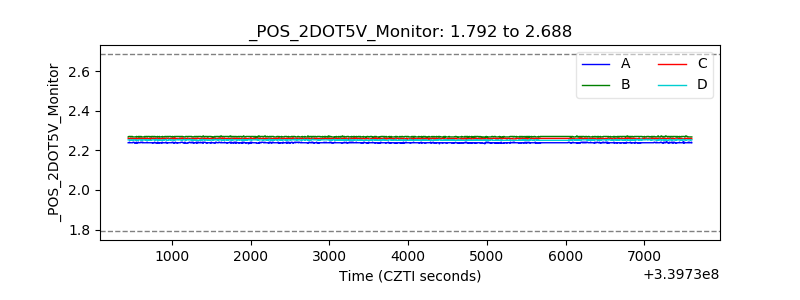 |
| +5 Volts monitor | 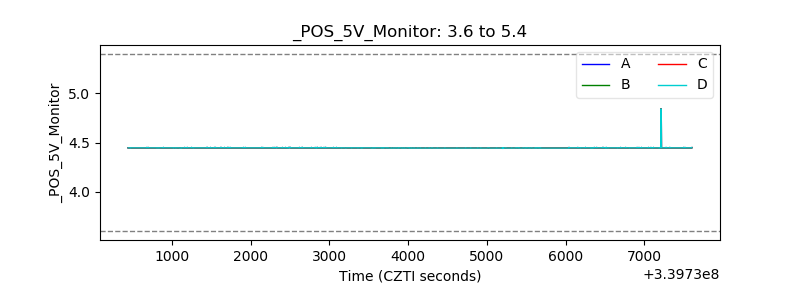 |
| _ROLL_ROT | 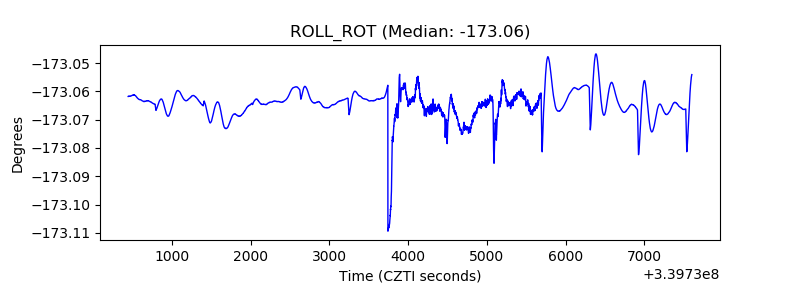 |
| _Roll_DEC | 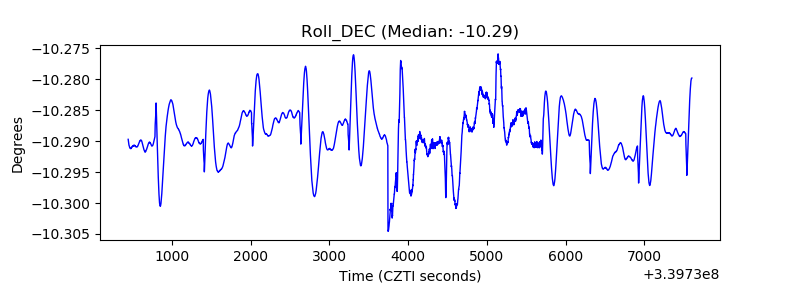 |
| _Roll_RA | 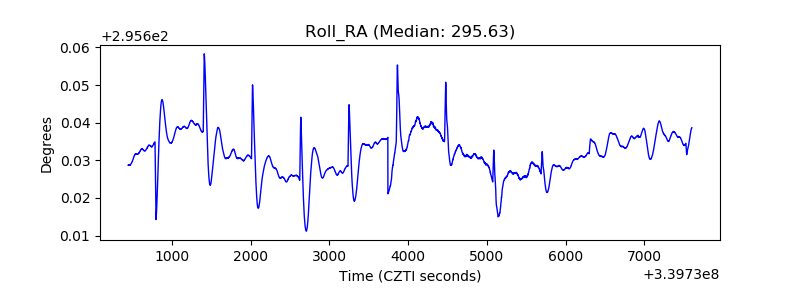 |
| Veto Counter | 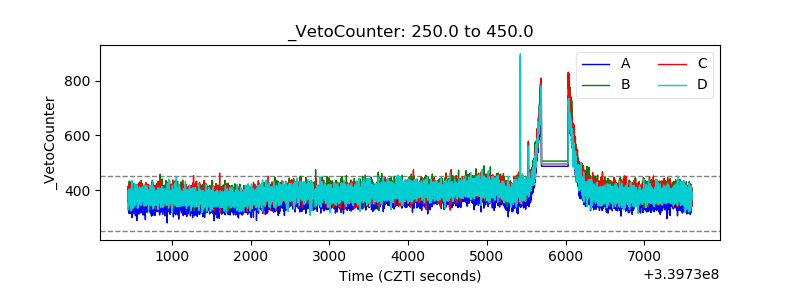 |