| Param | Original file | Final file |
|---|---|---|
| Filename | modeM0/AS1A10_057T05_9000004060_28105cztM0_level2.evt | modeM0/AS1A10_057T05_9000004060_28105cztM0_level2_quad_clean.evt |
| Size (bytes) | 479,831,040 | 103,668,480 |
| Size | 457.6 MB | 98.9 MB |
| Events in quadrant A | 3,367,936 | 682,872 |
| Events in quadrant B | 3,452,885 | 676,494 |
| Events in quadrant C | 3,541,616 | 643,675 |
| Events in quadrant D | 3,687,305 | 642,862 |
| Mode M0 | |||
|---|---|---|---|
| Quadrant | BADHDUFLAG | Total packets | Discarded packets |
| A | 0 | 14627 | 0 |
| B | 0 | 14880 | 0 |
| C | 0 | 15143 | 0 |
| D | 0 | 15893 | 0 |
| Mode M9 | |||
|---|---|---|---|
| Quadrant | BADHDUFLAG | Total packets | Discarded packets |
| A | 0 | 17 | 0 |
| B | 0 | 17 | 0 |
| C | 0 | 17 | 0 |
| D | 0 | 17 | 1 |
| Quadrant | Total seconds | Saturated seconds | Saturation percentage |
|---|---|---|---|
| A | 7086 | 49 | 0.691504% |
| B | 7091 | 65 | 0.916655% |
| C | 7093 | 93 | 1.311152% |
| D | 7085 | 72 | 1.016231% |
Noise dominated data is calculated using 1-second bins in cleaned event files. If a bin has >2000 counts, and if more than 50% of those come from <1% of pixels, then it is considered to be noise-dominated and hence unusable.
| Quadrant | # 1 sec bins | Bins with >0 counts | Bins with >2000 counts | High rate bins dominated by noise | Noise dominated (total time) | Noise dominated (detector-on time) | Marked lightcurve |
|---|---|---|---|---|---|---|---|
| A | 8866 | 7145 | 0 | 0 | 0.00% | 0.00% | 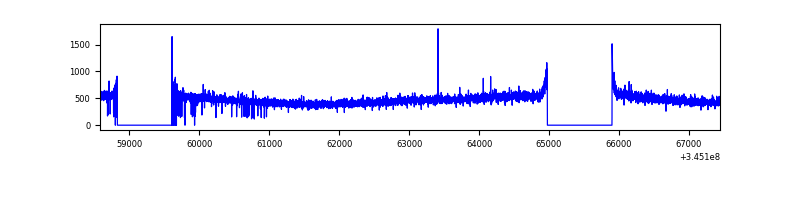 |
| B | 8867 | 7149 | 1 | 1 | 0.01% | 0.01% | 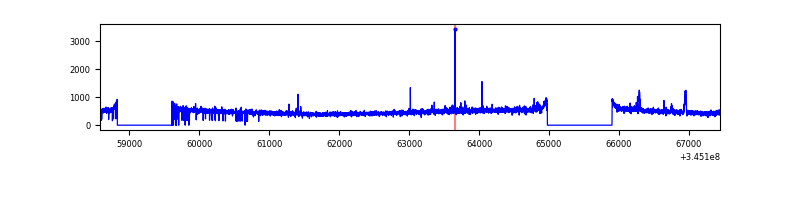 |
| C | 8867 | 7155 | 0 | 0 | 0.00% | 0.00% | 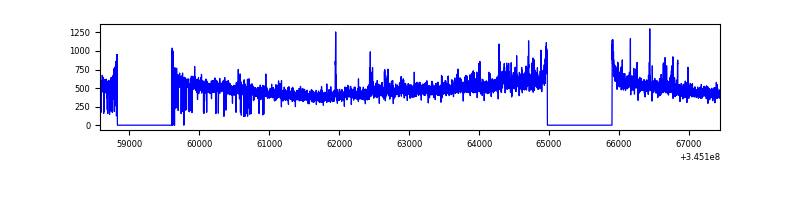 |
| D | 8866 | 7147 | 35 | 35 | 0.39% | 0.49% | 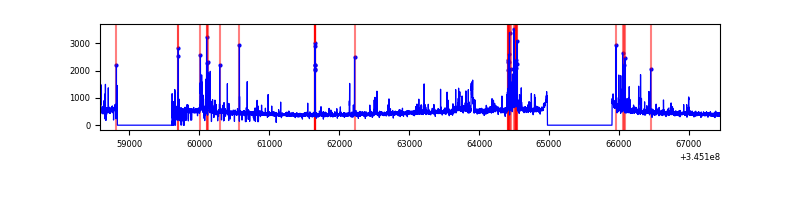 |
Top three noisy pixels from each quadrant. If the there are fewer than three noisy pixels in the level2.evt file, extra rows are filled as -1
| Pixel properties | Quadrant properties | ||||||
|---|---|---|---|---|---|---|---|
| Quadrant | DetID | PixID | Counts | Sigma | Mean | Median | Sigma |
| A | 5 | 98 | 14863 | 80.47 | 867 | 848 | 174.2 |
| A | 13 | 254 | 12304 | 65.78 | 867 | 848 | 174.2 |
| A | 3 | 137 | 8621 | 44.63 | 867 | 848 | 174.2 |
| B | 0 | 230 | 37965 | 225.33 | 859 | 837 | 164.8 |
| B | 12 | 111 | 20825 | 121.31 | 859 | 837 | 164.8 |
| B | 11 | 111 | 18903 | 109.64 | 859 | 837 | 164.8 |
| C | 3 | 233 | 181727 | 928.23 | 827 | 833 | 194.9 |
| C | 14 | 238 | 132447 | 675.35 | 827 | 833 | 194.9 |
| C | 13 | 61 | 5709 | 25.02 | 827 | 833 | 194.9 |
| D | 2 | 250 | 207307 | 1032.39 | 833 | 808 | 200.0 |
| D | 1 | 52 | 202940 | 1010.56 | 833 | 808 | 200.0 |
| D | 8 | 195 | 78056 | 386.2 | 833 | 808 | 200.0 |
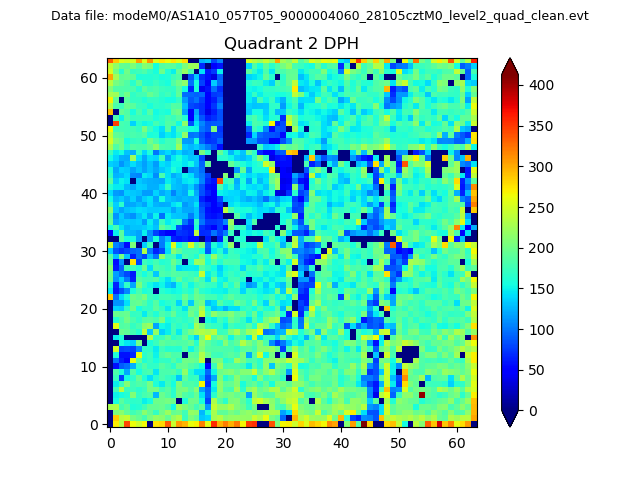
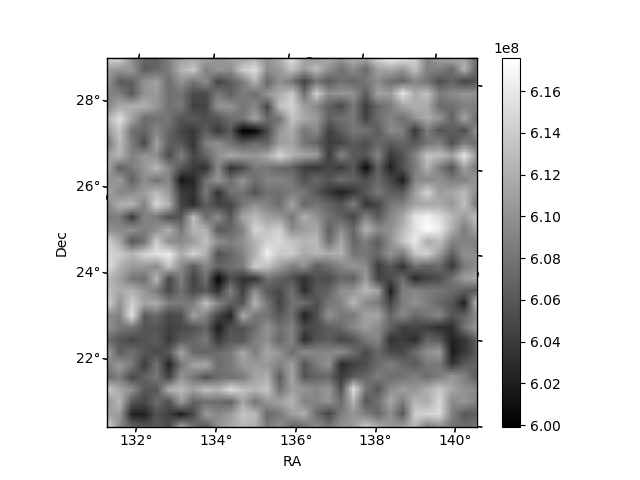
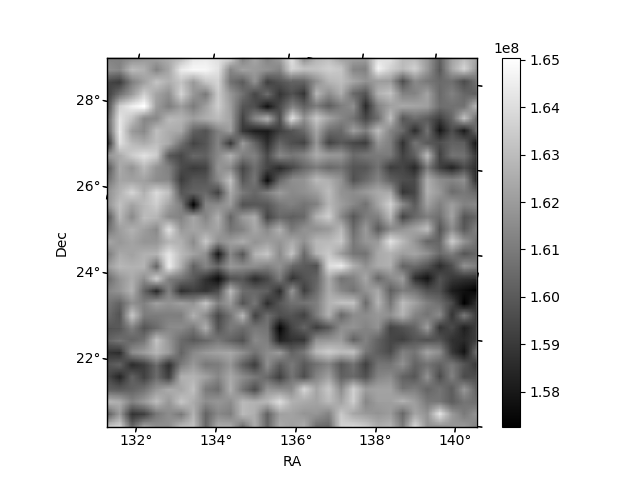
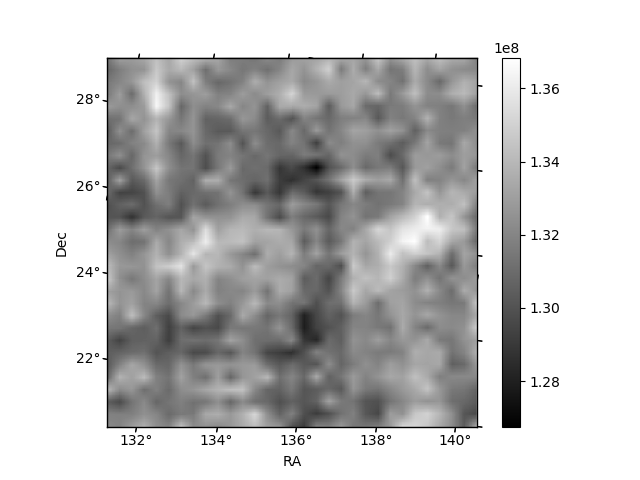
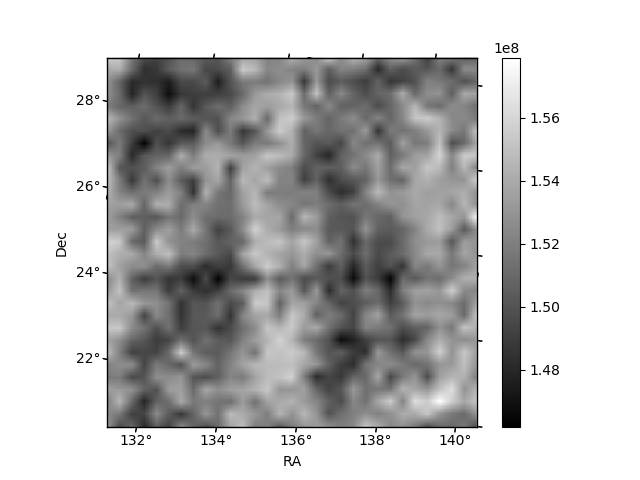
Histogram calculated using DETX and DETY for each event in the final _common_clean file
| Quadrant A | 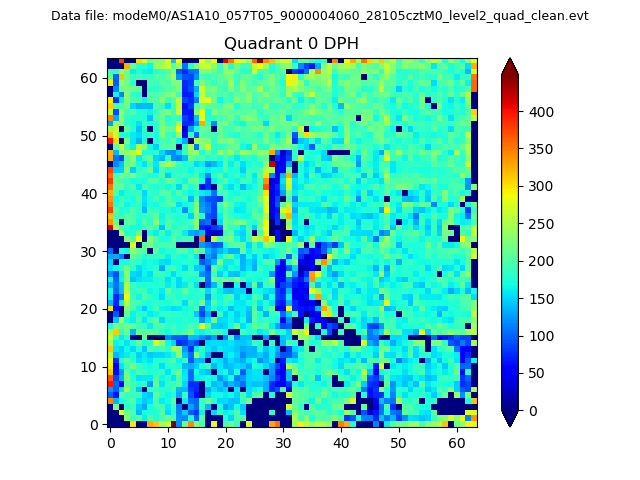 |
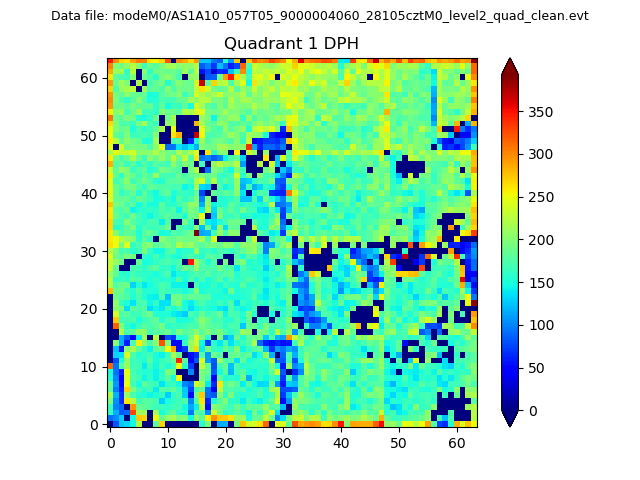 |
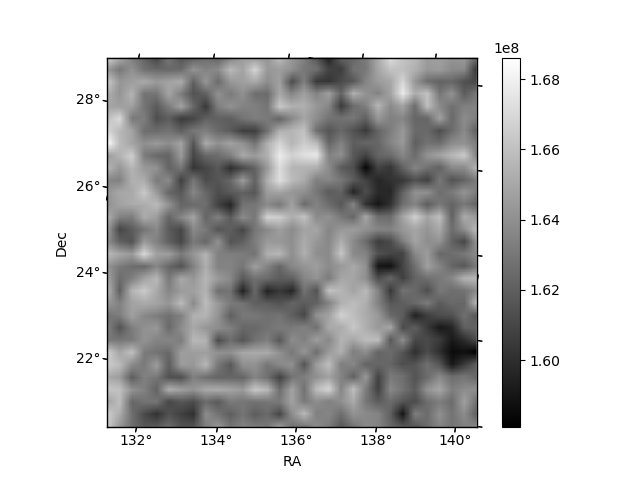
Quadrant B |
|---|---|---|---|
| Quadrant D | 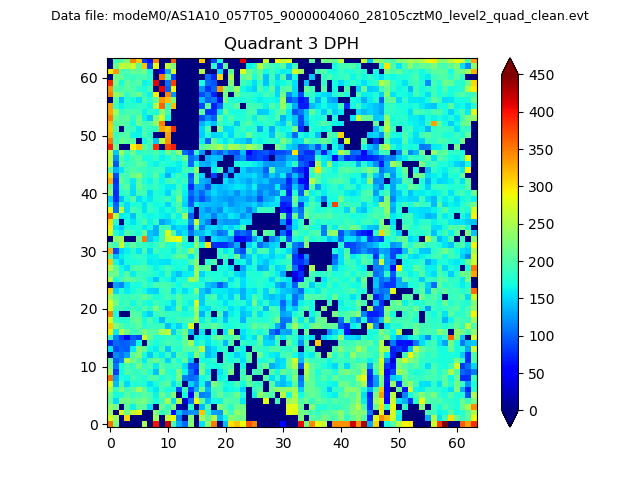 |
 |
Quadrant C |
| Plot type | Count rate plots | Images |
|---|---|---|
| Comparison with Poisson distribution Blue bars denote a histogram of data divided into 1 sec bins. Red curve is a Poisson curve with rate = median count rate of data. |
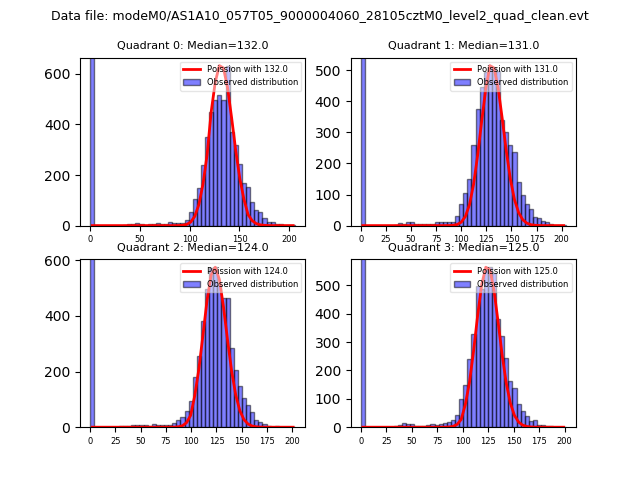 |
 |
| Quadrant-wise count rates Data is divided into 100 sec bins |
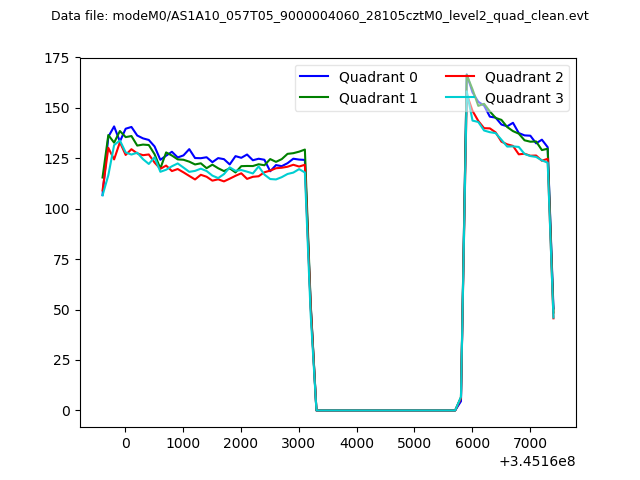 |
|
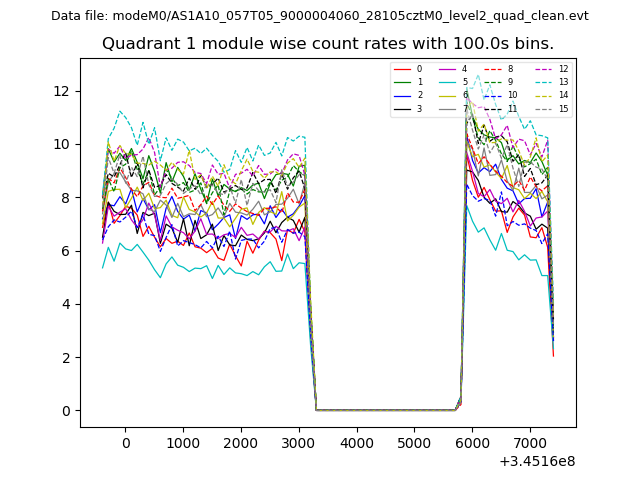
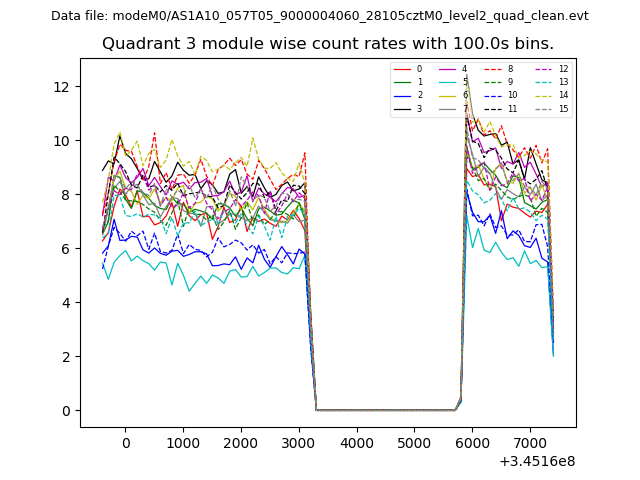
| Module-wise count rates for Quadrant A Data is divided into 100 sec bins |
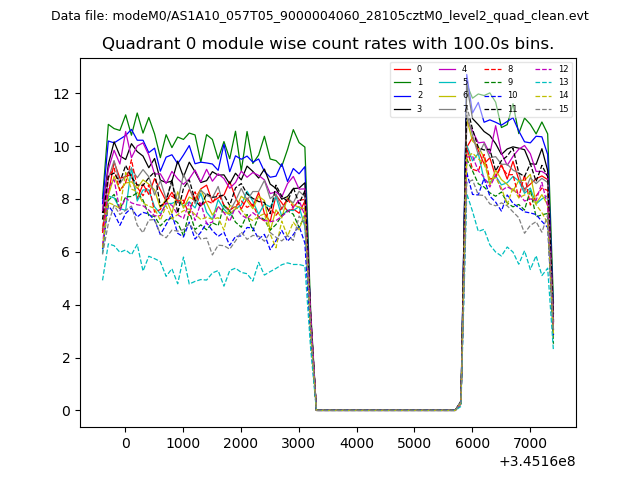 |
 |
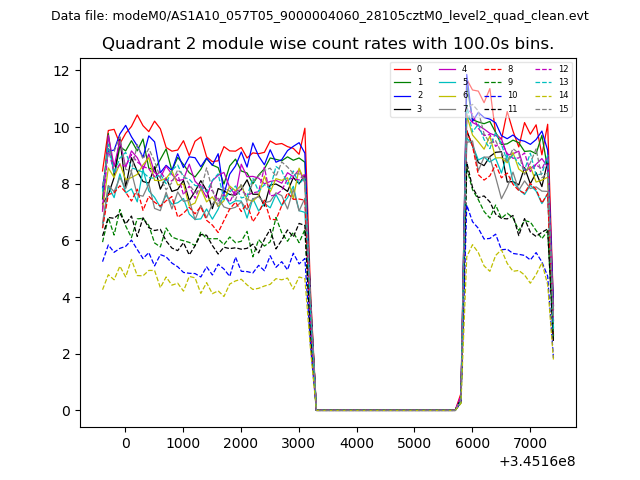
| Module-wise count rates for Quadrant B Data is divided into 100 sec bins |
 |
 |
| Module-wise count rates for Quadrant C Data is divided into 100 sec bins |
 |
 |
| Module-wise count rates for Quadrant D Data is divided into 100 sec bins |
 |
 |
| Parameter | Plot |
|---|---|
| CZT HV Monitor | 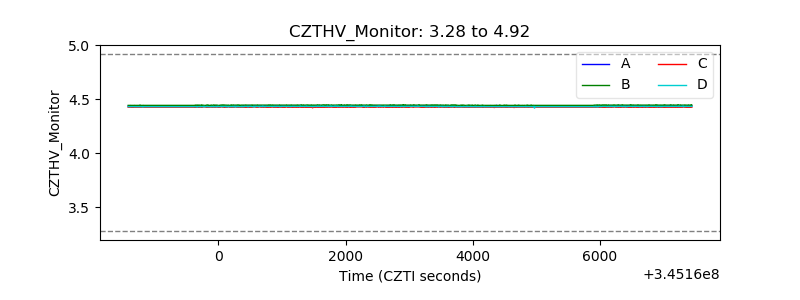 |
| D_VDD | 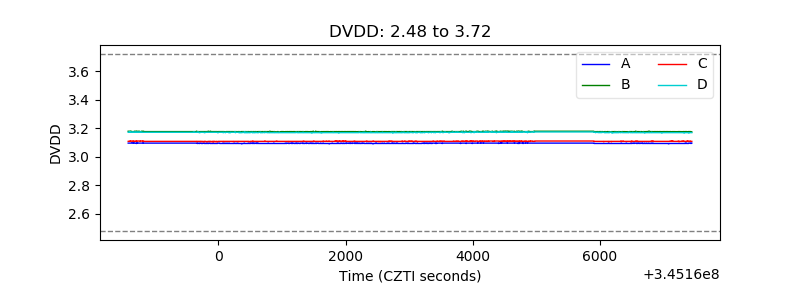 |
| Temperature 1 | 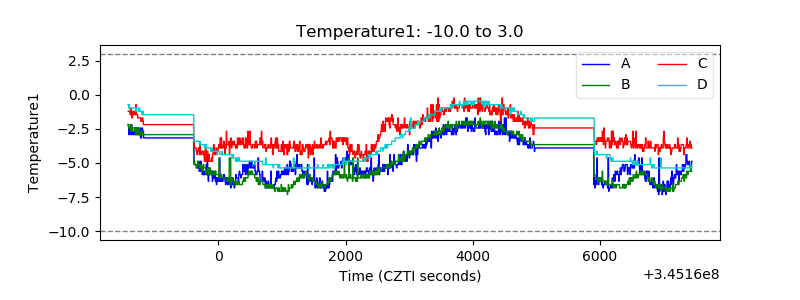 |
| Veto HV Monitor | 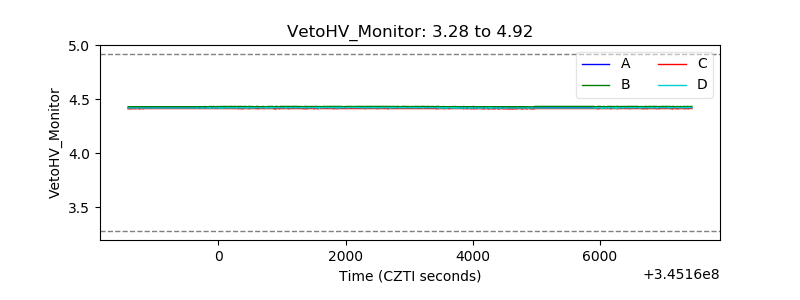 |
| Veto LLD | 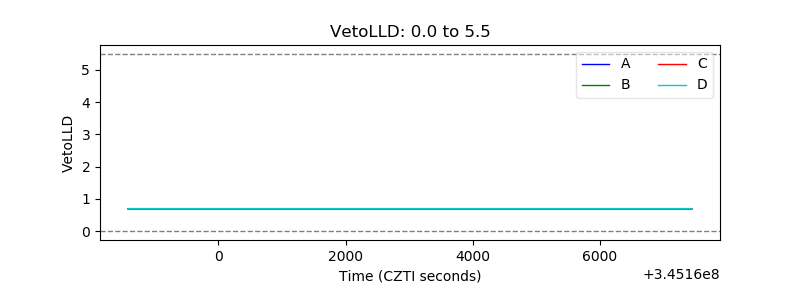 |
| Alpha Counter | 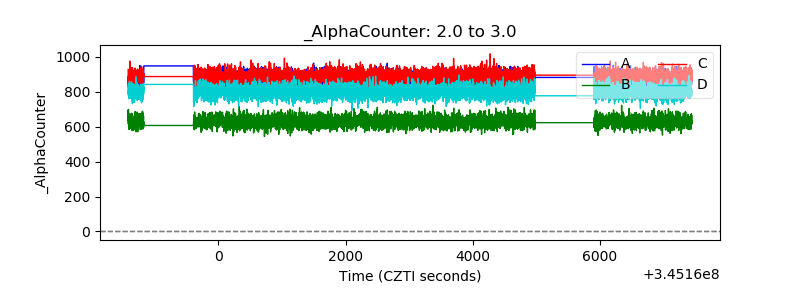 |
| _CPM_Rate | 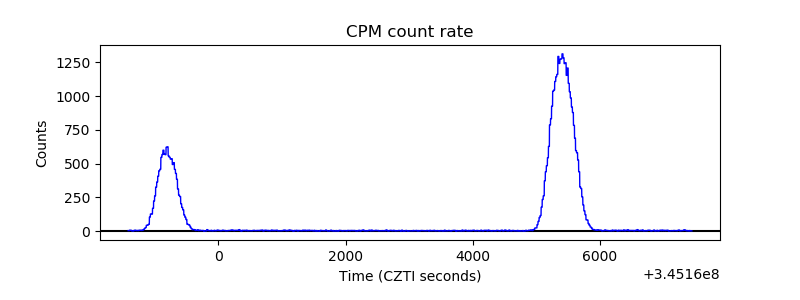 |
| CZT Counter | 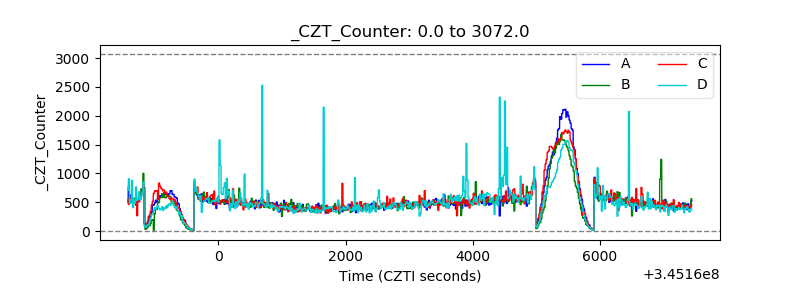 |
| +2.5 Volts monitor | 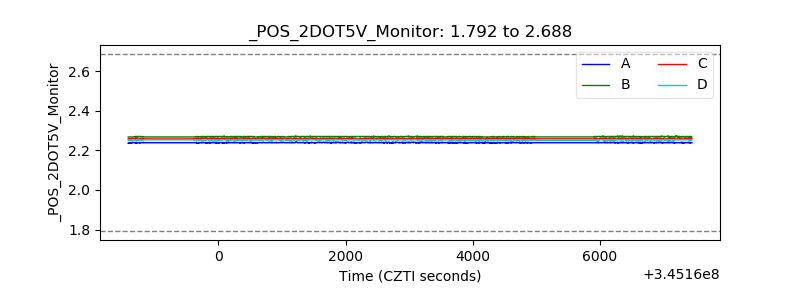 |
| +5 Volts monitor | 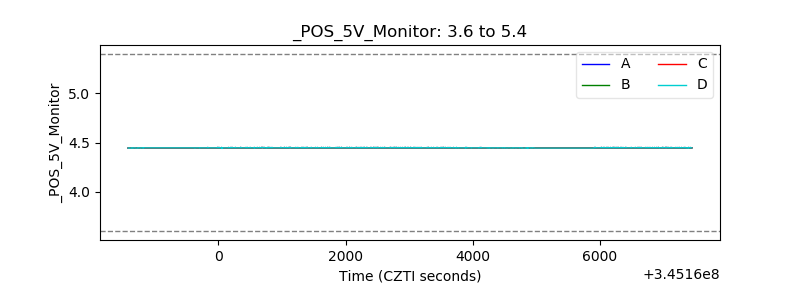 |
| _ROLL_ROT | 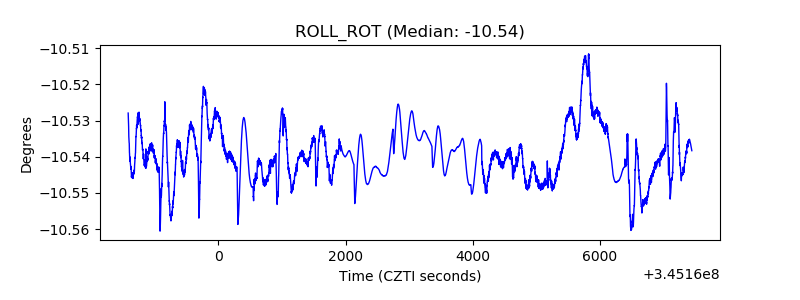 |
| _Roll_DEC | 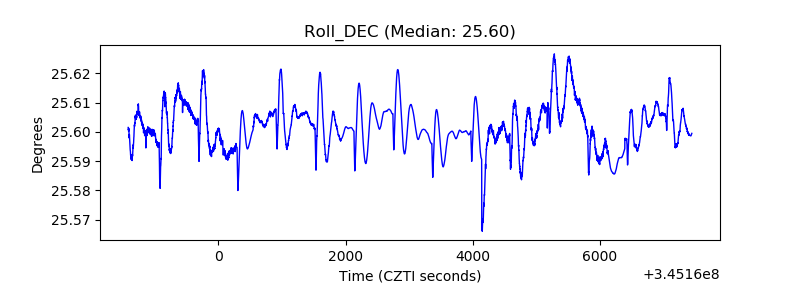 |
| _Roll_RA | 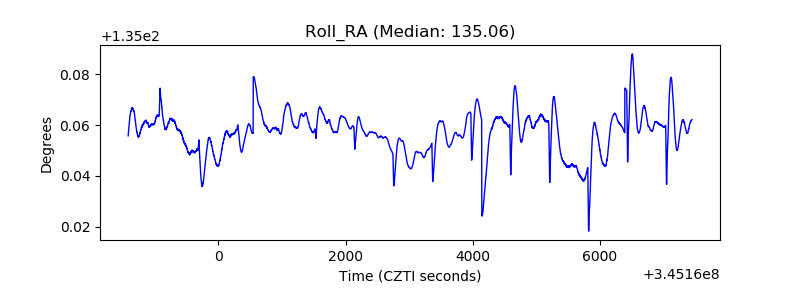 |
| Veto Counter | 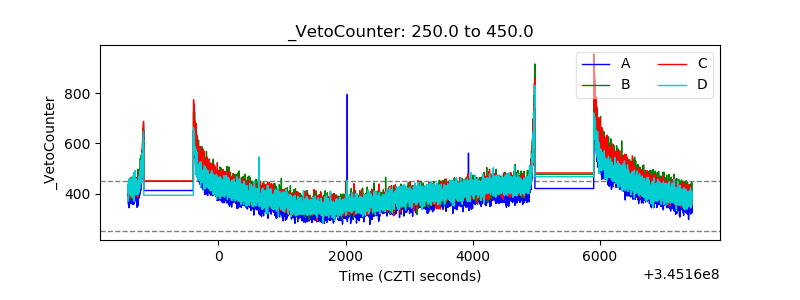 |