| Param | Original file | Final file |
|---|---|---|
| Filename | modeM0/AS1A10_071T03_9000004314_30021cztM0_level2.evt | modeM0/AS1A10_071T03_9000004314_30021cztM0_level2_quad_clean.evt |
| Size (bytes) | 563,149,440 | 67,489,920 |
| Size | 537.1 MB | 64.4 MB |
| Events in quadrant A | 3,723,655 | 407,921 |
| Events in quadrant B | 5,502,448 | 406,230 |
| Events in quadrant C | 3,718,793 | 384,639 |
| Events in quadrant D | 3,661,392 | 382,175 |
| Mode M9 | |||
|---|---|---|---|
| Quadrant | BADHDUFLAG | Total packets | Discarded packets |
| A | 0 | 19 | 0 |
| B | 0 | 20 | 0 |
| C | 0 | 20 | 0 |
| D | 0 | 20 | 0 |
| Mode M0 | |||
|---|---|---|---|
| Quadrant | BADHDUFLAG | Total packets | Discarded packets |
| A | 0 | 14898 | 2 |
| B | 0 | 20519 | 2 |
| C | 0 | 14856 | 2 |
| D | 0 | 14527 | 2 |
| Mode SS | |||
|---|---|---|---|
| Quadrant | BADHDUFLAG | Total packets | Discarded packets |
| A | 0 | 136 | 0 |
| B | 0 | 136 | 0 |
| C | 0 | 136 | 0 |
| D | 0 | 136 | 0 |
| Quadrant | Total seconds | Saturated seconds | Saturation percentage |
|---|---|---|---|
| A | 6627 | 91 | 1.373170% |
| B | 6626 | 162 | 2.444914% |
| C | 6626 | 97 | 1.463930% |
| D | 6626 | 73 | 1.101720% |
Noise dominated data is calculated using 1-second bins in cleaned event files. If a bin has >2000 counts, and if more than 50% of those come from <1% of pixels, then it is considered to be noise-dominated and hence unusable.
| Quadrant | # 1 sec bins | Bins with >0 counts | Bins with >2000 counts | High rate bins dominated by noise | Noise dominated (total time) | Noise dominated (detector-on time) | Marked lightcurve |
|---|---|---|---|---|---|---|---|
| A | 7912 | 6628 | 2 | 2 | 0.03% | 0.03% |  |
| B | 7911 | 6627 | 4 | 4 | 0.05% | 0.06% |  |
| C | 7911 | 6627 | 12 | 12 | 0.15% | 0.18% |  |
| D | 7911 | 6627 | 27 | 27 | 0.34% | 0.41% |  |
Top three noisy pixels from each quadrant. If the there are fewer than three noisy pixels in the level2.evt file, extra rows are filled as -1
| Pixel properties | Quadrant properties | ||||||
|---|---|---|---|---|---|---|---|
| Quadrant | DetID | PixID | Counts | Sigma | Mean | Median | Sigma |
| A | 8 | 192 | 22956 | 116.14 | 955 | 940 | 189.6 |
| A | 5 | 203 | 16496 | 82.06 | 955 | 940 | 189.6 |
| A | 13 | 254 | 11021 | 53.18 | 955 | 940 | 189.6 |
| B | 6 | 159 | 1784465 | 10055.05 | 939 | 920 | 177.4 |
| B | 10 | 247 | 27101 | 147.6 | 939 | 920 | 177.4 |
| B | 12 | 111 | 21220 | 114.44 | 939 | 920 | 177.4 |
| C | 14 | 238 | 148304 | 716.95 | 890 | 900 | 205.6 |
| C | 3 | 233 | 53295 | 254.84 | 890 | 900 | 205.6 |
| C | 0 | 10 | 35194 | 166.8 | 890 | 900 | 205.6 |
| D | 8 | 195 | 145548 | 692.05 | 894 | 876 | 209.0 |
| D | 7 | 238 | 85885 | 406.65 | 894 | 876 | 209.0 |
| D | 10 | 70 | 24118 | 111.18 | 894 | 876 | 209.0 |
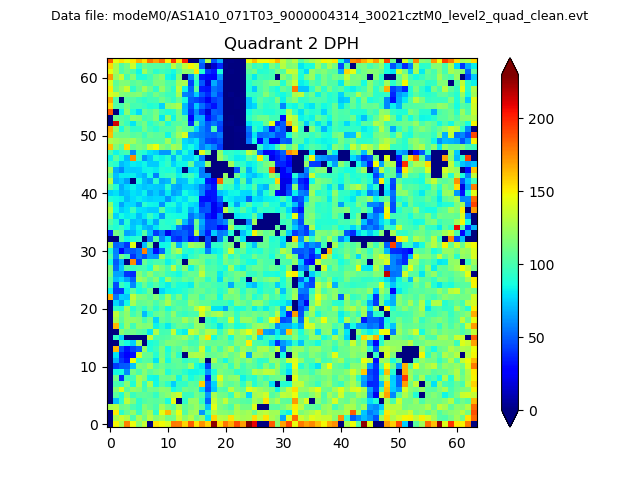
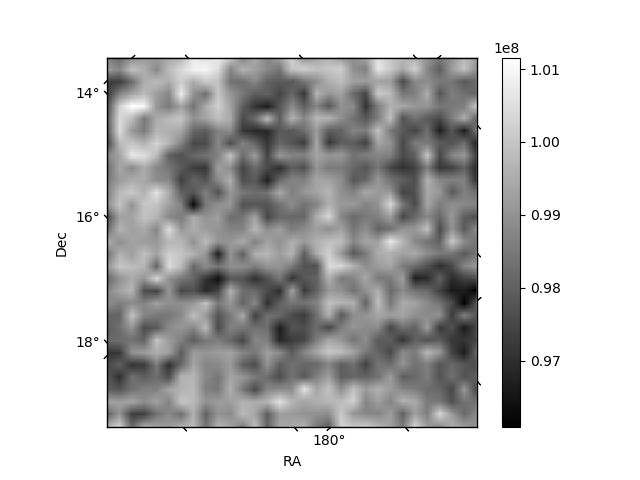
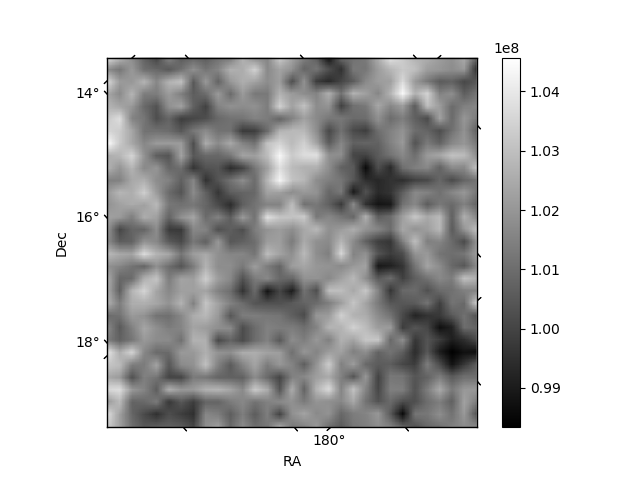
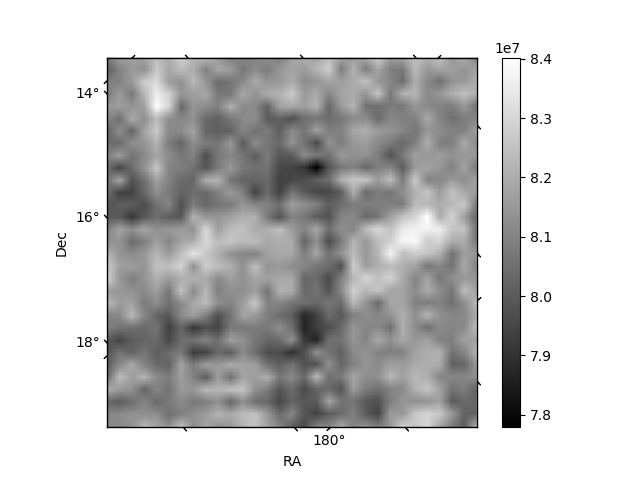
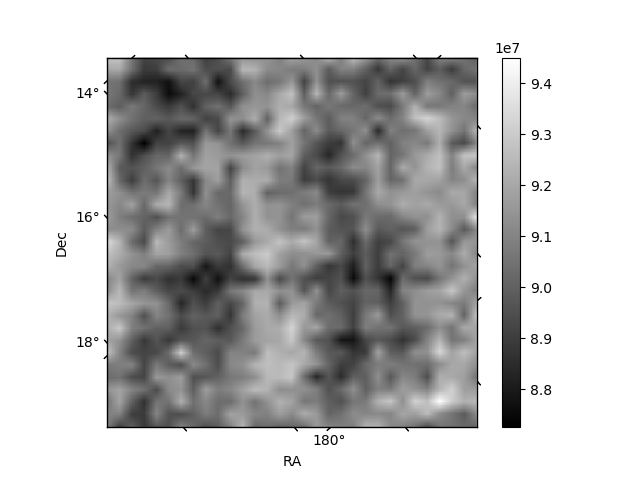
Histogram calculated using DETX and DETY for each event in the final _common_clean file
| Quadrant A | 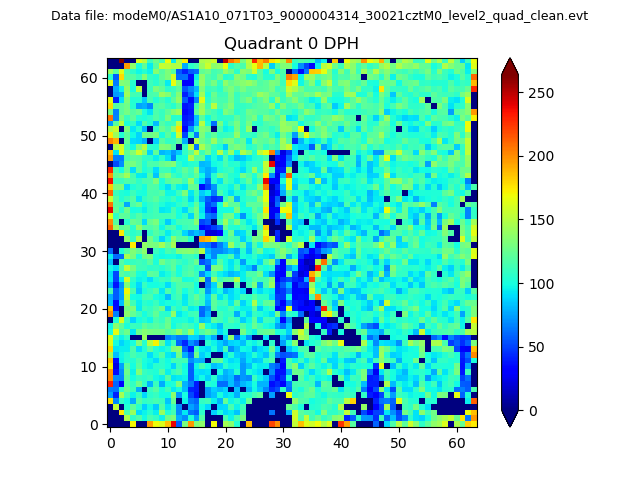 |
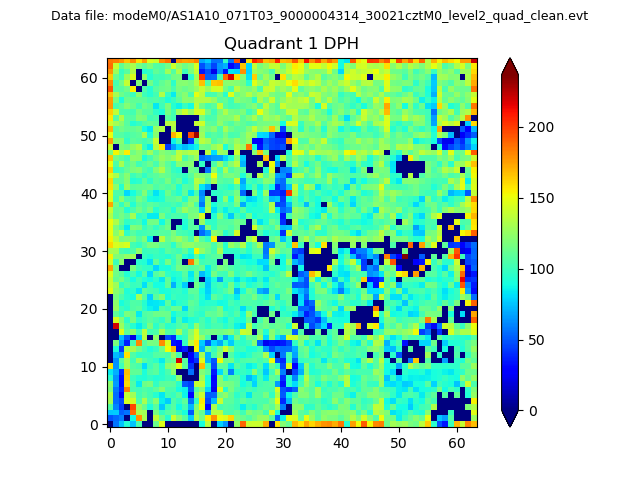 |
Quadrant B |
|---|---|---|---|
| Quadrant D | 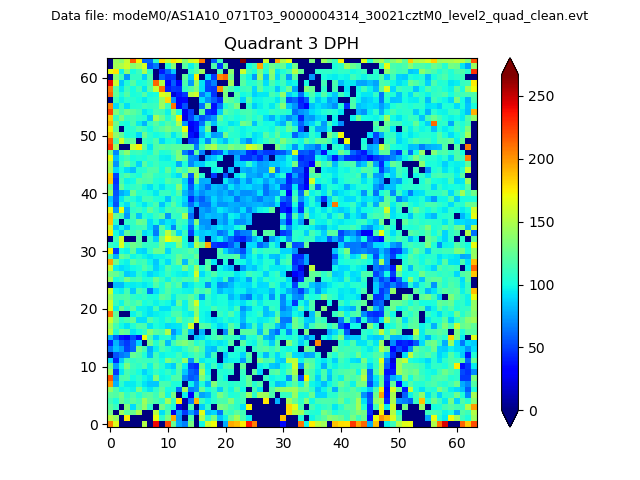 |
 |
Quadrant C |
| Plot type | Count rate plots | Images |
|---|---|---|
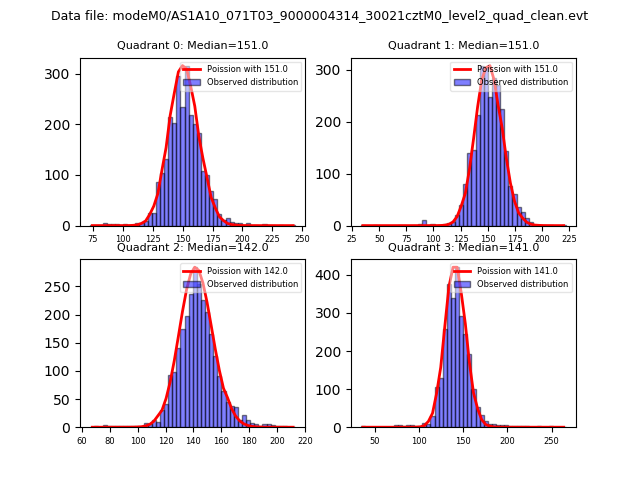
| Comparison with Poisson distribution Blue bars denote a histogram of data divided into 1 sec bins. Red curve is a Poisson curve with rate = median count rate of data. |
 |
 |
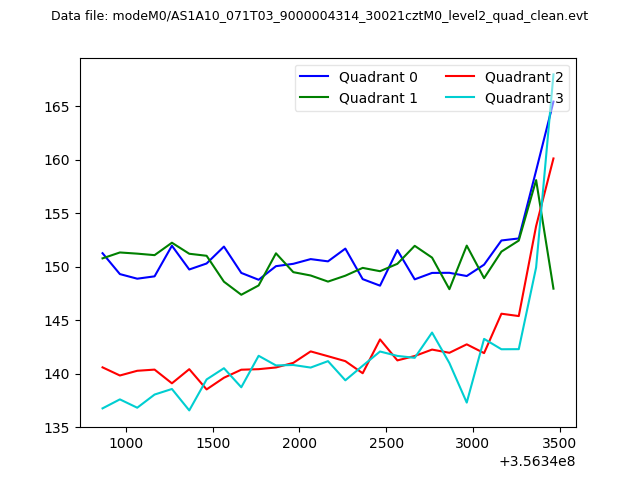
| Quadrant-wise count rates Data is divided into 100 sec bins |
 |
|
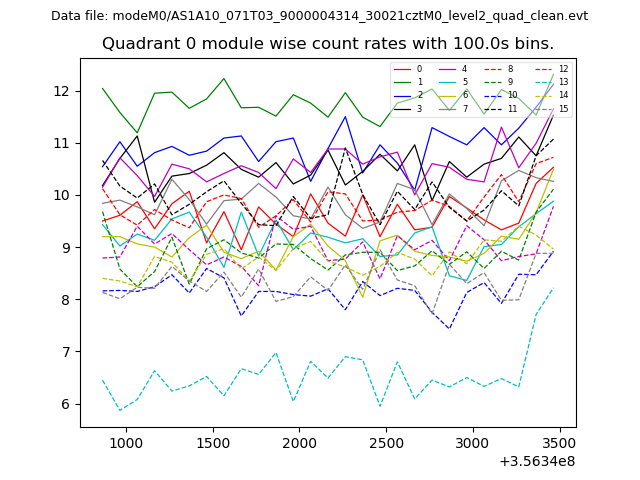
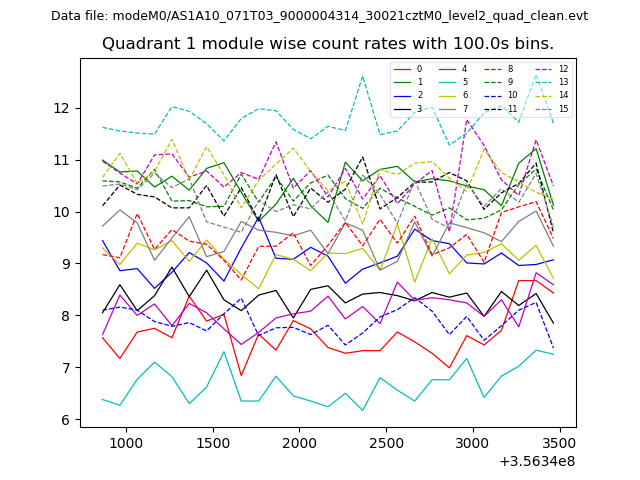
| Module-wise count rates for Quadrant A Data is divided into 100 sec bins |
 |
 |
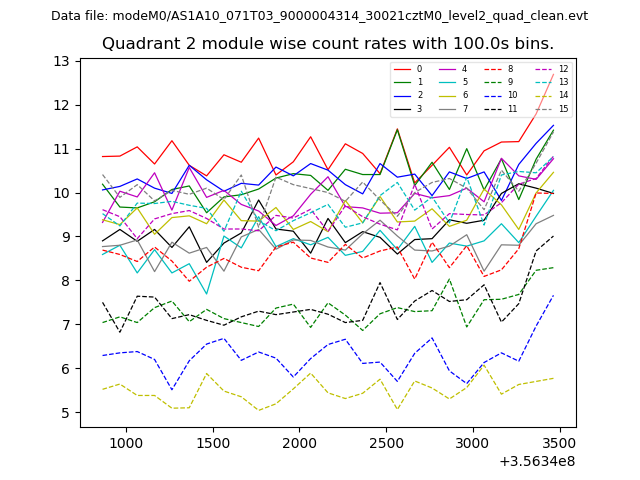
| Module-wise count rates for Quadrant B Data is divided into 100 sec bins |
 |
 |
| Module-wise count rates for Quadrant C Data is divided into 100 sec bins |
 |
 |
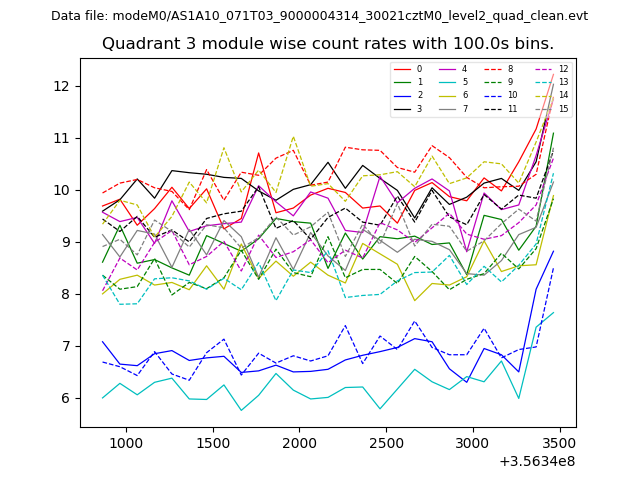
| Module-wise count rates for Quadrant D Data is divided into 100 sec bins |
 |
 |
| Parameter | Plot |
|---|---|
| CZT HV Monitor | 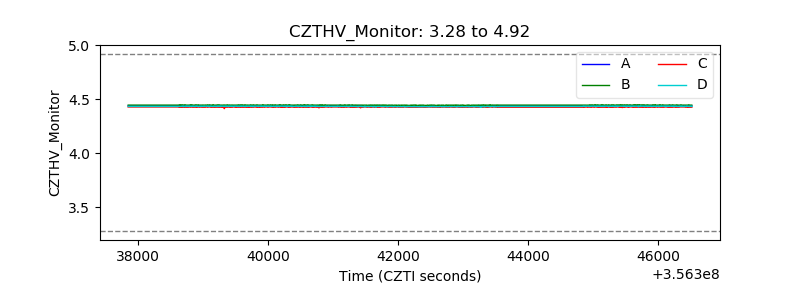 |
| D_VDD | 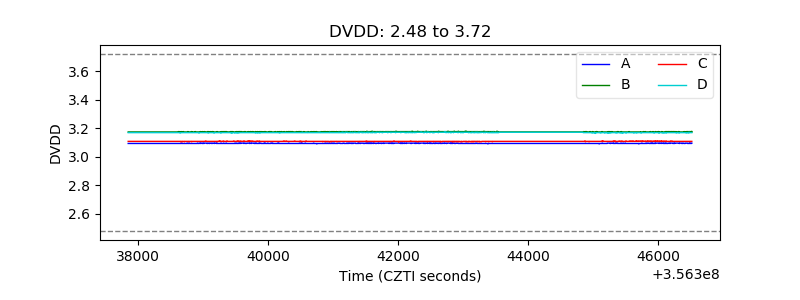 |
| Temperature 1 | 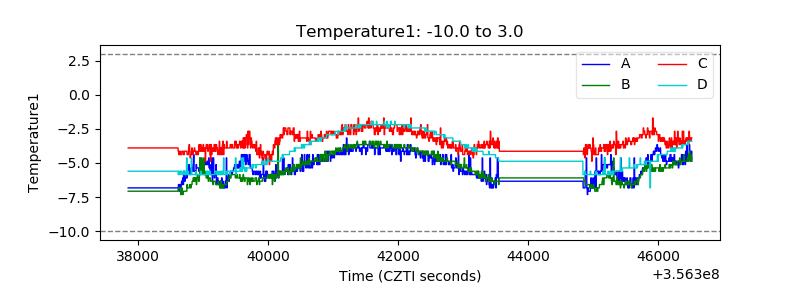 |
| Veto HV Monitor | 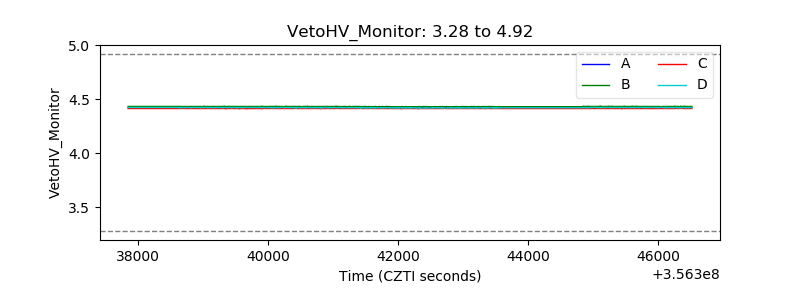 |
| Veto LLD | 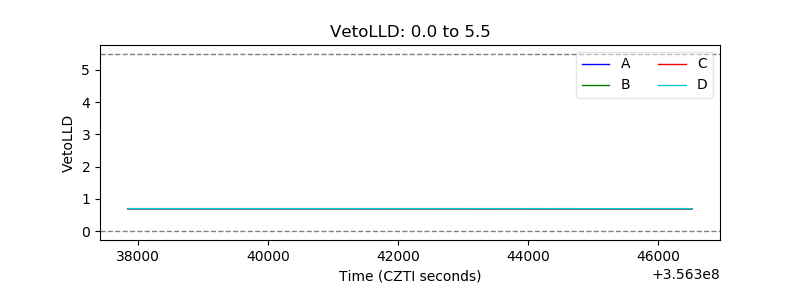 |
| Alpha Counter | 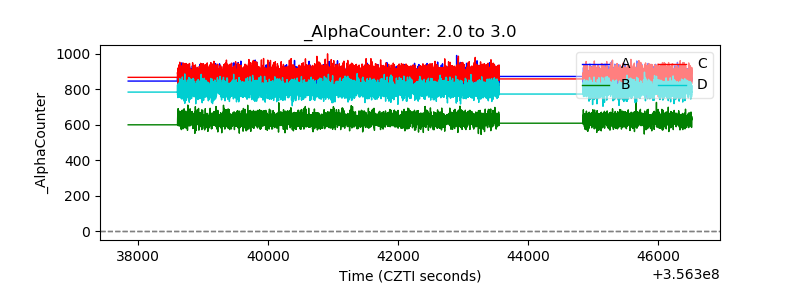 |
| _CPM_Rate | 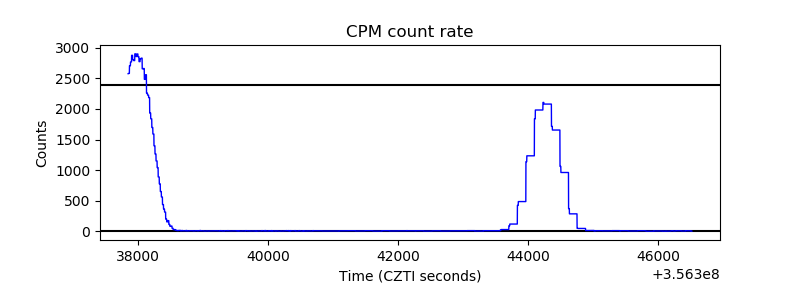 |
| CZT Counter | 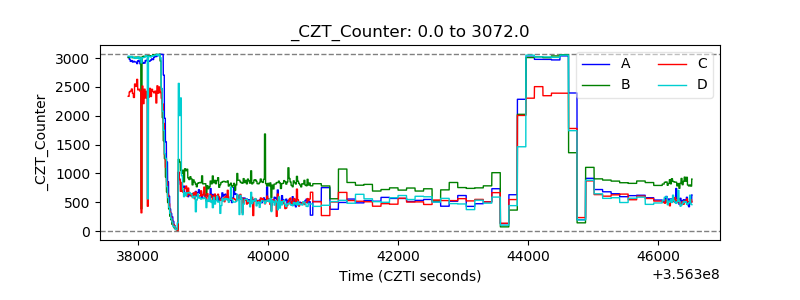 |
| +2.5 Volts monitor | 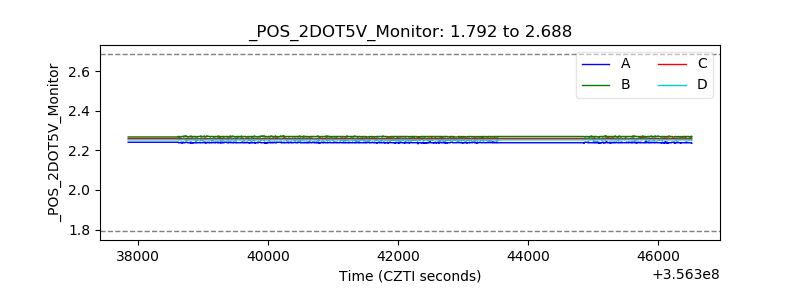 |
| +5 Volts monitor | 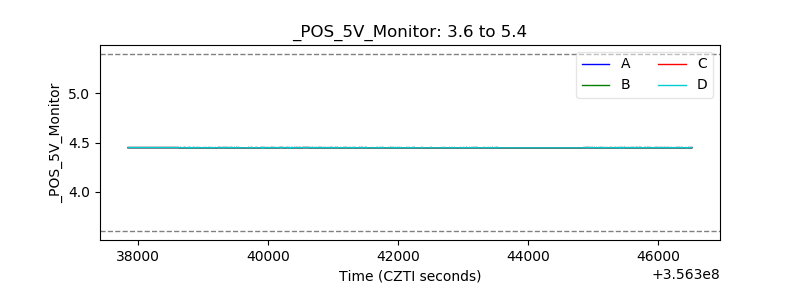 |
| _ROLL_ROT | 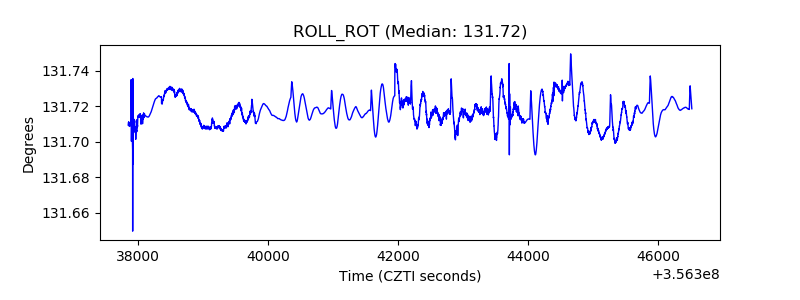 |
| _Roll_DEC | 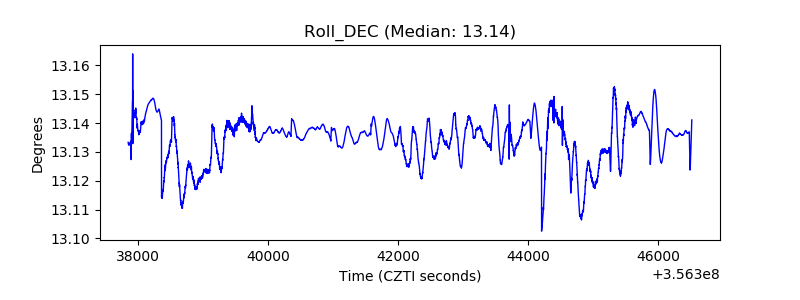 |
| _Roll_RA | 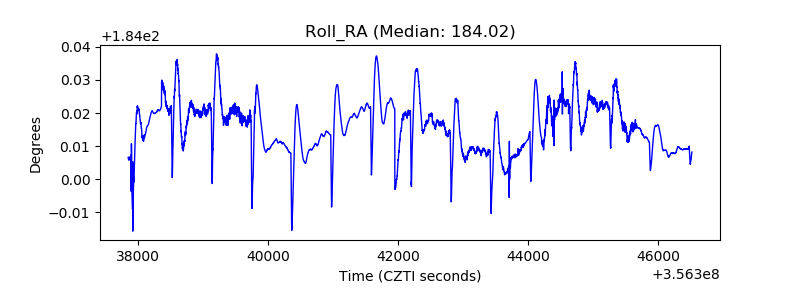 |
| Veto Counter | 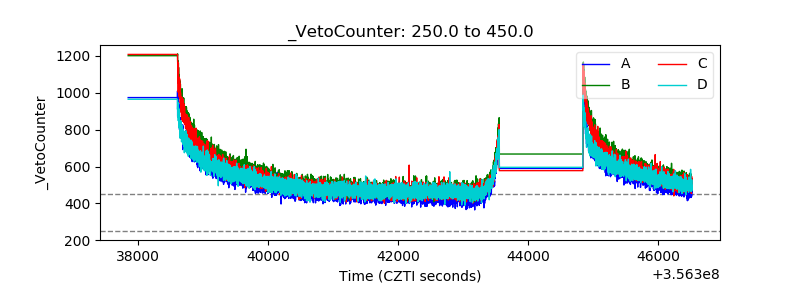 |