| Param | Original file | Final file |
|---|---|---|
| Filename | modeM0/AS1T04_006T01_9000004370_30392cztM0_level2.evt | modeM0/AS1T04_006T01_9000004370_30392cztM0_level2_quad_clean.evt |
| Size (bytes) | 1,896,534,720 | 290,692,800 |
| Size | 1.8 GB | 277.2 MB |
| Events in quadrant A | 11,631,583 | 1,813,401 |
| Events in quadrant B | 18,192,516 | 1,826,066 |
| Events in quadrant C | 11,853,196 | 1,781,337 |
| Events in quadrant D | 14,148,911 | 1,739,245 |
| Mode M9 | |||
|---|---|---|---|
| Quadrant | BADHDUFLAG | Total packets | Discarded packets |
| A | 0 | 25 | 0 |
| B | 0 | 25 | 0 |
| C | 0 | 25 | 0 |
| D | 0 | 25 | 0 |
| Mode M0 | |||
|---|---|---|---|
| Quadrant | BADHDUFLAG | Total packets | Discarded packets |
| A | 0 | 49964 | 4 |
| B | 0 | 72234 | 4 |
| C | 0 | 49564 | 5 |
| D | 0 | 56675 | 4 |
| Mode SS | |||
|---|---|---|---|
| Quadrant | BADHDUFLAG | Total packets | Discarded packets |
| A | 0 | 486 | 0 |
| B | 0 | 486 | 0 |
| C | 0 | 486 | 0 |
| D | 0 | 486 | 0 |
| Quadrant | Total seconds | Saturated seconds | Saturation percentage |
|---|---|---|---|
| A | 23896 | 364 | 1.523267% |
| B | 23896 | 440 | 1.841312% |
| C | 23895 | 429 | 1.795355% |
| D | 23895 | 801 | 3.352166% |
Noise dominated data is calculated using 1-second bins in cleaned event files. If a bin has >2000 counts, and if more than 50% of those come from <1% of pixels, then it is considered to be noise-dominated and hence unusable.
| Quadrant | # 1 sec bins | Bins with >0 counts | Bins with >2000 counts | High rate bins dominated by noise | Noise dominated (total time) | Noise dominated (detector-on time) | Marked lightcurve |
|---|---|---|---|---|---|---|---|
| A | 26371 | 23896 | 60 | 60 | 0.23% | 0.25% | 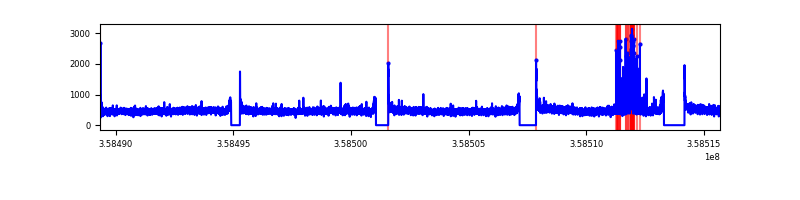 |
| B | 26371 | 23896 | 3 | 3 | 0.01% | 0.01% | 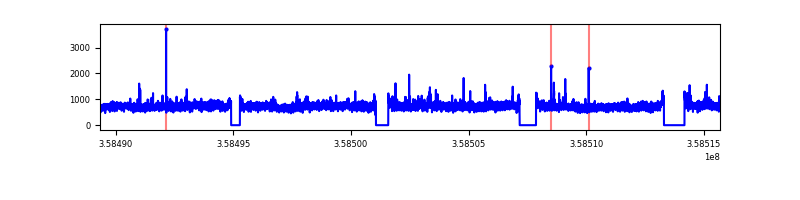 |
| C | 26370 | 23895 | 2 | 2 | 0.01% | 0.01% | 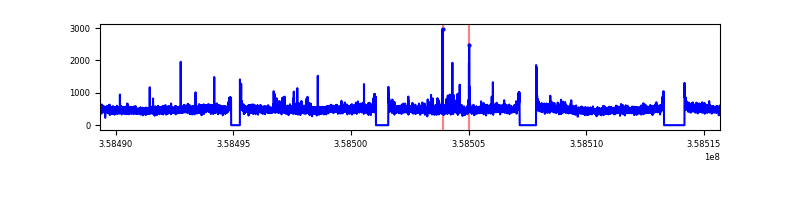 |
| D | 26370 | 23895 | 520 | 520 | 1.97% | 2.18% | 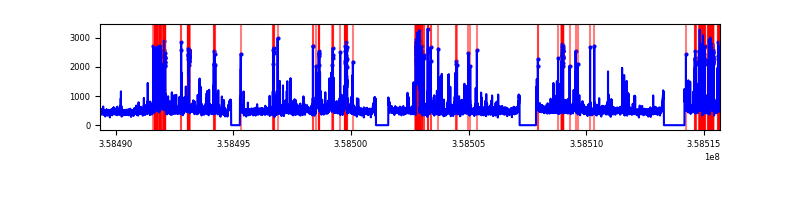 |
Top three noisy pixels from each quadrant. If the there are fewer than three noisy pixels in the level2.evt file, extra rows are filled as -1
| Pixel properties | Quadrant properties | ||||||
|---|---|---|---|---|---|---|---|
| Quadrant | DetID | PixID | Counts | Sigma | Mean | Median | Sigma |
| A | 0 | 13 | 351958 | 601.15 | 2898 | 2839 | 580.8 |
| A | 8 | 192 | 46383 | 74.98 | 2898 | 2839 | 580.8 |
| A | 13 | 254 | 46190 | 74.65 | 2898 | 2839 | 580.8 |
| B | 6 | 159 | 6521571 | 11821.94 | 2871 | 2792 | 551.4 |
| B | 0 | 229 | 147799 | 262.97 | 2871 | 2792 | 551.4 |
| B | 0 | 190 | 104083 | 183.69 | 2871 | 2792 | 551.4 |
| C | 14 | 238 | 454050 | 693.49 | 2801 | 2819 | 650.7 |
| C | 3 | 233 | 381708 | 582.31 | 2801 | 2819 | 650.7 |
| C | 2 | 114 | 55376 | 80.77 | 2801 | 2819 | 650.7 |
| D | 8 | 195 | 1072219 | 1566.44 | 2800 | 2734 | 682.7 |
| D | 13 | 104 | 965322 | 1409.87 | 2800 | 2734 | 682.7 |
| D | 12 | 233 | 417584 | 607.62 | 2800 | 2734 | 682.7 |
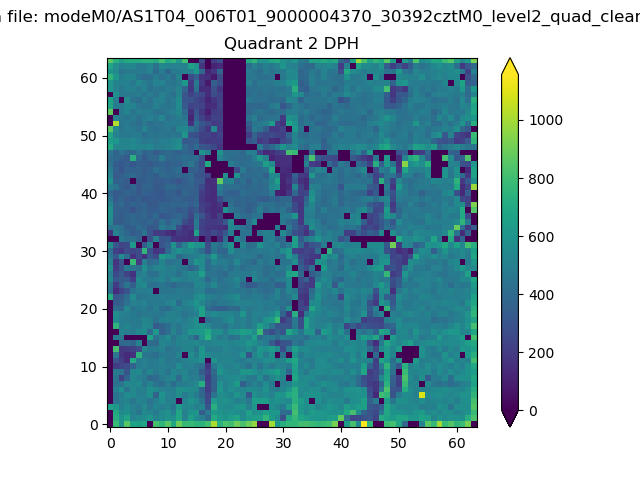
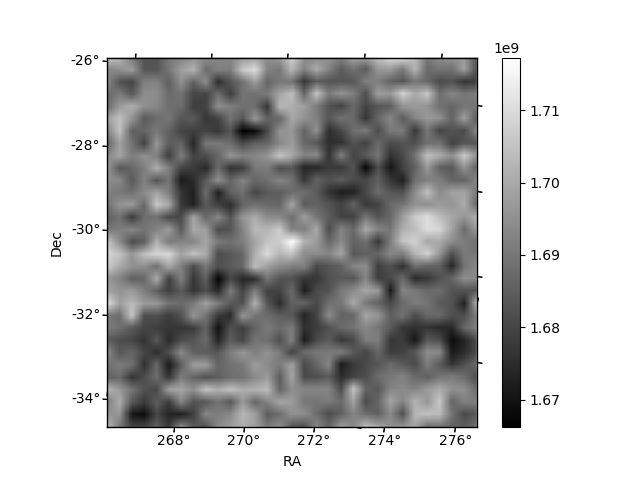
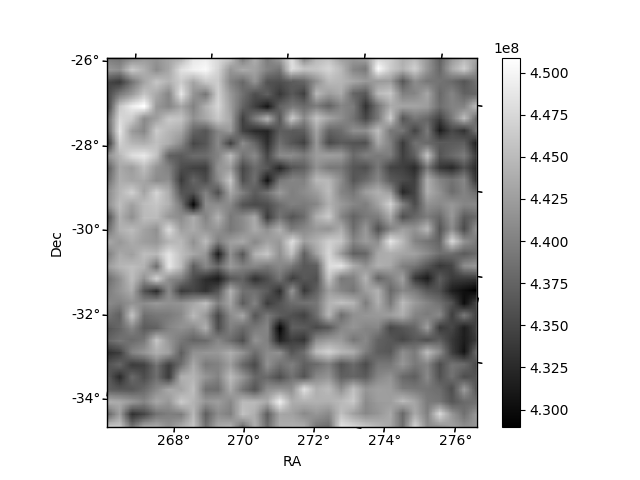
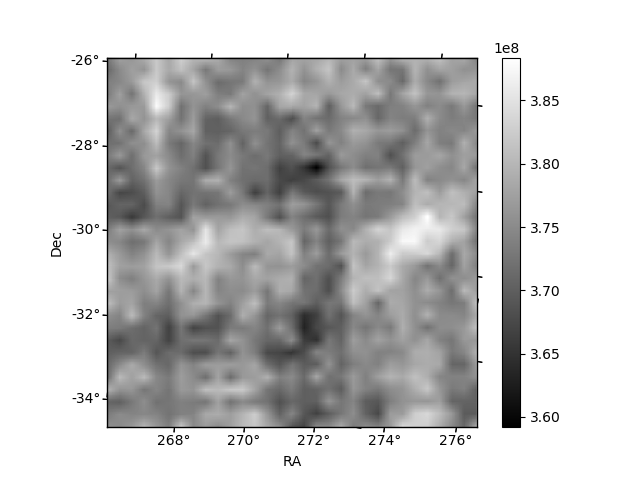
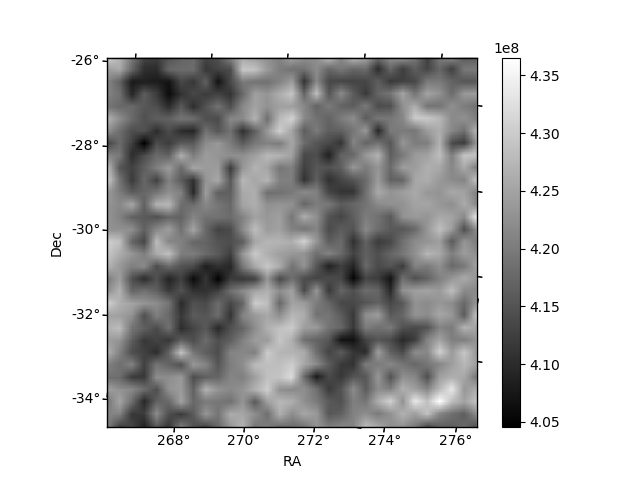
Histogram calculated using DETX and DETY for each event in the final _common_clean file
| Quadrant A | 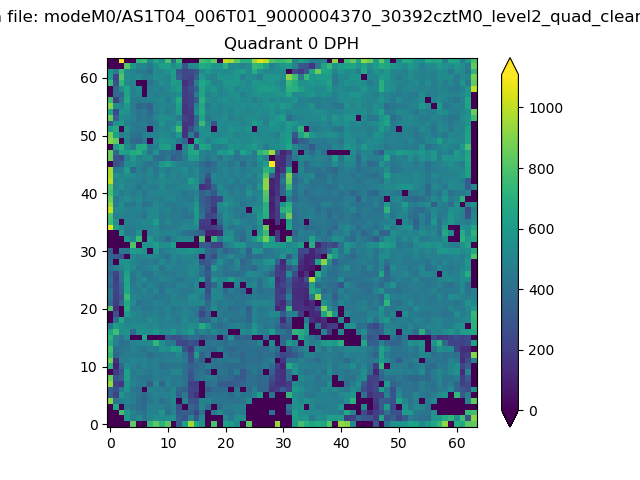 |
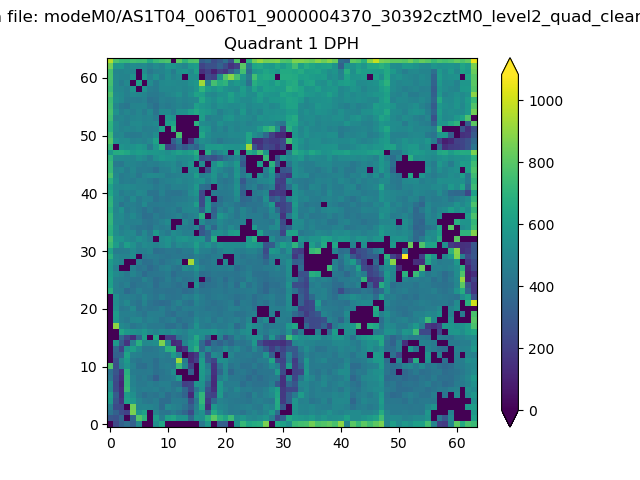 |
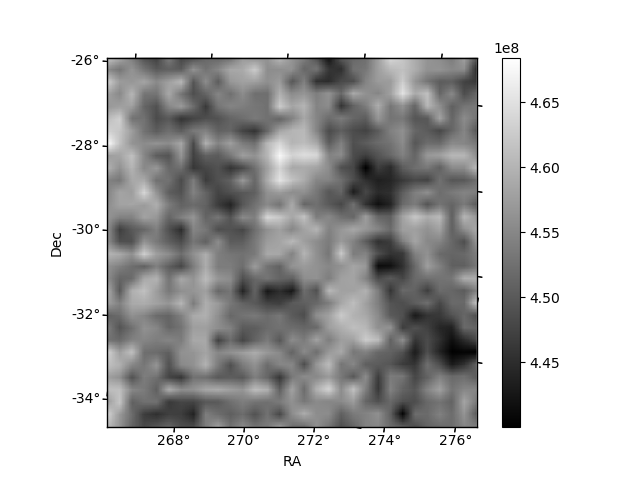
Quadrant B |
|---|---|---|---|
| Quadrant D | 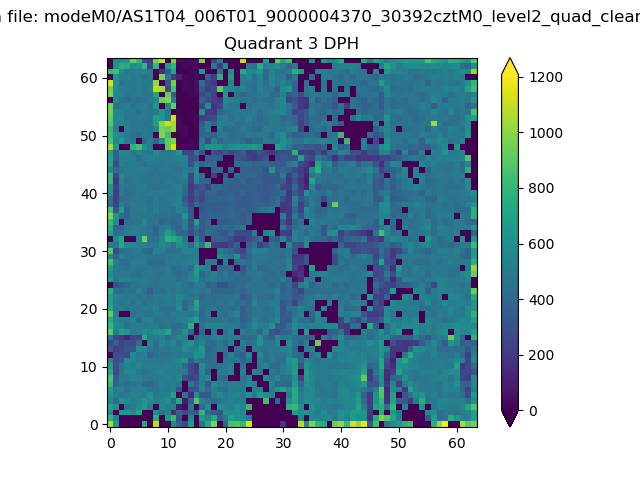 |
 |
Quadrant C |
| Plot type | Count rate plots | Images |
|---|---|---|
| Comparison with Poisson distribution Blue bars denote a histogram of data divided into 1 sec bins. Red curve is a Poisson curve with rate = median count rate of data. |
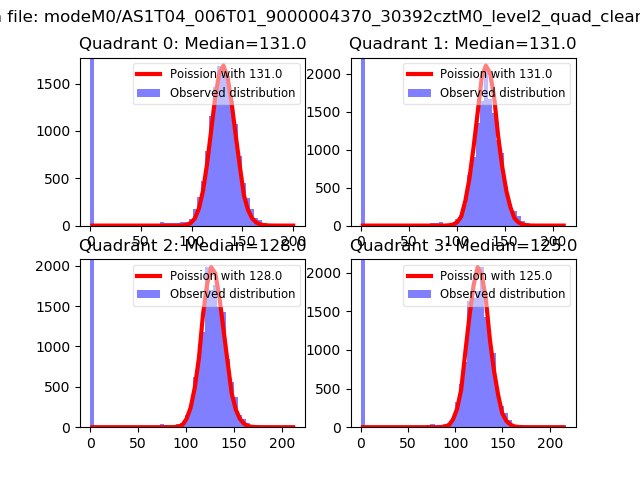 |
 |
| Quadrant-wise count rates Data is divided into 100 sec bins |
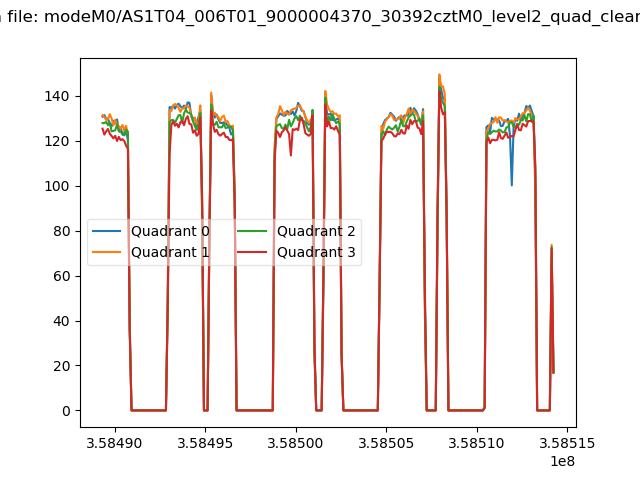 |
|
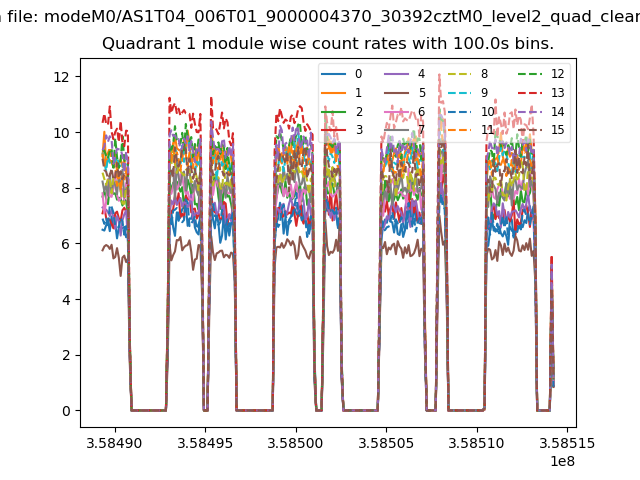
| Module-wise count rates for Quadrant A Data is divided into 100 sec bins |
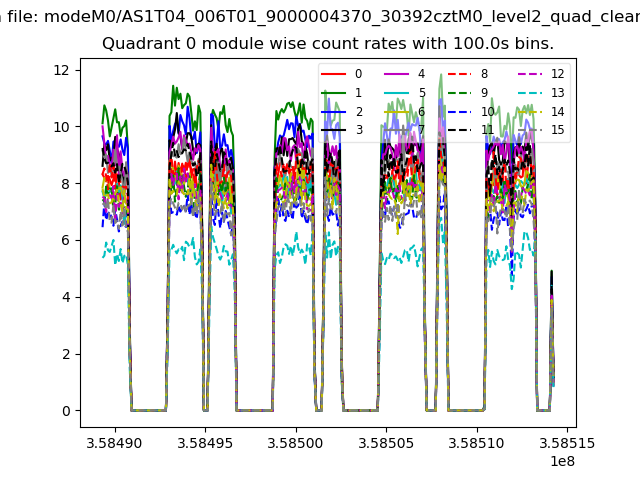 |
 |
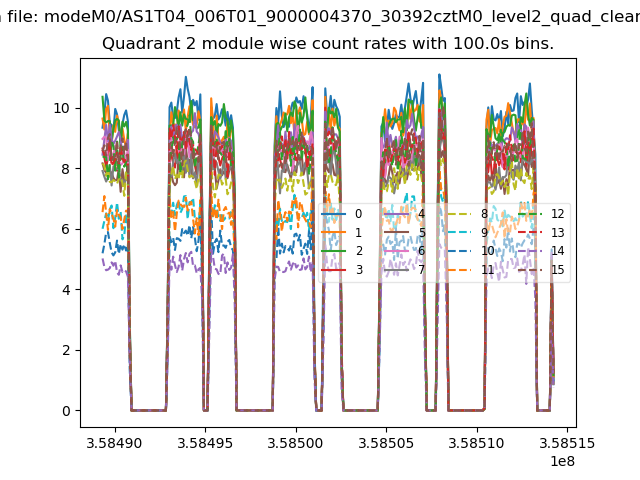
| Module-wise count rates for Quadrant B Data is divided into 100 sec bins |
 |
 |
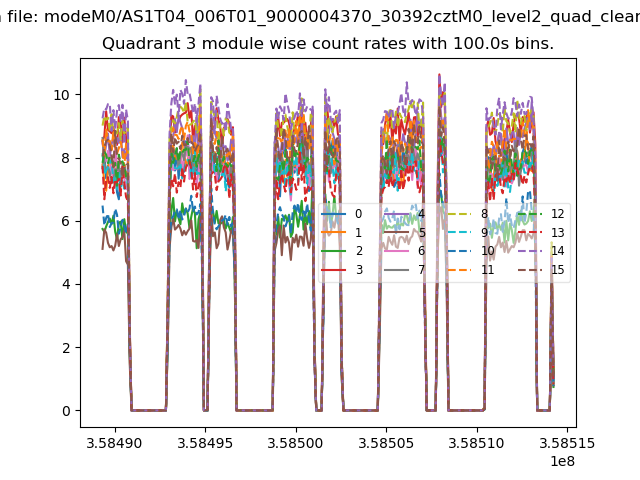
| Module-wise count rates for Quadrant C Data is divided into 100 sec bins |
 |
 |
| Module-wise count rates for Quadrant D Data is divided into 100 sec bins |
 |
 |
| Parameter | Plot |
|---|---|
| CZT HV Monitor | 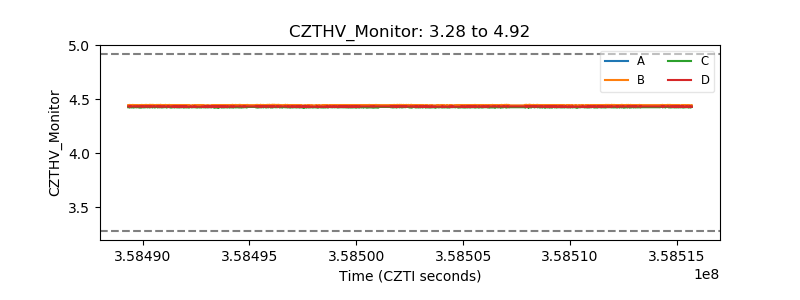 |
| D_VDD | 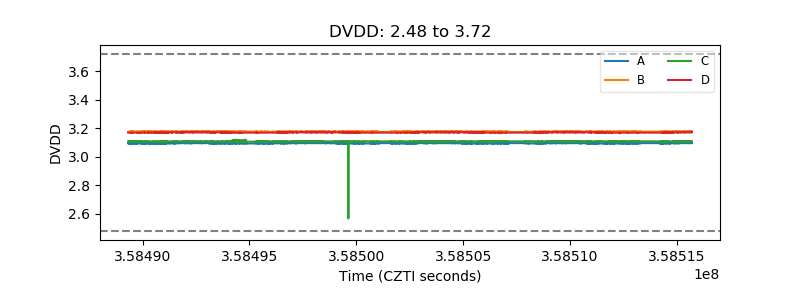 |
| Temperature 1 | 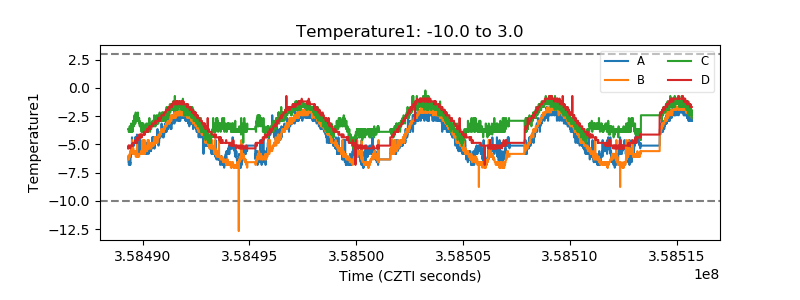 |
| Veto HV Monitor | 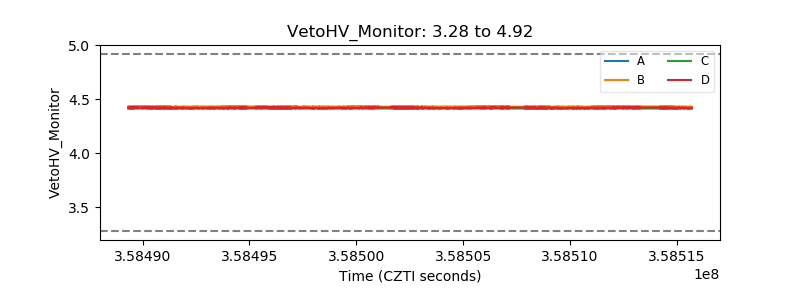 |
| Veto LLD | 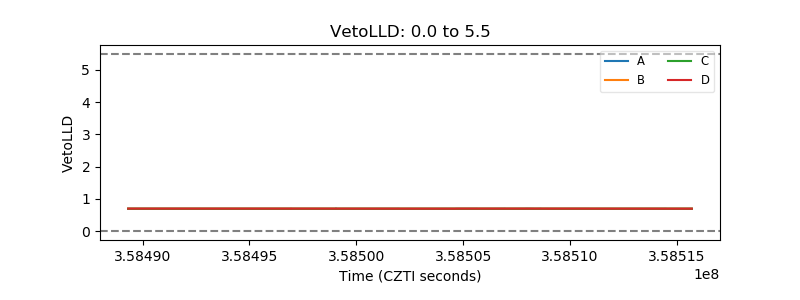 |
| Alpha Counter | 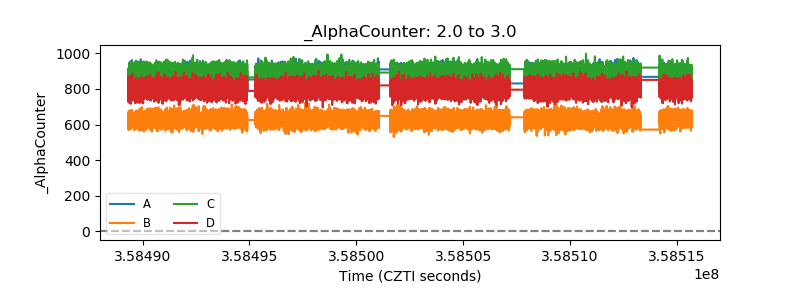 |
| _CPM_Rate | 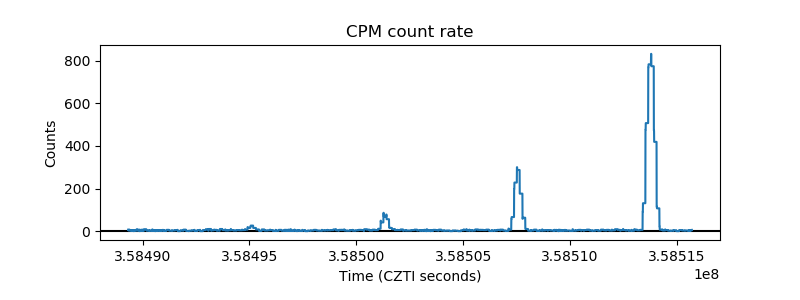 |
| CZT Counter | 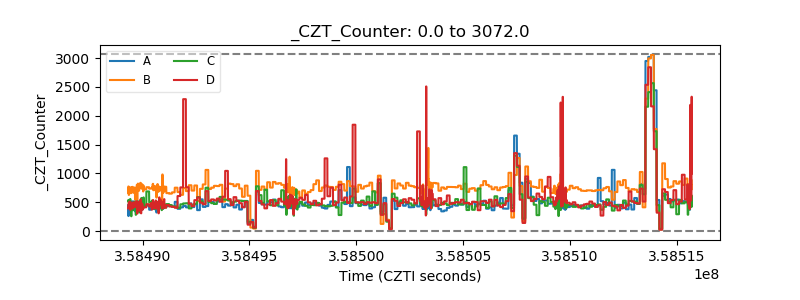 |
| +2.5 Volts monitor | 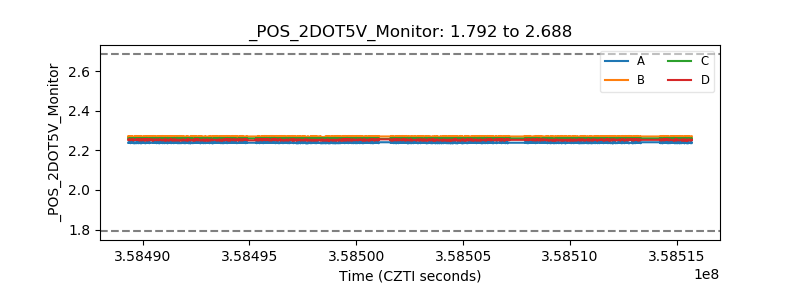 |
| +5 Volts monitor | 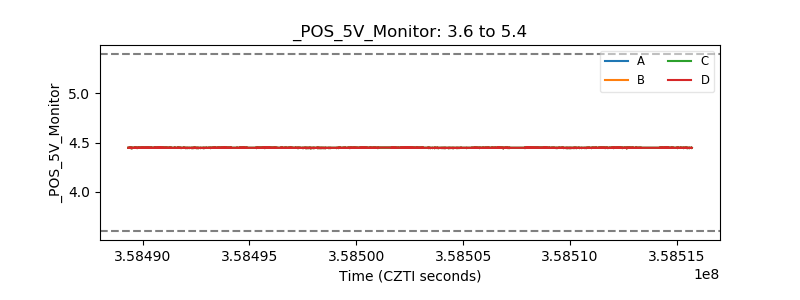 |
| _ROLL_ROT | 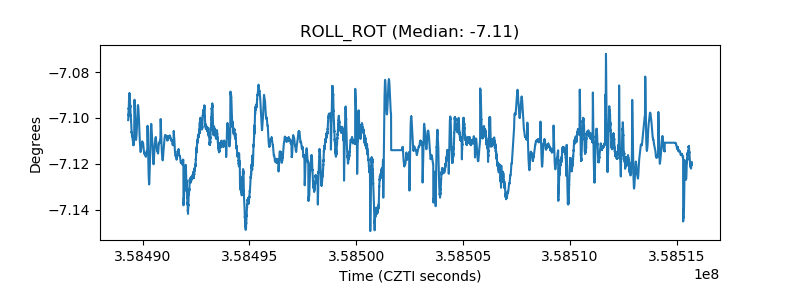 |
| _Roll_DEC | 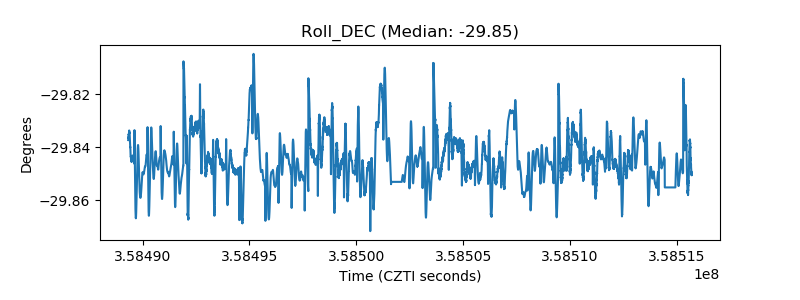 |
| _Roll_RA | 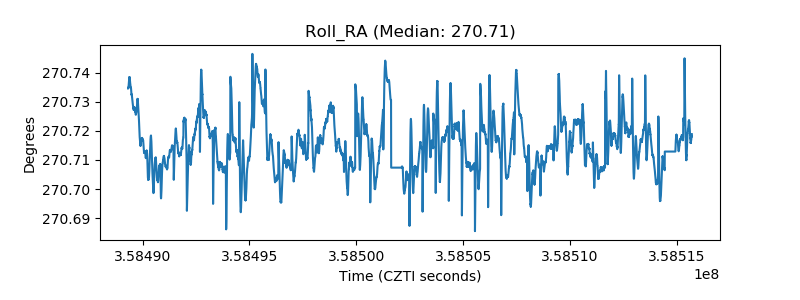 |
| Veto Counter | 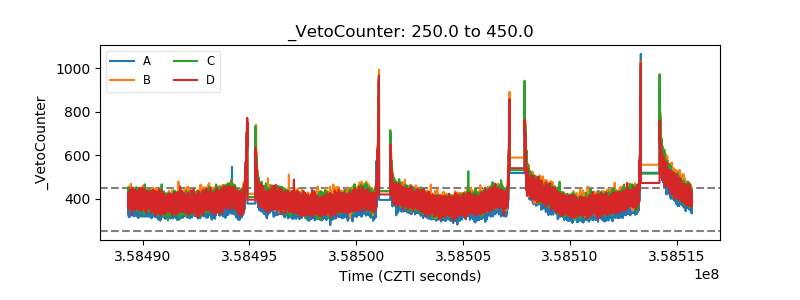 |