| Param | Original file | Final file |
|---|---|---|
| Filename | modeM0/AS1A10_071T46_9000004460_30854cztM0_level2.evt | modeM0/AS1A10_071T46_9000004460_30854cztM0_level2_quad_clean.evt |
| Size (bytes) | 500,382,720 | 57,513,600 |
| Size | 477.2 MB | 54.8 MB |
| Events in quadrant A | 2,319,958 | 361,890 |
| Events in quadrant B | 6,895,207 | 340,750 |
| Events in quadrant C | 2,728,249 | 343,970 |
| Events in quadrant D | 2,871,277 | 343,281 |
| Mode M0 | |||
|---|---|---|---|
| Quadrant | BADHDUFLAG | Total packets | Discarded packets |
| A | 0 | 10213 | 0 |
| B | 0 | 24079 | 0 |
| C | 0 | 11363 | 0 |
| D | 0 | 11493 | 0 |
| Mode SS | |||
|---|---|---|---|
| Quadrant | BADHDUFLAG | Total packets | Discarded packets |
| A | 0 | 102 | 0 |
| B | 0 | 102 | 0 |
| C | 0 | 102 | 0 |
| D | 0 | 102 | 0 |
| Mode M9 | |||
|---|---|---|---|
| Quadrant | BADHDUFLAG | Total packets | Discarded packets |
| A | 0 | 1 | 0 |
| B | 0 | 1 | 0 |
| C | 0 | 1 | 0 |
| D | 0 | 1 | 0 |
| Quadrant | Total seconds | Saturated seconds | Saturation percentage |
|---|---|---|---|
| A | 5010 | 69 | 1.377246% |
| B | 5010 | 926 | 18.483034% |
| C | 5010 | 157 | 3.133733% |
| D | 5010 | 64 | 1.277445% |
Noise dominated data is calculated using 1-second bins in cleaned event files. If a bin has >2000 counts, and if more than 50% of those come from <1% of pixels, then it is considered to be noise-dominated and hence unusable.
| Quadrant | # 1 sec bins | Bins with >0 counts | Bins with >2000 counts | High rate bins dominated by noise | Noise dominated (total time) | Noise dominated (detector-on time) | Marked lightcurve |
|---|---|---|---|---|---|---|---|
| A | 5009 | 5009 | 0 | 0 | 0.00% | 0.00% | 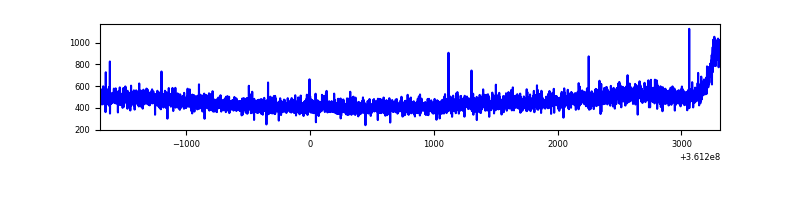 |
| B | 5009 | 5009 | 324 | 324 | 6.47% | 6.47% |  |
| C | 5009 | 5009 | 41 | 41 | 0.82% | 0.82% | 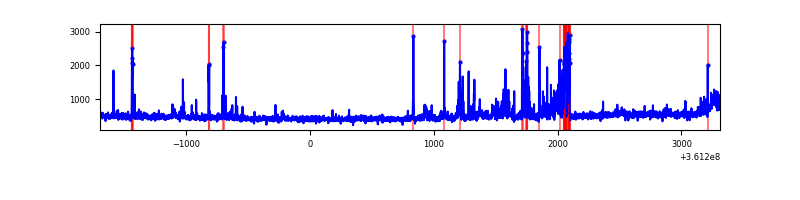 |
| D | 5009 | 5009 | 14 | 14 | 0.28% | 0.28% | 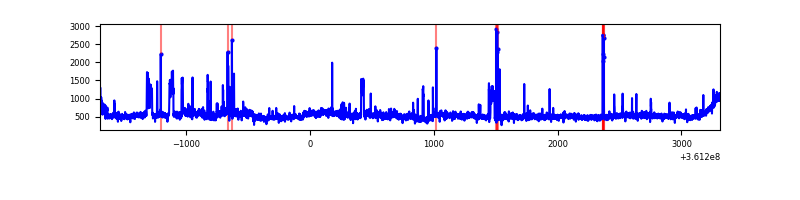 |
Top three noisy pixels from each quadrant. If the there are fewer than three noisy pixels in the level2.evt file, extra rows are filled as -1
| Pixel properties | Quadrant properties | ||||||
|---|---|---|---|---|---|---|---|
| Quadrant | DetID | PixID | Counts | Sigma | Mean | Median | Sigma |
| A | 13 | 254 | 9262 | 70.54 | 600 | 588 | 123.0 |
| A | 3 | 137 | 6158 | 45.3 | 600 | 588 | 123.0 |
| A | 0 | 226 | 4924 | 35.26 | 600 | 588 | 123.0 |
| B | 6 | 36 | 3200211 | 28703.92 | 570 | 556 | 111.5 |
| B | 6 | 159 | 1403974 | 12589.98 | 570 | 556 | 111.5 |
| B | 4 | 80 | 22239 | 194.52 | 570 | 556 | 111.5 |
| C | 2 | 16 | 322926 | 2356.21 | 572 | 576 | 136.8 |
| C | 14 | 238 | 91704 | 666.1 | 572 | 576 | 136.8 |
| C | 0 | 10 | 59490 | 430.63 | 572 | 576 | 136.8 |
| D | 8 | 195 | 564933 | 4082.1 | 578 | 565 | 138.3 |
| D | 2 | 250 | 59451 | 425.93 | 578 | 565 | 138.3 |
| D | 2 | 234 | 21625 | 152.33 | 578 | 565 | 138.3 |
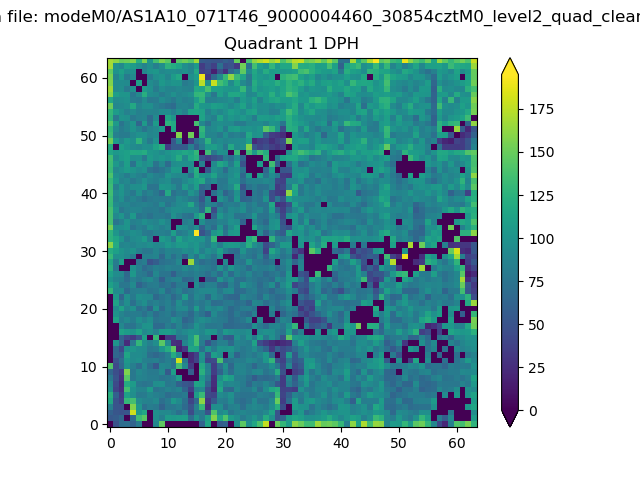
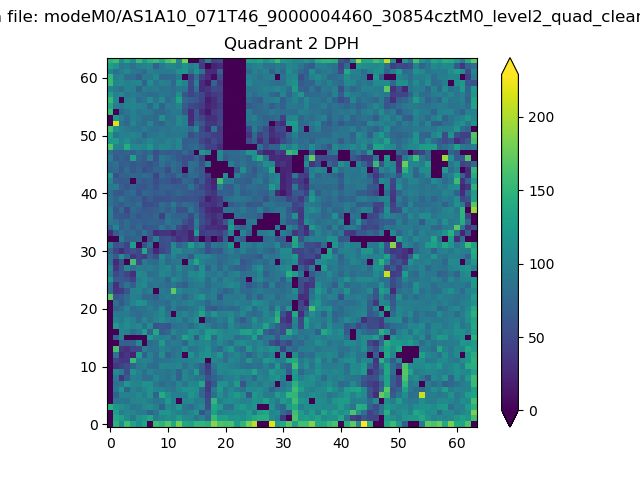
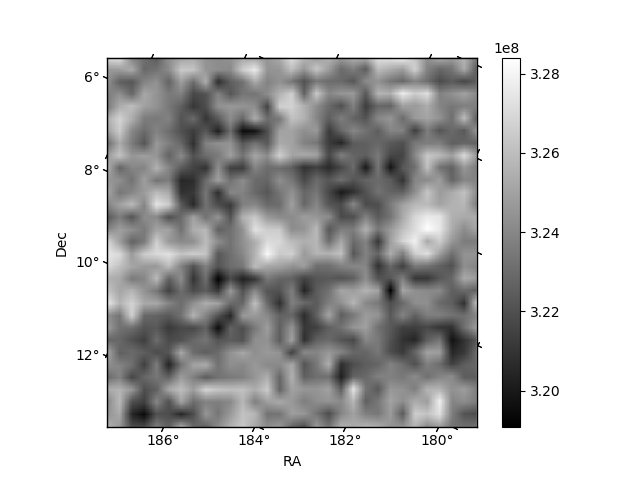
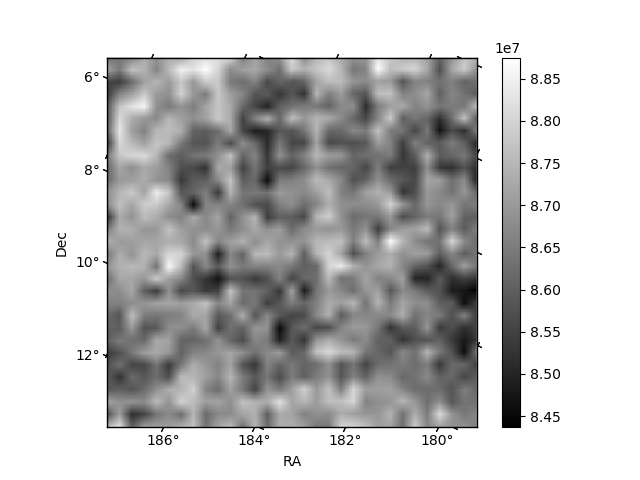
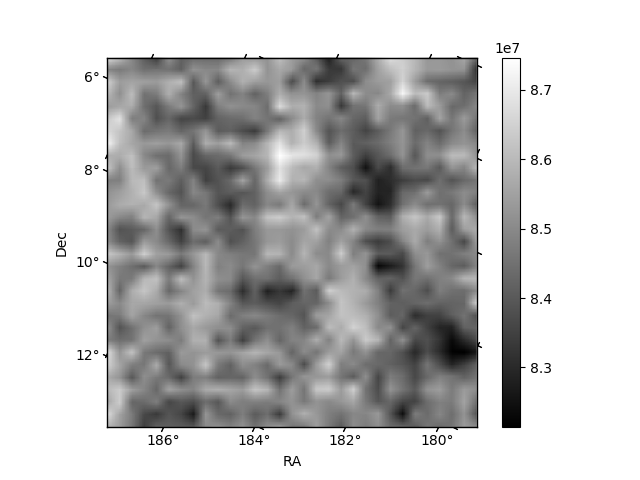
Histogram calculated using DETX and DETY for each event in the final _common_clean file
| Quadrant A | 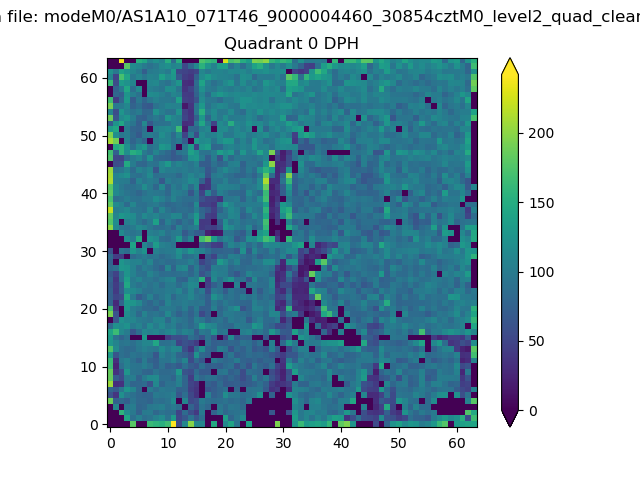 |
 |
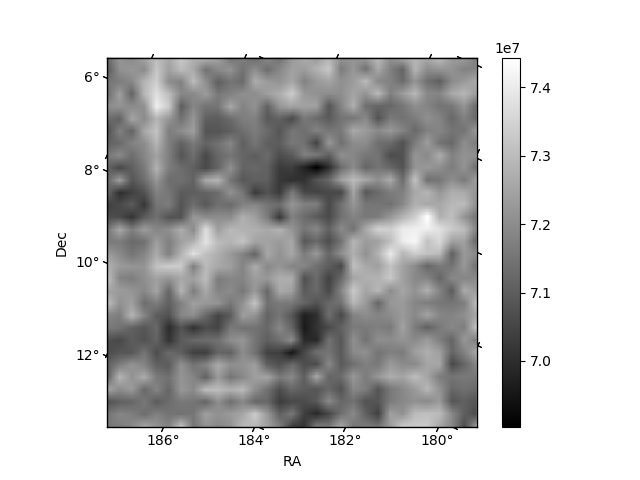
Quadrant B |
|---|---|---|---|
| Quadrant D | 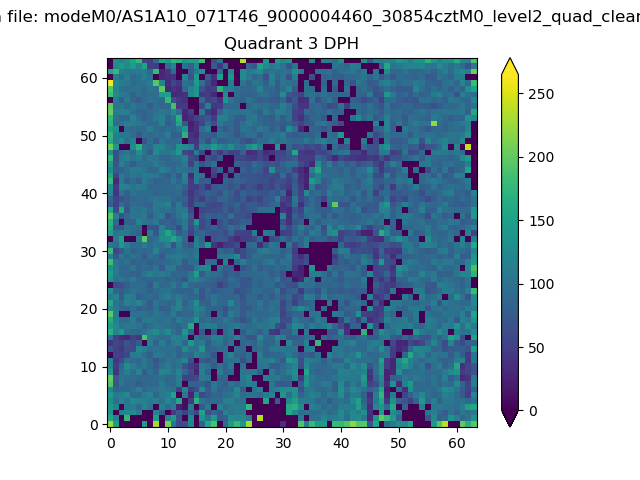 |
 |
Quadrant C |
| Plot type | Count rate plots | Images |
|---|---|---|
| Comparison with Poisson distribution Blue bars denote a histogram of data divided into 1 sec bins. Red curve is a Poisson curve with rate = median count rate of data. |
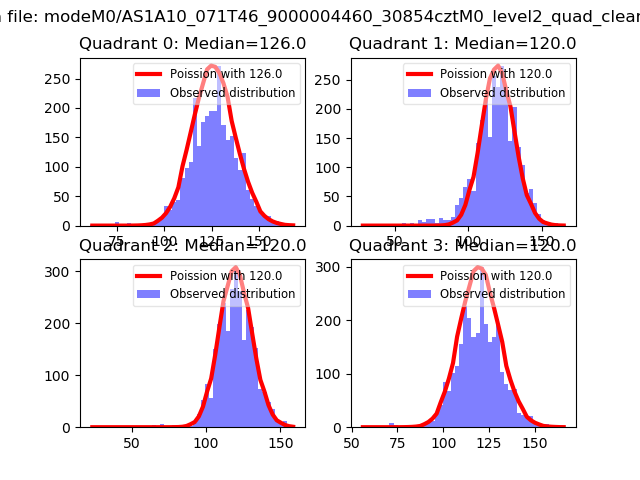 |
 |
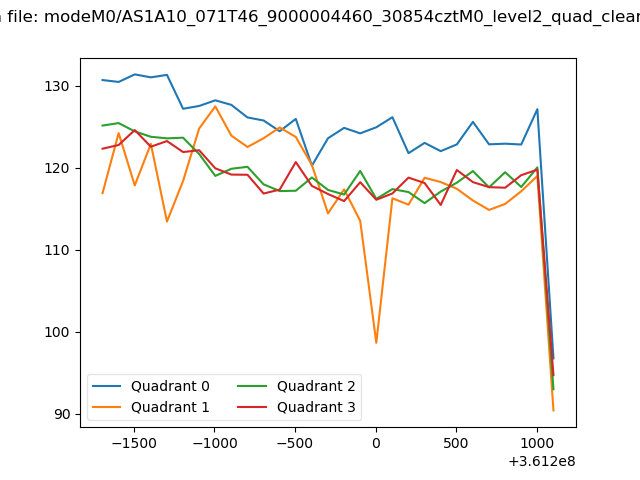
| Quadrant-wise count rates Data is divided into 100 sec bins |
 |
|
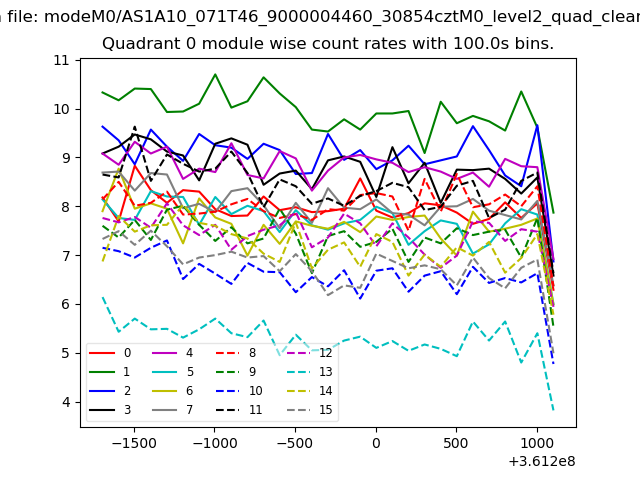
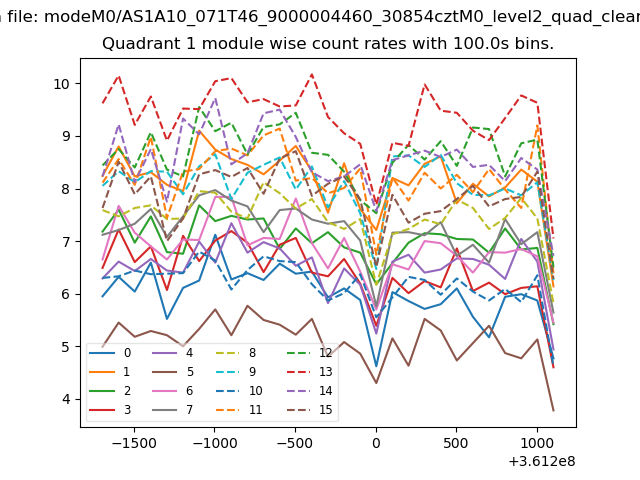
| Module-wise count rates for Quadrant A Data is divided into 100 sec bins |
 |
 |
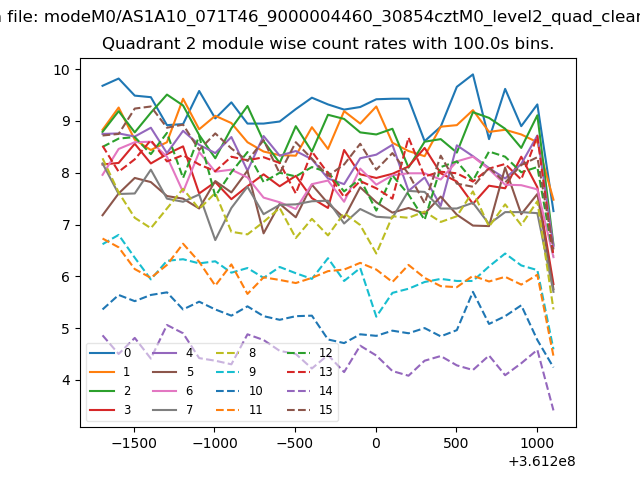
| Module-wise count rates for Quadrant B Data is divided into 100 sec bins |
 |
 |
| Module-wise count rates for Quadrant C Data is divided into 100 sec bins |
 |
 |
| Module-wise count rates for Quadrant D Data is divided into 100 sec bins |
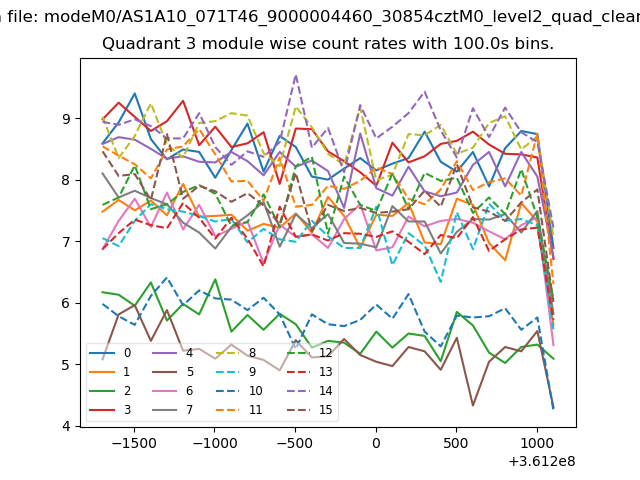 |
 |
| Parameter | Plot |
|---|---|
| CZT HV Monitor | 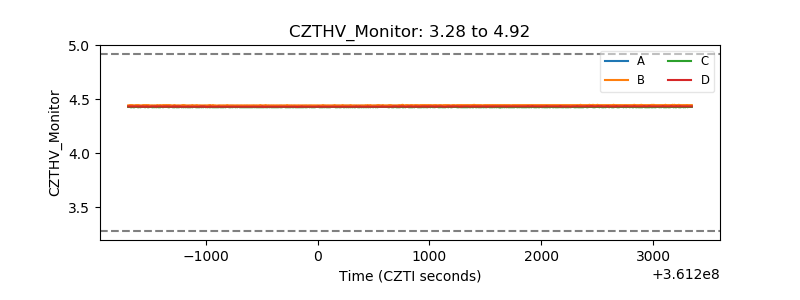 |
| D_VDD | 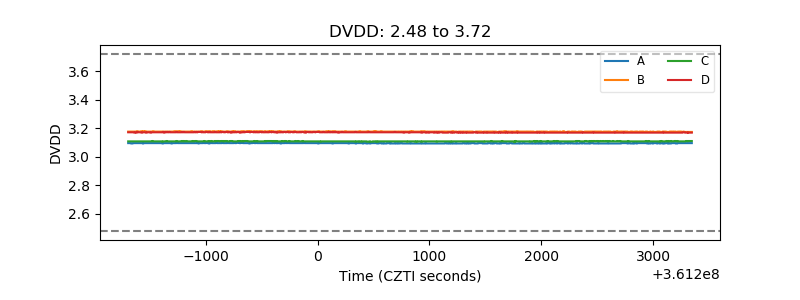 |
| Temperature 1 | 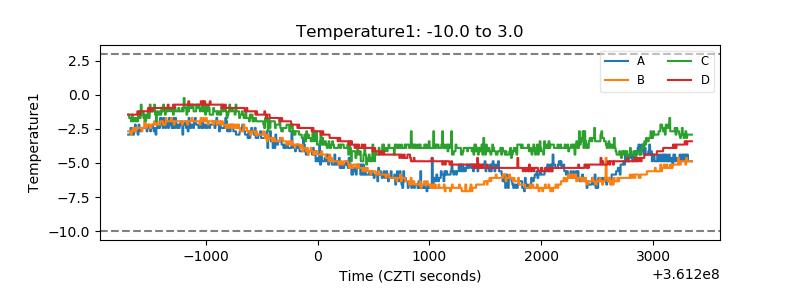 |
| Veto HV Monitor | 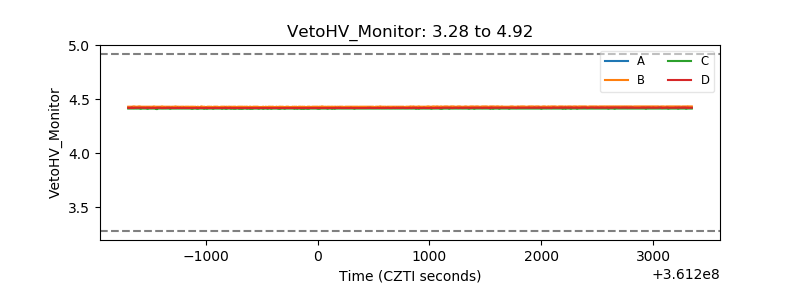 |
| Veto LLD | 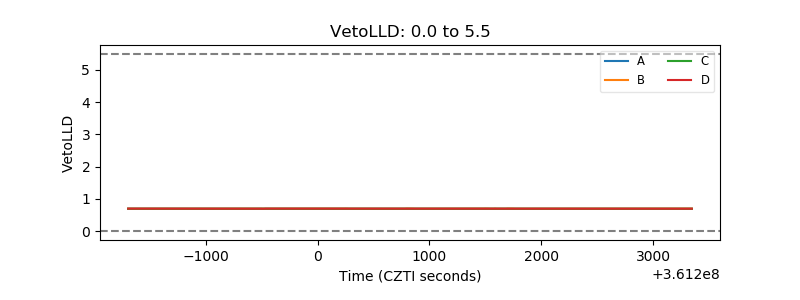 |
| Alpha Counter | 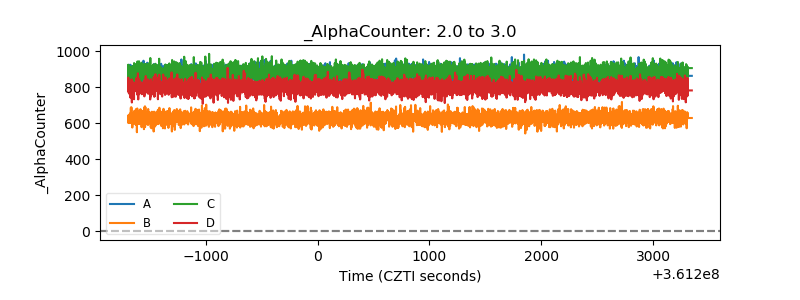 |
| _CPM_Rate | 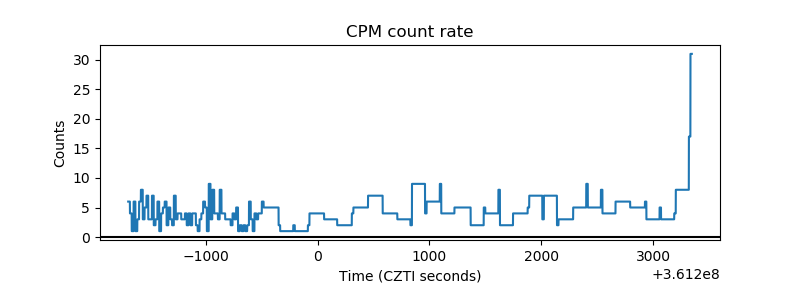 |
| CZT Counter | 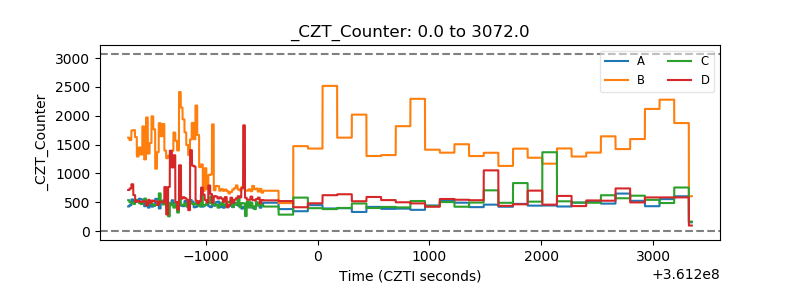 |
| +2.5 Volts monitor | 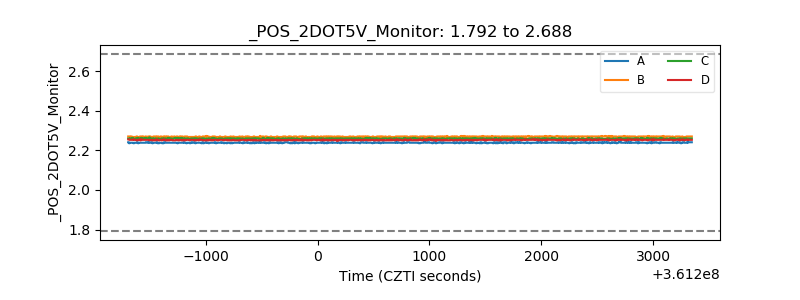 |
| +5 Volts monitor | 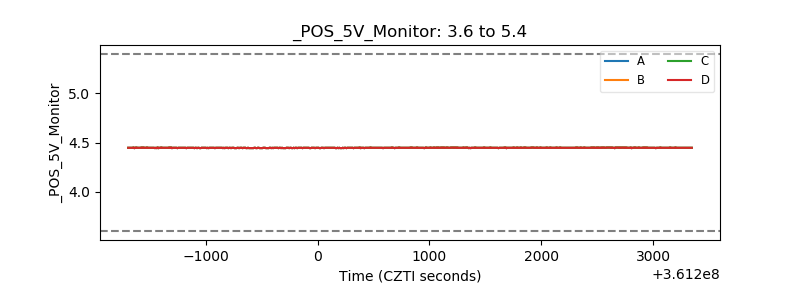 |
| _ROLL_ROT | 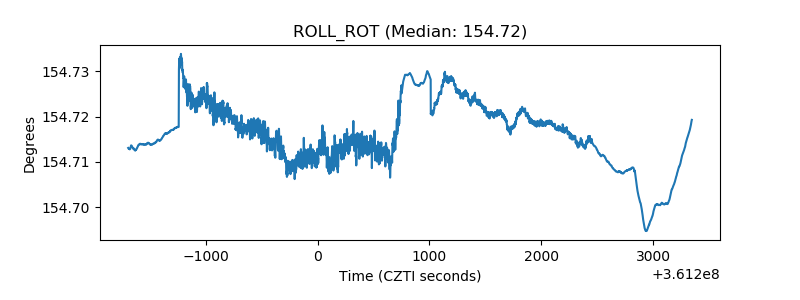 |
| _Roll_DEC | 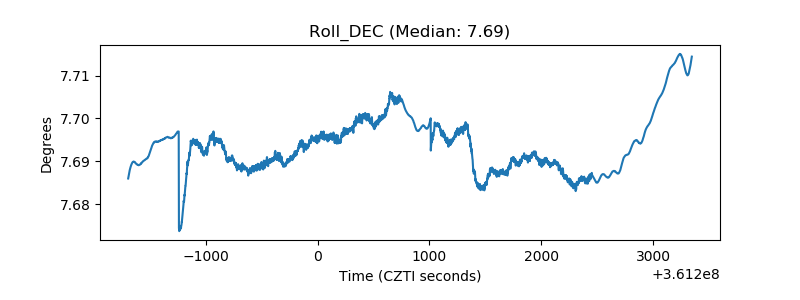 |
| _Roll_RA | 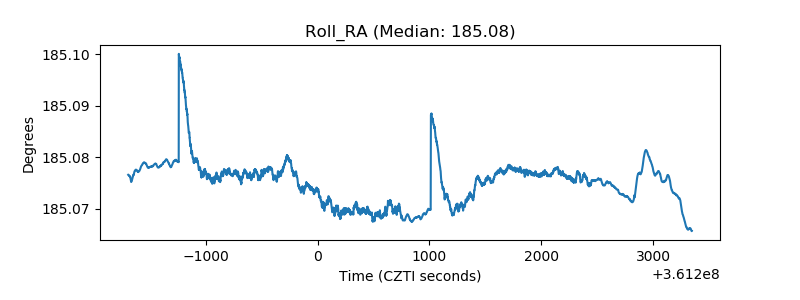 |
| Veto Counter | 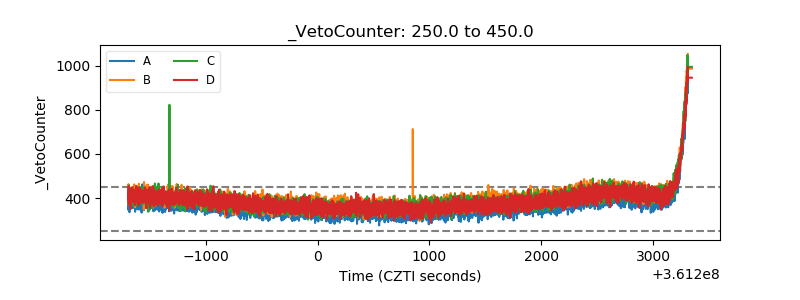 |