| Param | Original file | Final file |
|---|---|---|
| Filename | modeM0/AS1C06_004T01_9000004466_30902cztM0_level2.evt | modeM0/AS1C06_004T01_9000004466_30902cztM0_level2_quad_clean.evt |
| Size (bytes) | 571,345,920 | 103,872,960 |
| Size | 544.9 MB | 99.1 MB |
| Events in quadrant A | 3,079,241 | 701,600 |
| Events in quadrant B | 5,972,458 | 688,367 |
| Events in quadrant C | 3,594,656 | 665,137 |
| Events in quadrant D | 4,248,175 | 668,754 |
| Mode M0 | |||
|---|---|---|---|
| Quadrant | BADHDUFLAG | Total packets | Discarded packets |
| A | 0 | 13196 | 1 |
| B | 0 | 22037 | 1 |
| C | 0 | 14786 | 1 |
| D | 0 | 16810 | 1 |
| Mode M9 | |||
|---|---|---|---|
| Quadrant | BADHDUFLAG | Total packets | Discarded packets |
| A | 0 | 13 | 0 |
| B | 0 | 13 | 0 |
| C | 0 | 13 | 0 |
| D | 0 | 13 | 0 |
| Mode SS | |||
|---|---|---|---|
| Quadrant | BADHDUFLAG | Total packets | Discarded packets |
| A | 0 | 122 | 0 |
| B | 0 | 122 | 0 |
| C | 0 | 122 | 0 |
| D | 0 | 122 | 0 |
| Quadrant | Total seconds | Saturated seconds | Saturation percentage |
|---|---|---|---|
| A | 6045 | 42 | 0.694789% |
| B | 6045 | 170 | 2.812242% |
| C | 6045 | 519 | 8.585608% |
| D | 6045 | 113 | 1.869313% |
Noise dominated data is calculated using 1-second bins in cleaned event files. If a bin has >2000 counts, and if more than 50% of those come from <1% of pixels, then it is considered to be noise-dominated and hence unusable.
| Quadrant | # 1 sec bins | Bins with >0 counts | Bins with >2000 counts | High rate bins dominated by noise | Noise dominated (total time) | Noise dominated (detector-on time) | Marked lightcurve |
|---|---|---|---|---|---|---|---|
| A | 7300 | 6045 | 0 | 0 | 0.00% | 0.00% | 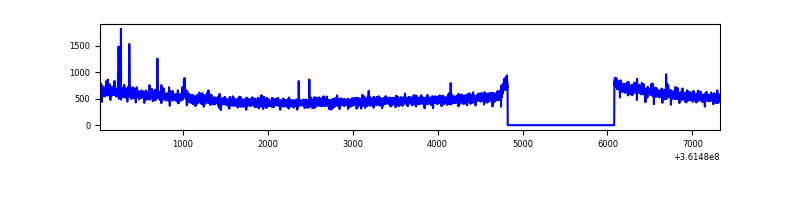 |
| B | 7300 | 6045 | 38 | 38 | 0.52% | 0.63% | 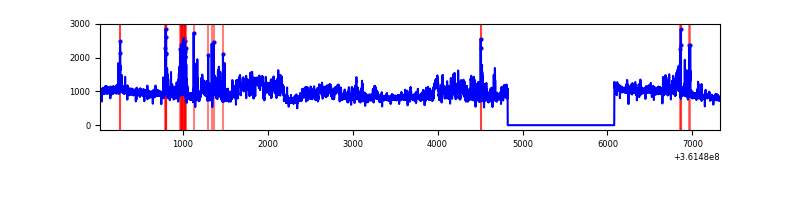 |
| C | 7300 | 6045 | 3 | 3 | 0.04% | 0.05% | 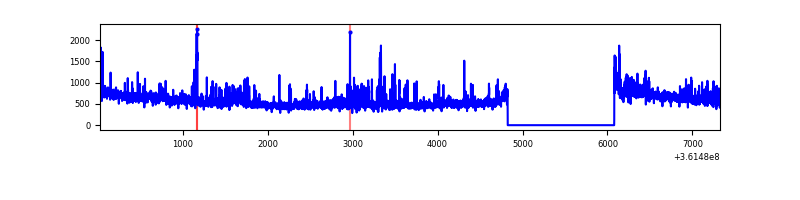 |
| D | 7300 | 6045 | 56 | 56 | 0.77% | 0.93% | 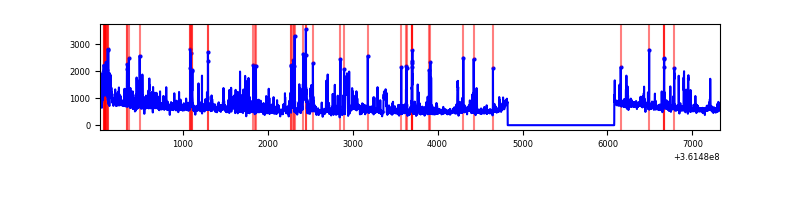 |
Top three noisy pixels from each quadrant. If the there are fewer than three noisy pixels in the level2.evt file, extra rows are filled as -1
| Pixel properties | Quadrant properties | ||||||
|---|---|---|---|---|---|---|---|
| Quadrant | DetID | PixID | Counts | Sigma | Mean | Median | Sigma |
| A | 0 | 13 | 11596 | 68.95 | 793 | 779 | 156.9 |
| A | 13 | 254 | 11403 | 67.72 | 793 | 779 | 156.9 |
| A | 0 | 191 | 7592 | 43.43 | 793 | 779 | 156.9 |
| B | 6 | 159 | 1874584 | 12848.12 | 785 | 767 | 145.8 |
| B | 6 | 36 | 728029 | 4986.59 | 785 | 767 | 145.8 |
| B | 0 | 190 | 209884 | 1433.84 | 785 | 767 | 145.8 |
| C | 14 | 238 | 238223 | 1388.47 | 740 | 746 | 171.0 |
| C | 3 | 233 | 184034 | 1071.64 | 740 | 746 | 171.0 |
| C | 14 | 254 | 167386 | 974.31 | 740 | 746 | 171.0 |
| D | 8 | 195 | 729035 | 4027.22 | 771 | 756 | 180.8 |
| D | 12 | 218 | 114747 | 630.34 | 771 | 756 | 180.8 |
| D | 10 | 1 | 111944 | 614.84 | 771 | 756 | 180.8 |
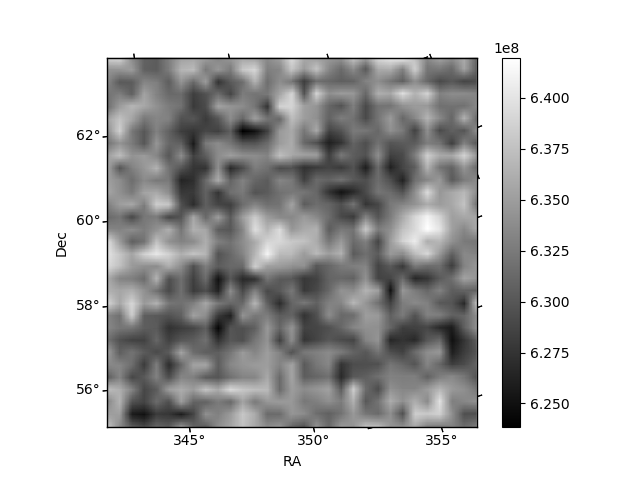
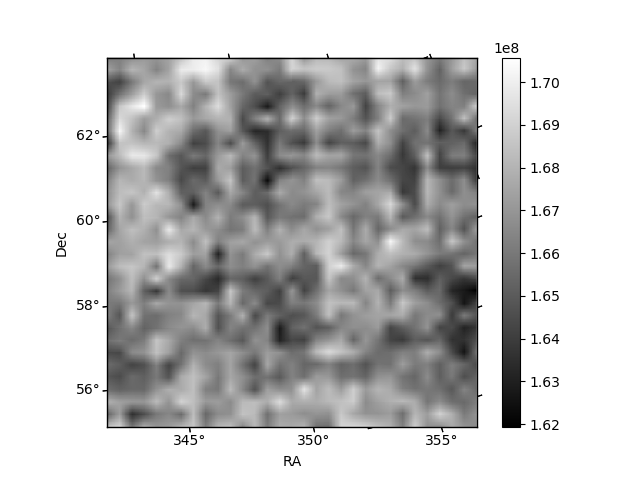
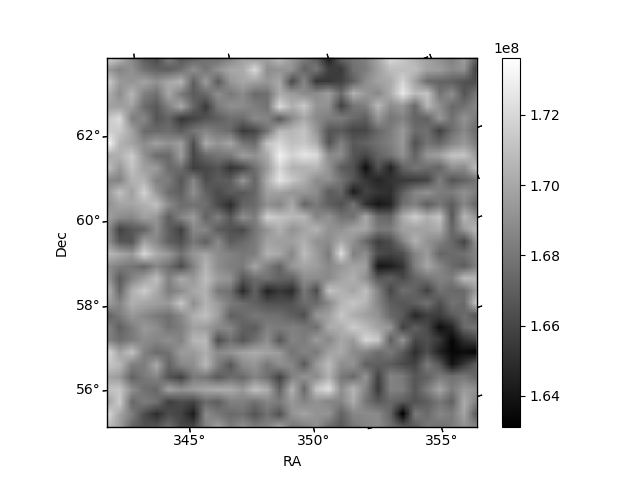
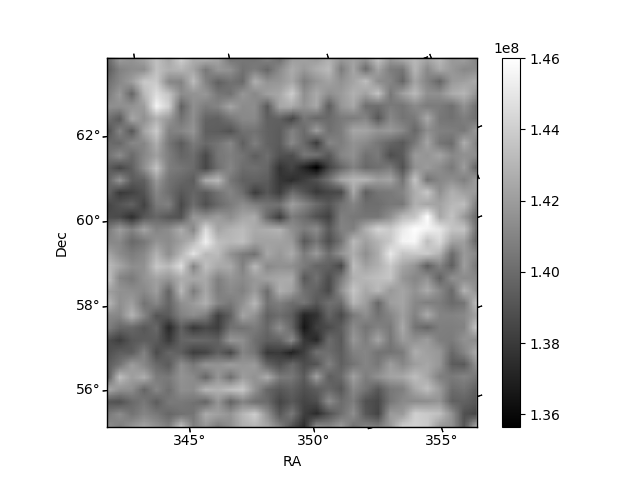
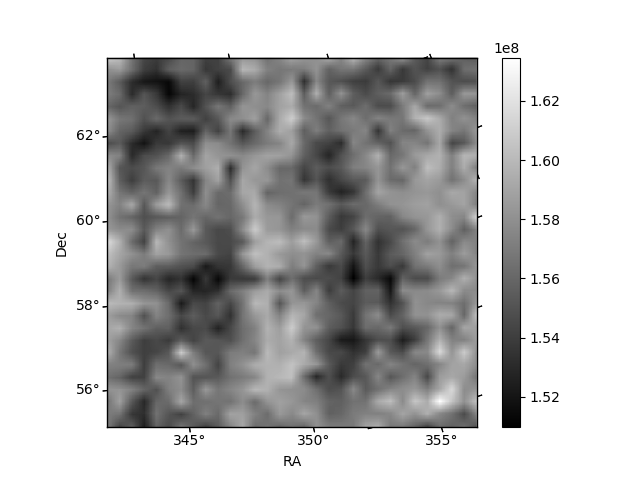
Histogram calculated using DETX and DETY for each event in the final _common_clean file
| Quadrant A | 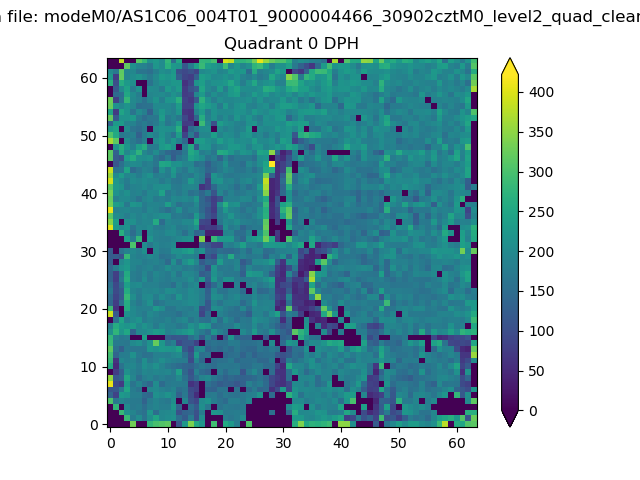 |
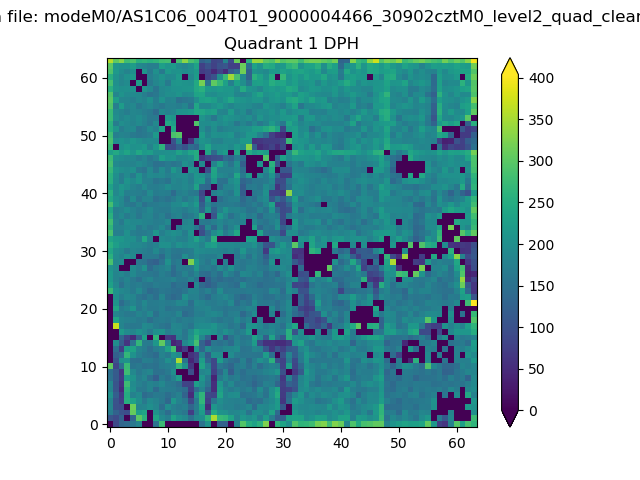 |
Quadrant B |
|---|---|---|---|
| Quadrant D | 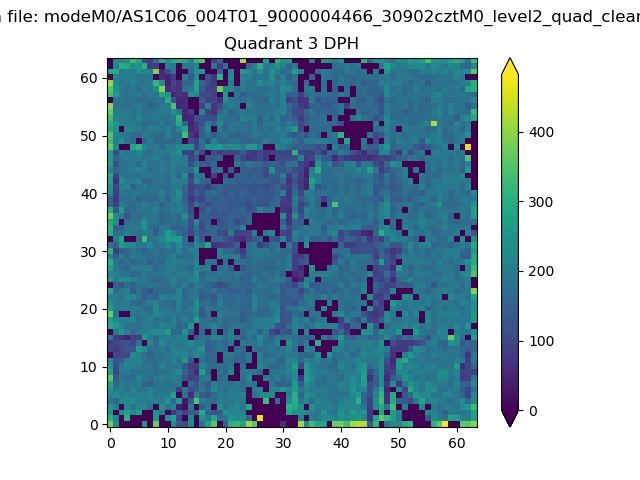 |
 |
Quadrant C |
| Plot type | Count rate plots | Images |
|---|---|---|
| Comparison with Poisson distribution Blue bars denote a histogram of data divided into 1 sec bins. Red curve is a Poisson curve with rate = median count rate of data. |
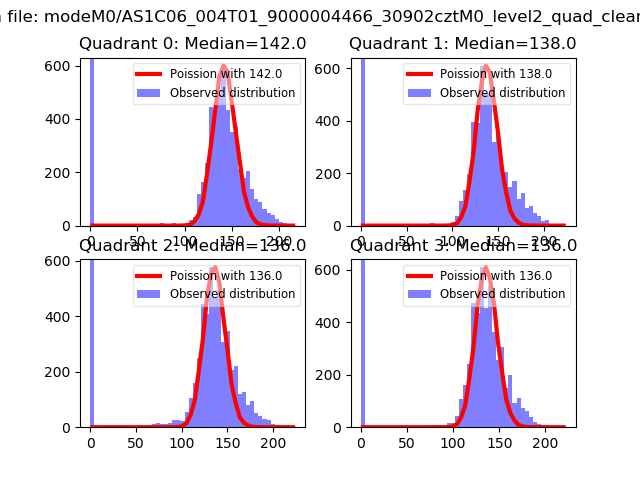 |
 |
| Quadrant-wise count rates Data is divided into 100 sec bins |
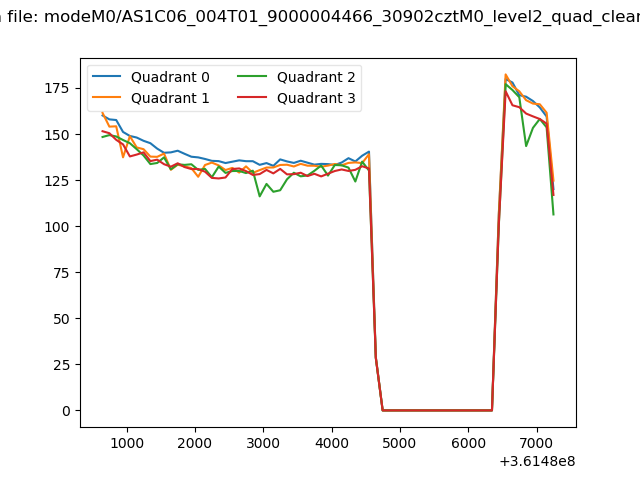 |
|
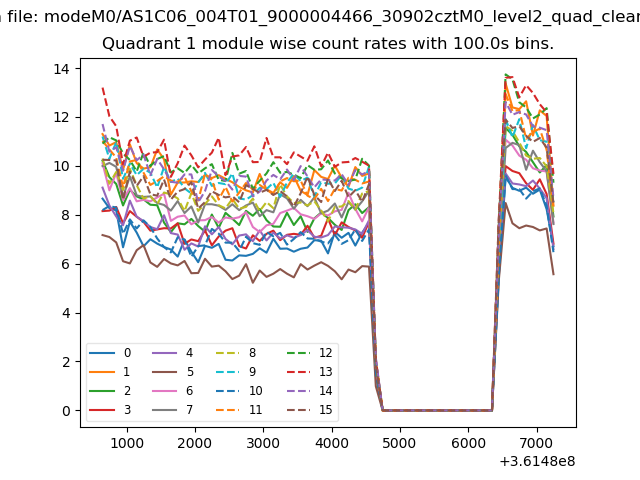
| Module-wise count rates for Quadrant A Data is divided into 100 sec bins |
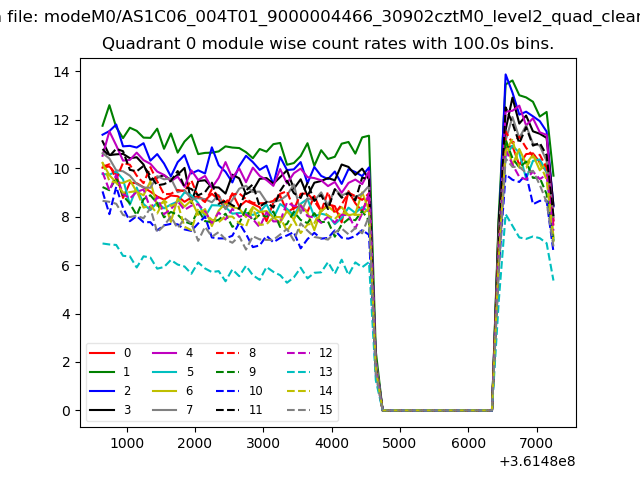 |
 |
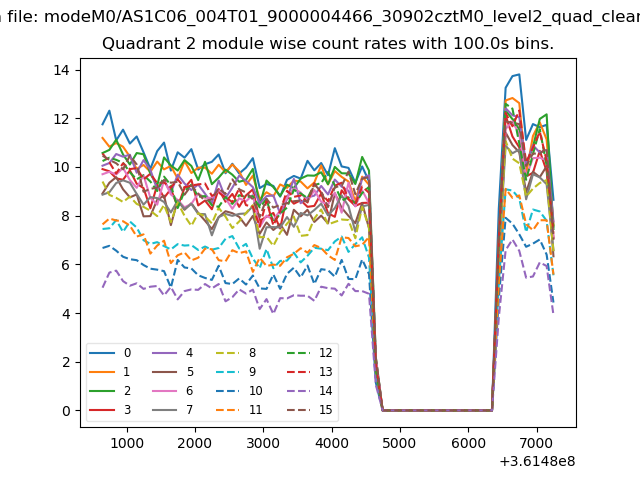
| Module-wise count rates for Quadrant B Data is divided into 100 sec bins |
 |
 |
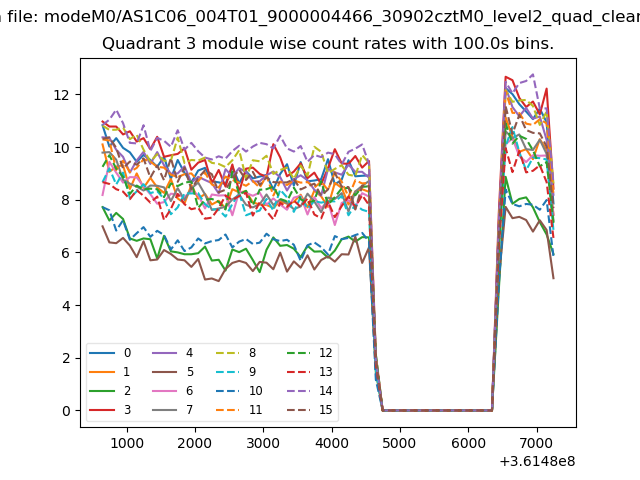
| Module-wise count rates for Quadrant C Data is divided into 100 sec bins |
 |
 |
| Module-wise count rates for Quadrant D Data is divided into 100 sec bins |
 |
 |
| Parameter | Plot |
|---|---|
| CZT HV Monitor | 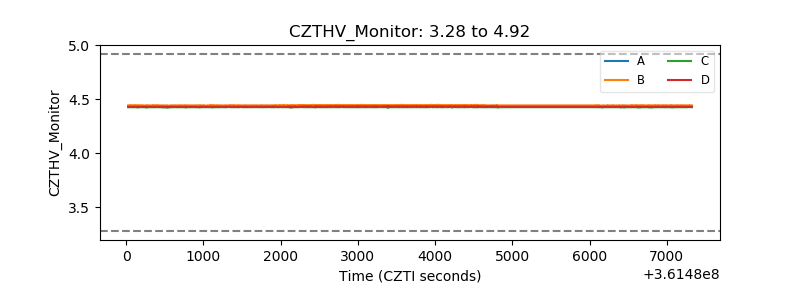 |
| D_VDD | 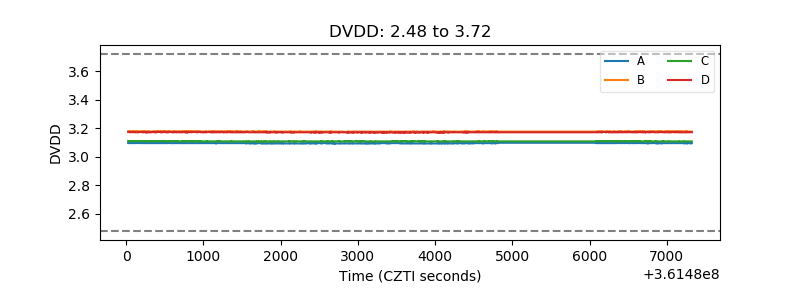 |
| Temperature 1 | 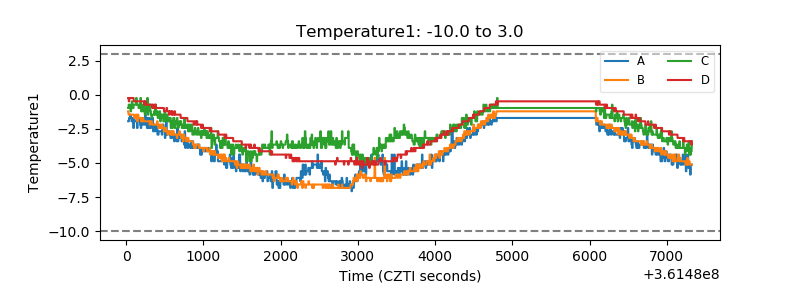 |
| Veto HV Monitor | 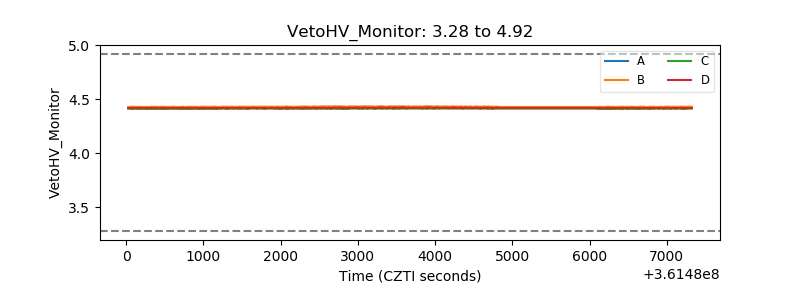 |
| Veto LLD | 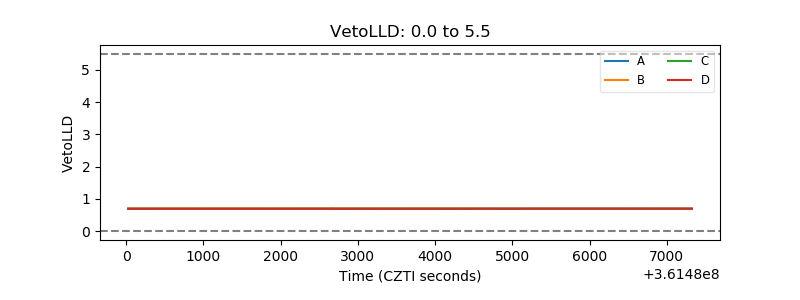 |
| Alpha Counter | 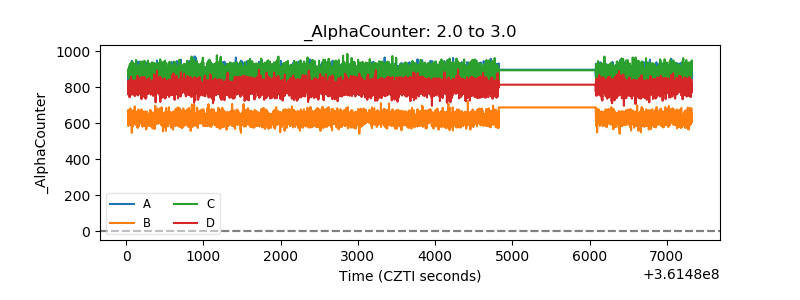 |
| _CPM_Rate | 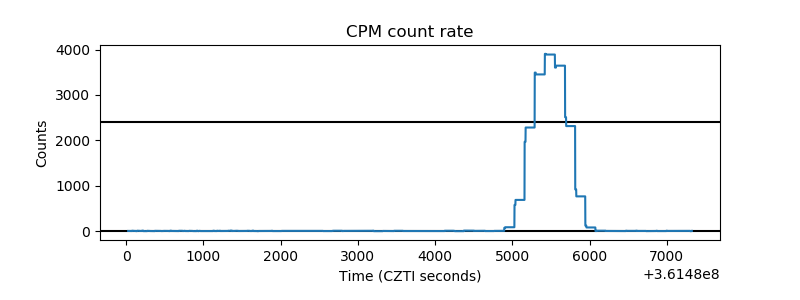 |
| CZT Counter | 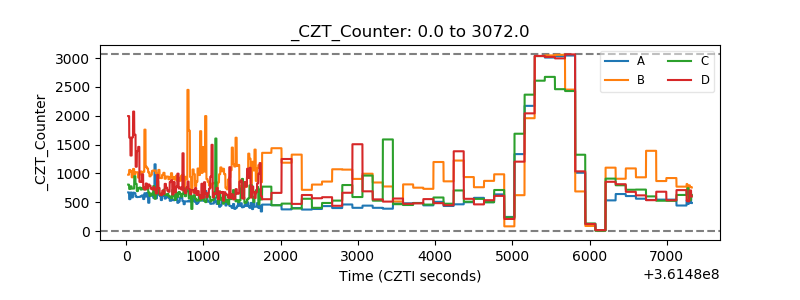 |
| +2.5 Volts monitor | 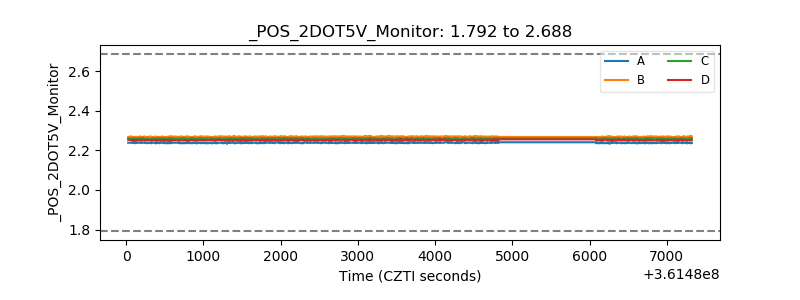 |
| +5 Volts monitor | 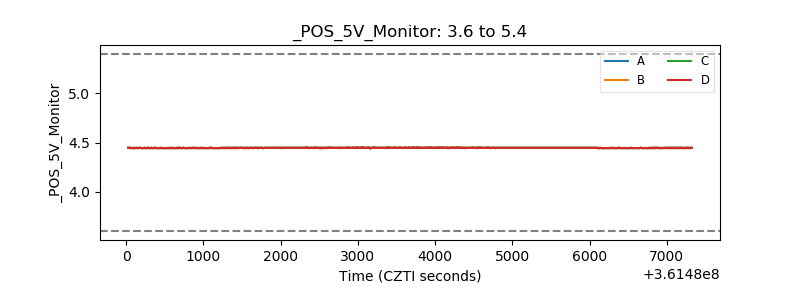 |
| _ROLL_ROT | 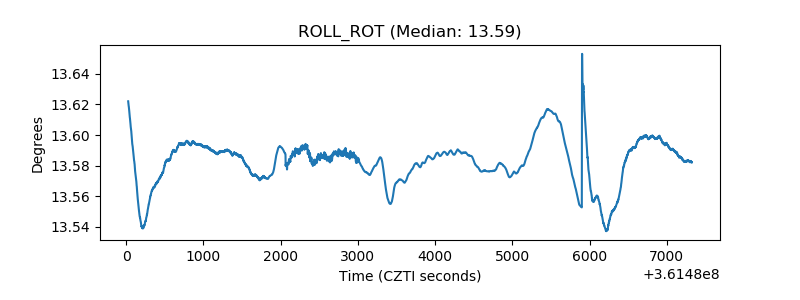 |
| _Roll_DEC | 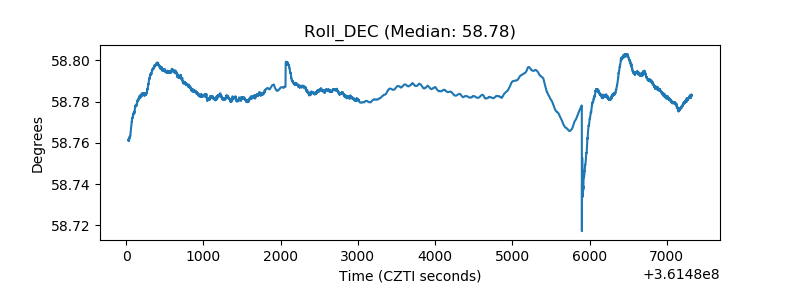 |
| _Roll_RA | 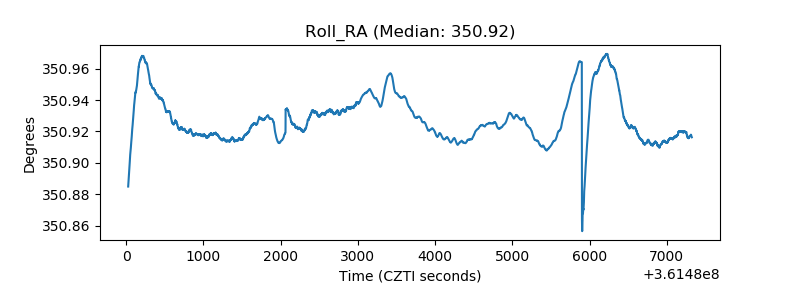 |
| Veto Counter | 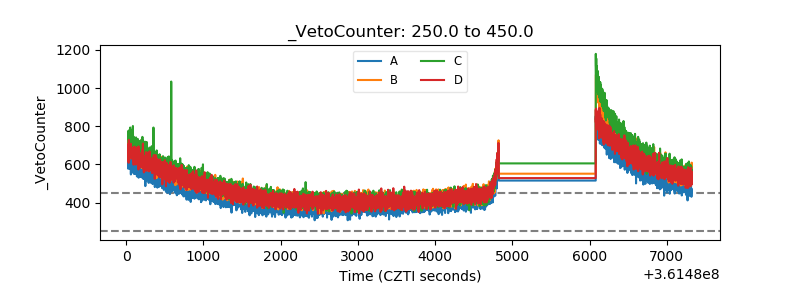 |