| Param | Original file | Final file |
|---|---|---|
| Filename | modeM0/AS1A10_059T01_9000004634_31759cztM0_level2.evt | modeM0/AS1A10_059T01_9000004634_31759cztM0_level2_quad_clean.evt |
| Size (bytes) | 853,600,320 | 91,140,480 |
| Size | 814.1 MB | 86.9 MB |
| Events in quadrant A | 8,075,053 | 575,811 |
| Events in quadrant B | 6,574,366 | 593,188 |
| Events in quadrant C | 5,789,111 | 579,872 |
| Events in quadrant D | 5,005,588 | 587,421 |
| Mode M9 | |||
|---|---|---|---|
| Quadrant | BADHDUFLAG | Total packets | Discarded packets |
| A | 0 | 13 | 0 |
| B | 0 | 13 | 0 |
| C | 0 | 13 | 0 |
| D | 0 | 13 | 0 |
| Mode SS | |||
|---|---|---|---|
| Quadrant | BADHDUFLAG | Total packets | Discarded packets |
| A | 0 | 124 | 0 |
| B | 0 | 124 | 0 |
| C | 0 | 124 | 0 |
| D | 0 | 124 | 0 |
| Mode M0 | |||
|---|---|---|---|
| Quadrant | BADHDUFLAG | Total packets | Discarded packets |
| A | 0 | 28125 | 1 |
| B | 0 | 23771 | 1 |
| C | 0 | 21471 | 1 |
| D | 0 | 18823 | 3 |
| Quadrant | Total seconds | Saturated seconds | Saturation percentage |
|---|---|---|---|
| A | 6052 | 2128 | 35.161930% |
| B | 6052 | 899 | 14.854594% |
| C | 6053 | 697 | 11.514951% |
| D | 6052 | 225 | 3.717779% |
Noise dominated data is calculated using 1-second bins in cleaned event files. If a bin has >2000 counts, and if more than 50% of those come from <1% of pixels, then it is considered to be noise-dominated and hence unusable.
| Quadrant | # 1 sec bins | Bins with >0 counts | Bins with >2000 counts | High rate bins dominated by noise | Noise dominated (total time) | Noise dominated (detector-on time) | Marked lightcurve |
|---|---|---|---|---|---|---|---|
| A | 7386 | 6052 | 1421 | 1421 | 19.24% | 23.48% | 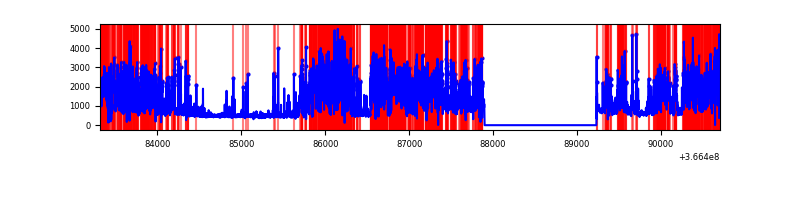 |
| B | 7387 | 6053 | 518 | 518 | 7.01% | 8.56% | 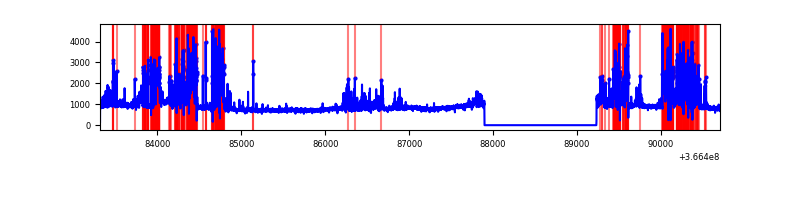 |
| C | 7388 | 6054 | 355 | 355 | 4.81% | 5.86% | 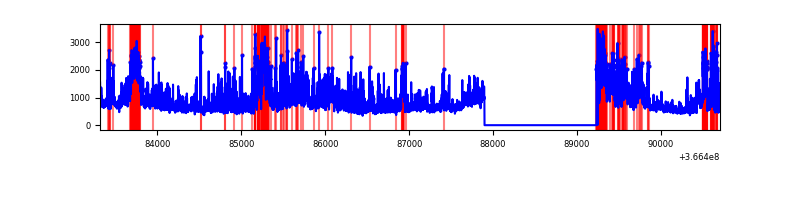 |
| D | 7387 | 6053 | 146 | 146 | 1.98% | 2.41% | 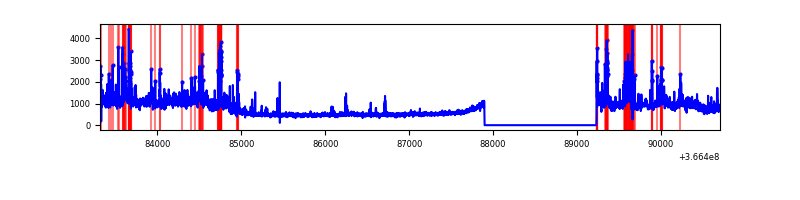 |
Top three noisy pixels from each quadrant. If the there are fewer than three noisy pixels in the level2.evt file, extra rows are filled as -1
| Pixel properties | Quadrant properties | ||||||
|---|---|---|---|---|---|---|---|
| Quadrant | DetID | PixID | Counts | Sigma | Mean | Median | Sigma |
| A | 0 | 13 | 5402080 | 39510.44 | 691 | 681 | 136.7 |
| A | 13 | 254 | 9585 | 65.13 | 691 | 681 | 136.7 |
| A | 3 | 137 | 6146 | 39.98 | 691 | 681 | 136.7 |
| B | 6 | 159 | 1724023 | 12312.71 | 749 | 733 | 140.0 |
| B | 5 | 172 | 1628818 | 11632.49 | 749 | 733 | 140.0 |
| B | 0 | 190 | 106971 | 759.06 | 749 | 733 | 140.0 |
| C | 0 | 10 | 1577673 | 9447.45 | 723 | 729 | 166.9 |
| C | 3 | 233 | 1027383 | 6150.67 | 723 | 729 | 166.9 |
| C | 10 | 22 | 199248 | 1189.32 | 723 | 729 | 166.9 |
| D | 8 | 195 | 1436818 | 8123.67 | 756 | 740 | 176.8 |
| D | 12 | 218 | 318566 | 1797.89 | 756 | 740 | 176.8 |
| D | 12 | 233 | 168780 | 950.58 | 756 | 740 | 176.8 |
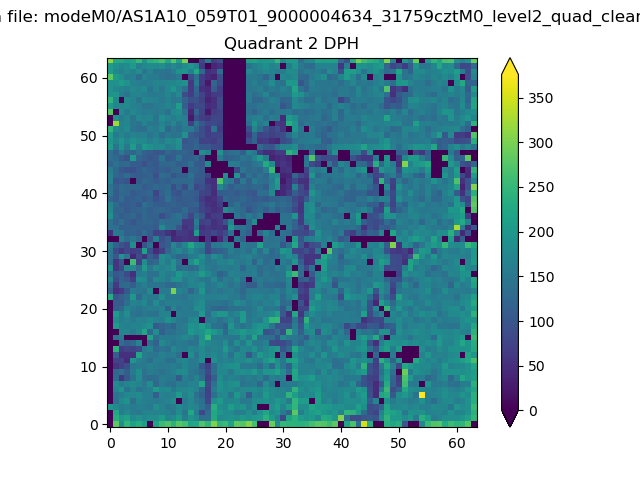
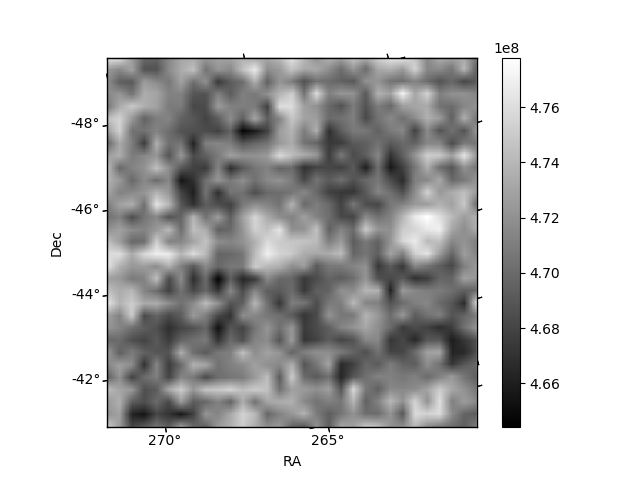
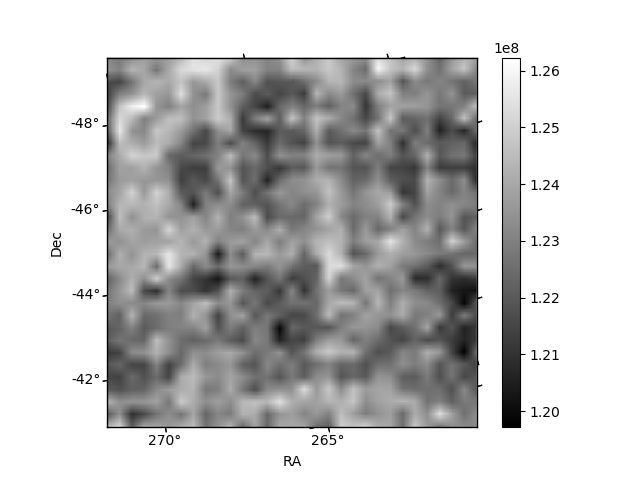
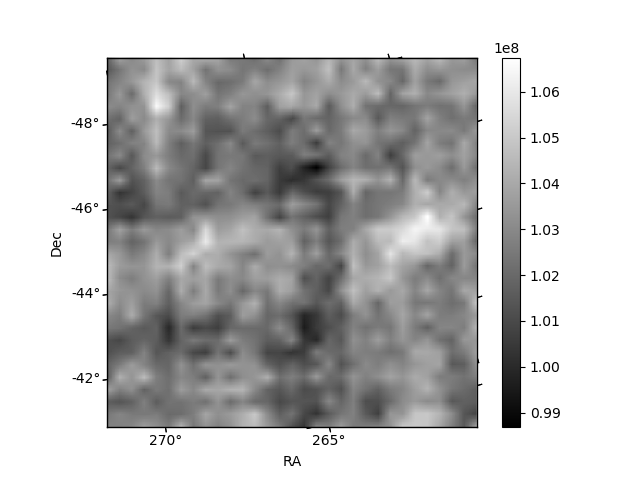
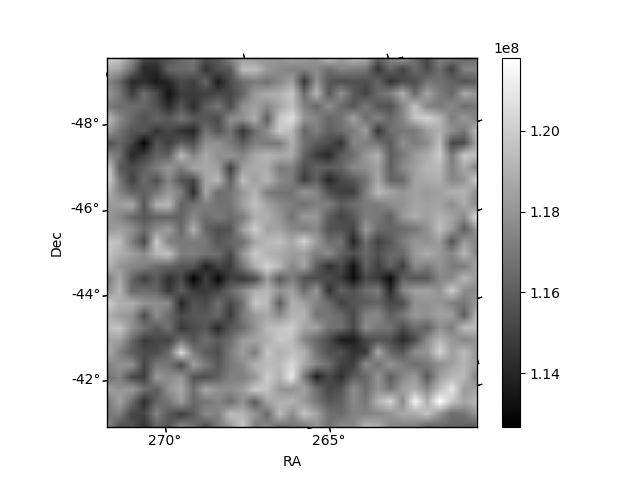
Histogram calculated using DETX and DETY for each event in the final _common_clean file
| Quadrant A | 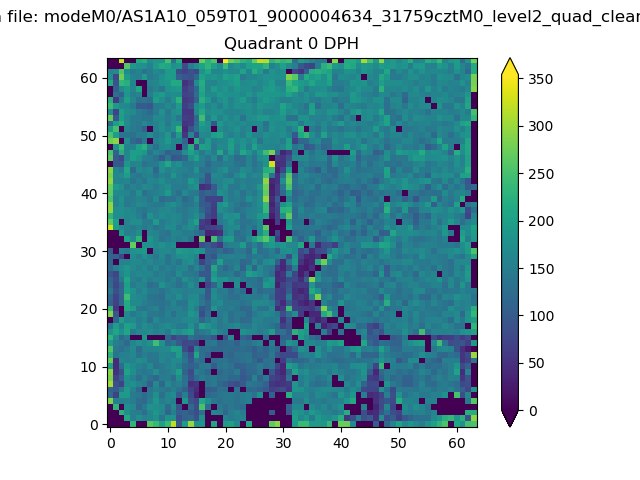 |
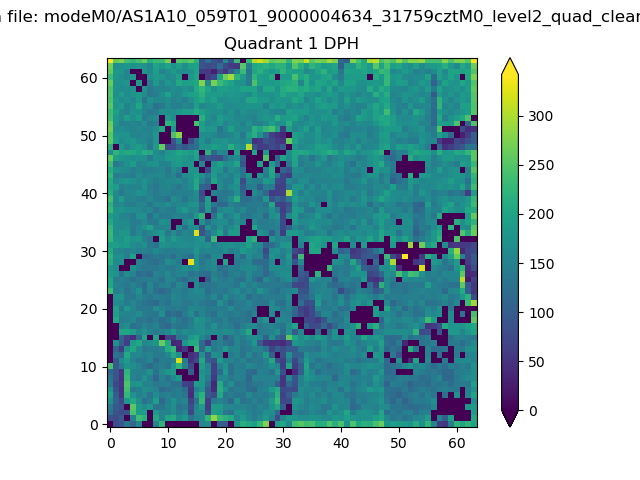 |
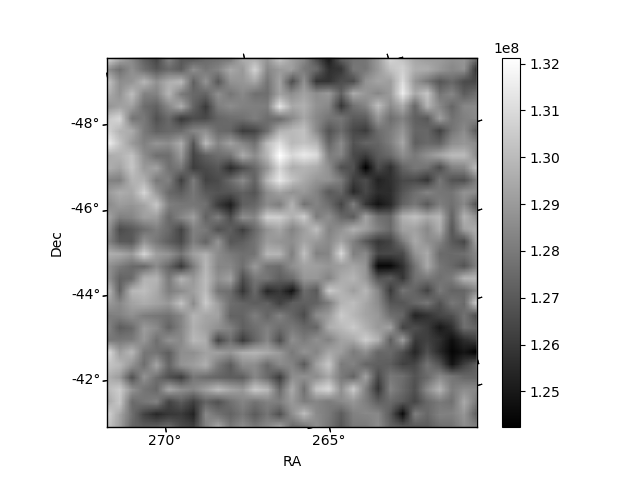
Quadrant B |
|---|---|---|---|
| Quadrant D | 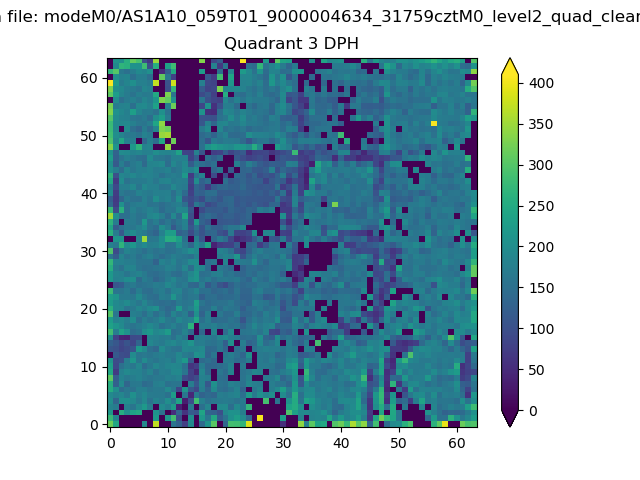 |
 |
Quadrant C |
| Plot type | Count rate plots | Images |
|---|---|---|
| Comparison with Poisson distribution Blue bars denote a histogram of data divided into 1 sec bins. Red curve is a Poisson curve with rate = median count rate of data. |
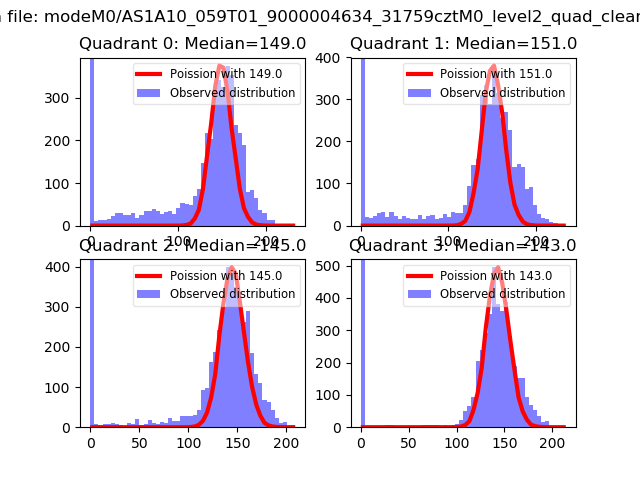 |
 |
| Quadrant-wise count rates Data is divided into 100 sec bins |
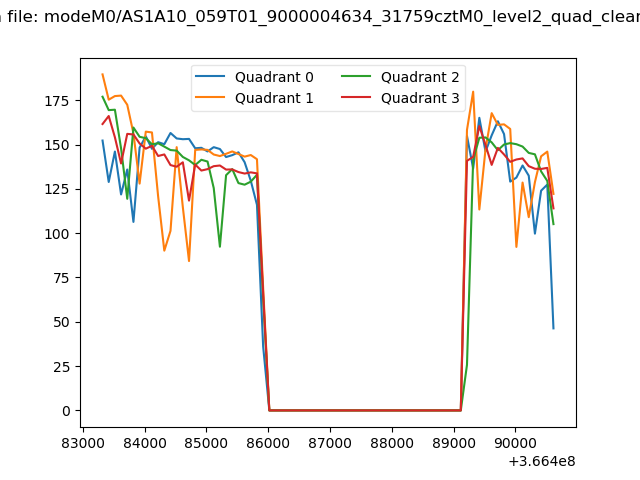 |
|
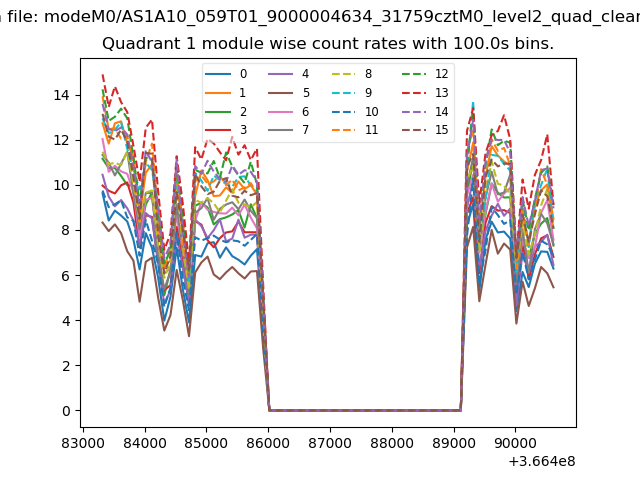
| Module-wise count rates for Quadrant A Data is divided into 100 sec bins |
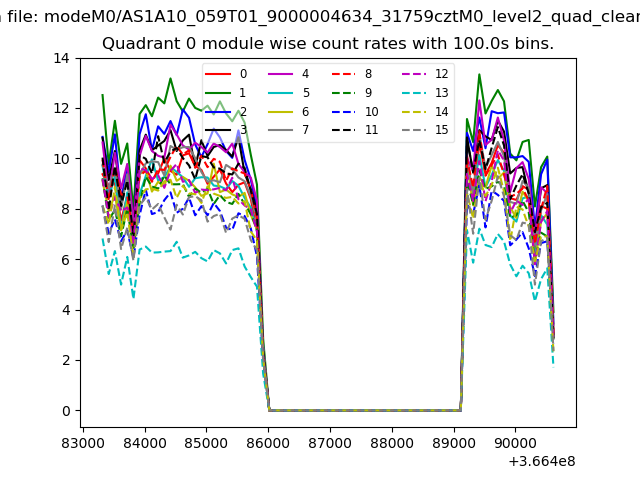 |
 |
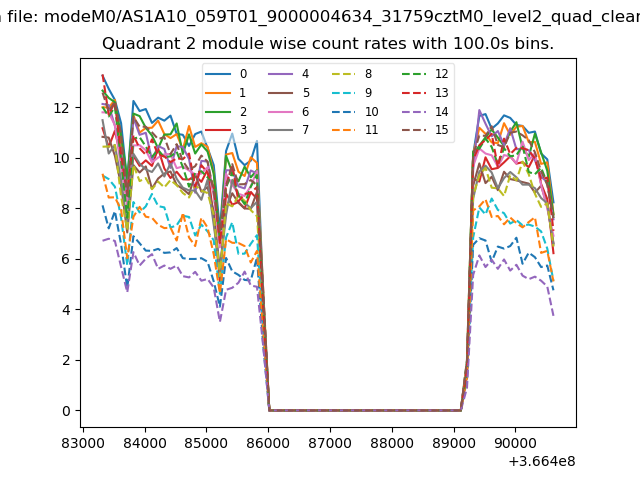
| Module-wise count rates for Quadrant B Data is divided into 100 sec bins |
 |
 |
| Module-wise count rates for Quadrant C Data is divided into 100 sec bins |
 |
 |
| Module-wise count rates for Quadrant D Data is divided into 100 sec bins |
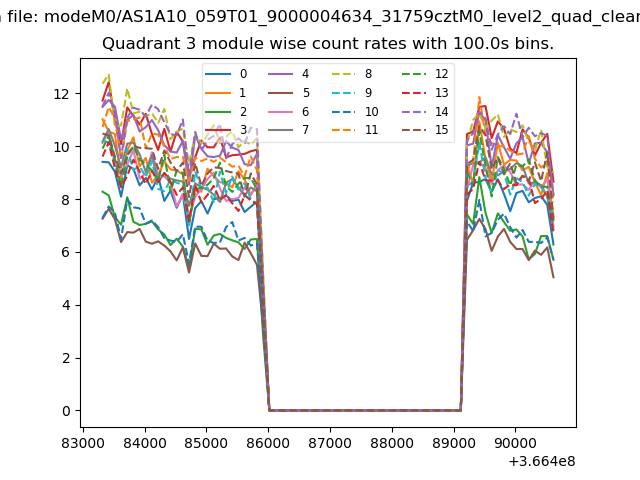 |
 |
| Parameter | Plot |
|---|---|
| CZT HV Monitor | 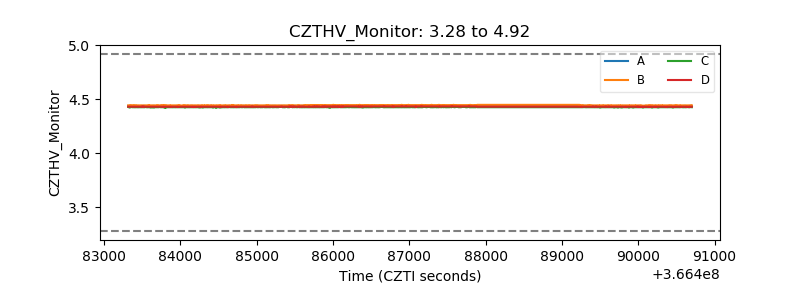 |
| D_VDD | 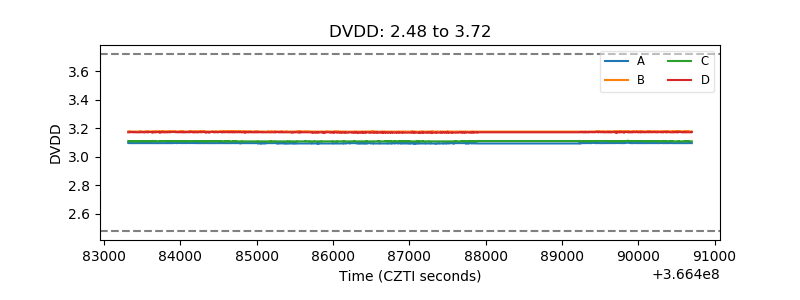 |
| Temperature 1 | 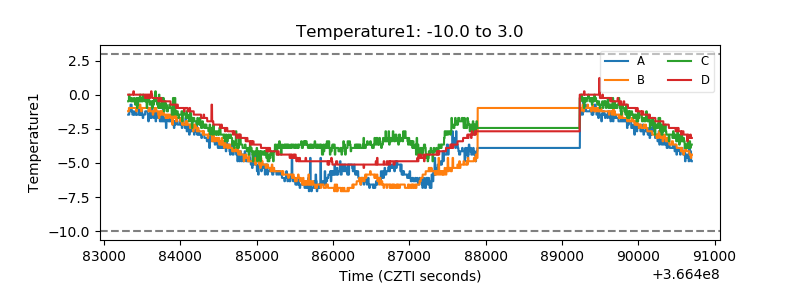 |
| Veto HV Monitor | 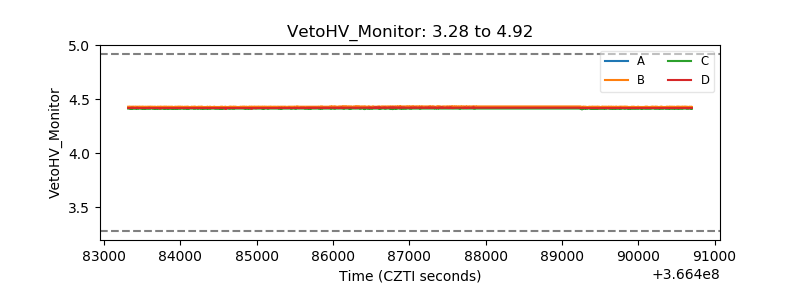 |
| Veto LLD | 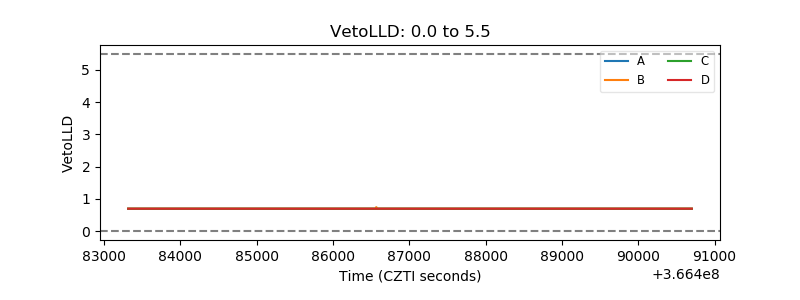 |
| Alpha Counter | 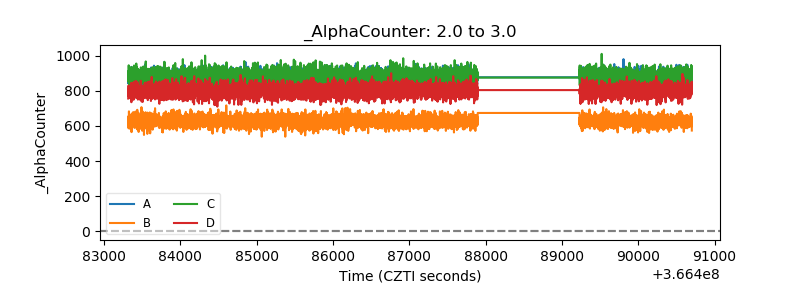 |
| _CPM_Rate | 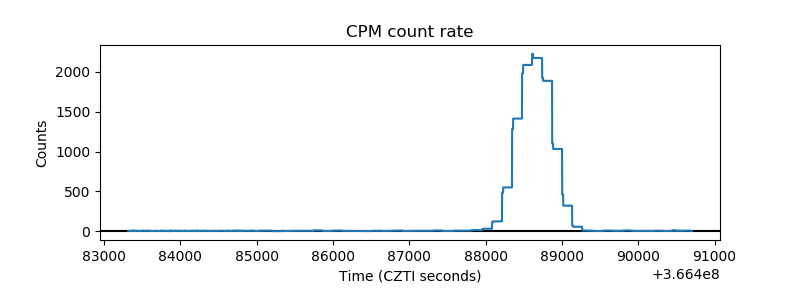 |
| CZT Counter | 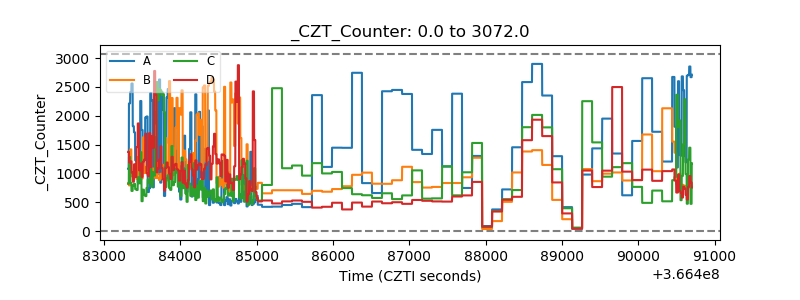 |
| +2.5 Volts monitor | 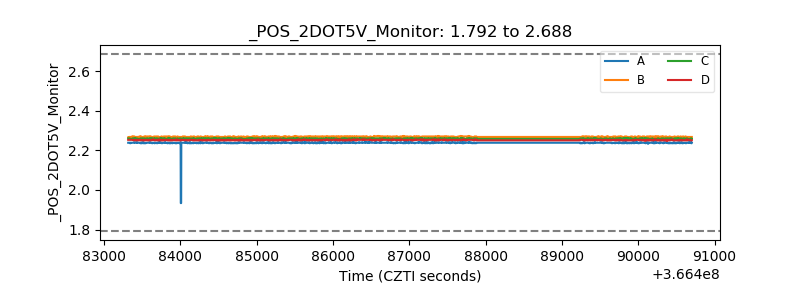 |
| +5 Volts monitor | 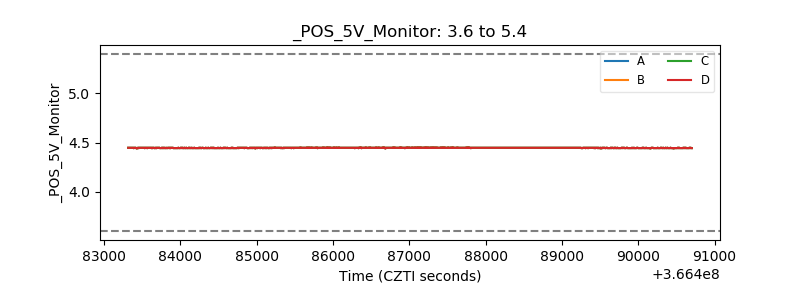 |
| _ROLL_ROT | 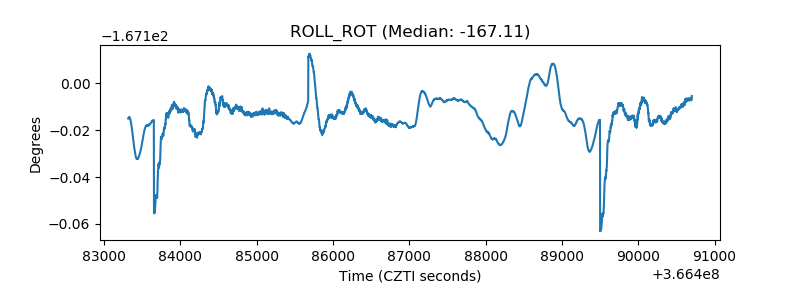 |
| _Roll_DEC | 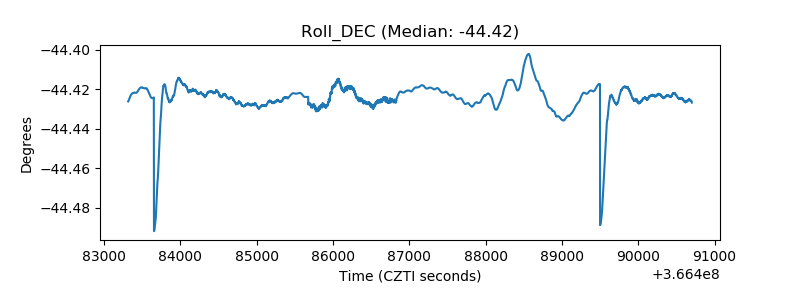 |
| _Roll_RA | 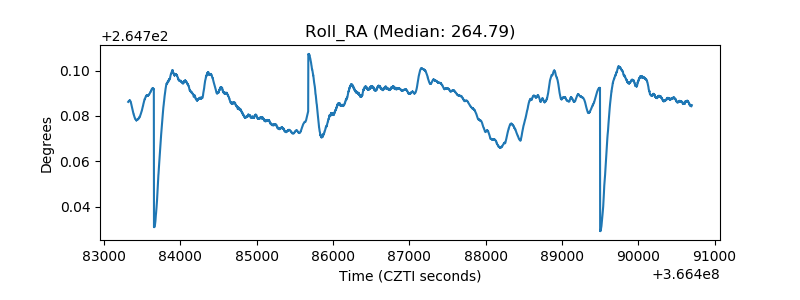 |
| Veto Counter | 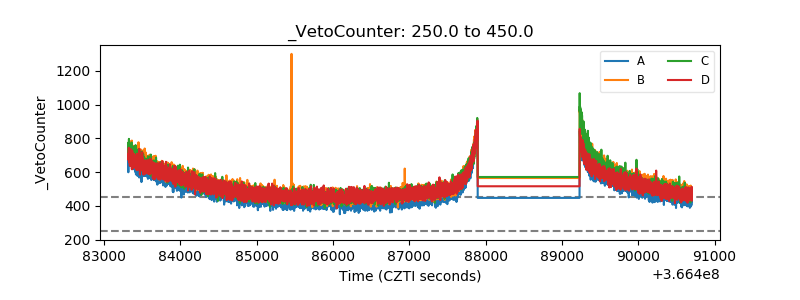 |