| Param | Original file | Final file |
|---|---|---|
| Filename | modeM0/AS1A10_109T01_9000004646_31811cztM0_level2.evt | modeM0/AS1A10_109T01_9000004646_31811cztM0_level2_quad_clean.evt |
| Size (bytes) | 664,994,880 | 72,204,480 |
| Size | 634.2 MB | 68.9 MB |
| Events in quadrant A | 4,180,939 | 445,217 |
| Events in quadrant B | 5,813,534 | 441,112 |
| Events in quadrant C | 3,872,032 | 425,080 |
| Events in quadrant D | 5,823,422 | 410,311 |
| Mode SS | |||
|---|---|---|---|
| Quadrant | BADHDUFLAG | Total packets | Discarded packets |
| A | 0 | 136 | 0 |
| B | 0 | 136 | 0 |
| C | 0 | 136 | 0 |
| D | 0 | 136 | 0 |
| Mode M0 | |||
|---|---|---|---|
| Quadrant | BADHDUFLAG | Total packets | Discarded packets |
| A | 0 | 16488 | 2 |
| B | 0 | 21970 | 2 |
| C | 0 | 15524 | 2 |
| D | 0 | 22114 | 3 |
| Mode M9 | |||
|---|---|---|---|
| Quadrant | BADHDUFLAG | Total packets | Discarded packets |
| A | 0 | 15 | 0 |
| B | 0 | 15 | 0 |
| C | 0 | 15 | 0 |
| D | 0 | 15 | 0 |
| Quadrant | Total seconds | Saturated seconds | Saturation percentage |
|---|---|---|---|
| A | 6658 | 297 | 4.460799% |
| B | 6658 | 254 | 3.814959% |
| C | 6658 | 290 | 4.355662% |
| D | 6657 | 95 | 1.427069% |
Noise dominated data is calculated using 1-second bins in cleaned event files. If a bin has >2000 counts, and if more than 50% of those come from <1% of pixels, then it is considered to be noise-dominated and hence unusable.
| Quadrant | # 1 sec bins | Bins with >0 counts | Bins with >2000 counts | High rate bins dominated by noise | Noise dominated (total time) | Noise dominated (detector-on time) | Marked lightcurve |
|---|---|---|---|---|---|---|---|
| A | 7588 | 6659 | 159 | 159 | 2.10% | 2.39% | 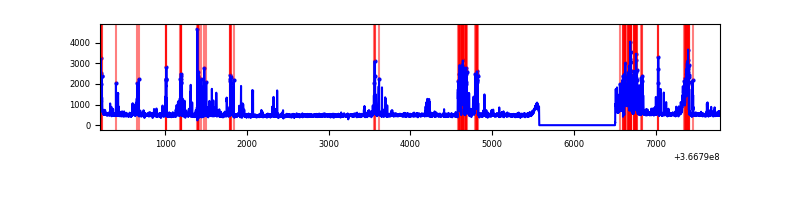 |
| B | 7588 | 6659 | 87 | 87 | 1.15% | 1.31% | 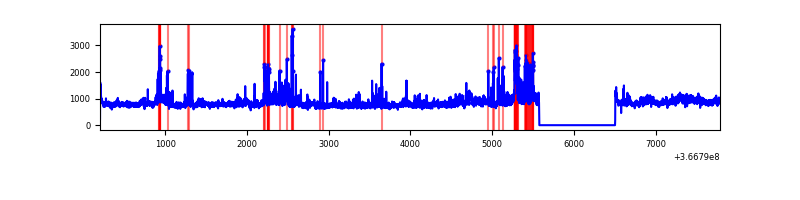 |
| C | 7588 | 6659 | 88 | 88 | 1.16% | 1.32% | 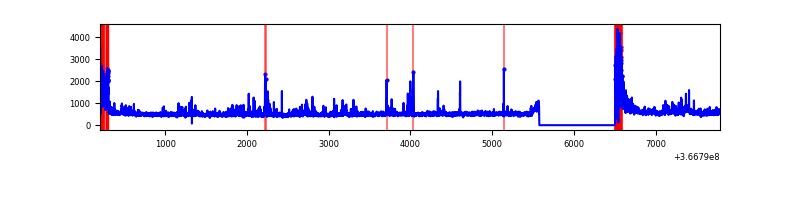 |
| D | 7587 | 6658 | 39 | 39 | 0.51% | 0.59% | 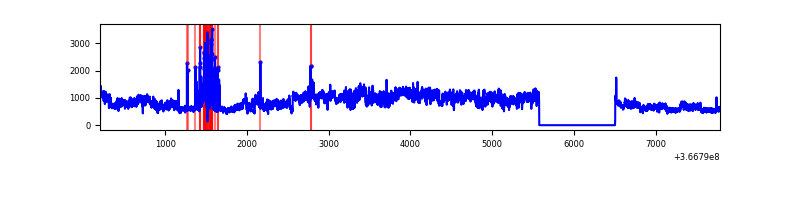 |
Top three noisy pixels from each quadrant. If the there are fewer than three noisy pixels in the level2.evt file, extra rows are filled as -1
| Pixel properties | Quadrant properties | ||||||
|---|---|---|---|---|---|---|---|
| Quadrant | DetID | PixID | Counts | Sigma | Mean | Median | Sigma |
| A | 0 | 13 | 958231 | 5706.19 | 832 | 816 | 167.8 |
| A | 13 | 254 | 12019 | 66.77 | 832 | 816 | 167.8 |
| A | 3 | 137 | 8612 | 46.46 | 832 | 816 | 167.8 |
| B | 6 | 159 | 1744378 | 10965.72 | 826 | 806 | 159.0 |
| B | 10 | 245 | 360381 | 2261.45 | 826 | 806 | 159.0 |
| B | 4 | 80 | 261935 | 1642.3 | 826 | 806 | 159.0 |
| C | 0 | 10 | 508567 | 2715.87 | 789 | 795 | 187.0 |
| C | 14 | 238 | 156915 | 835.02 | 789 | 795 | 187.0 |
| C | 3 | 233 | 66746 | 352.75 | 789 | 795 | 187.0 |
| D | 8 | 195 | 2597446 | 13289.36 | 808 | 785 | 195.4 |
| D | 12 | 218 | 130150 | 662.07 | 808 | 785 | 195.4 |
| D | 2 | 234 | 26622 | 132.23 | 808 | 785 | 195.4 |
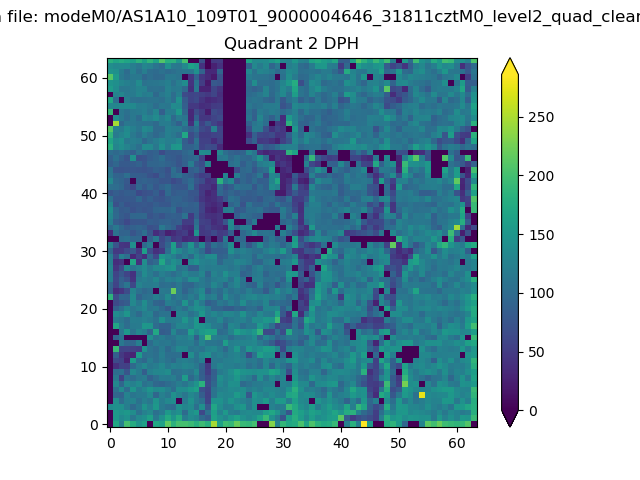
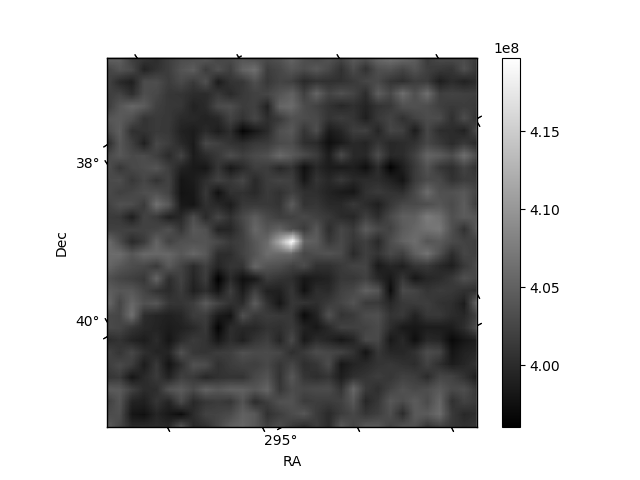
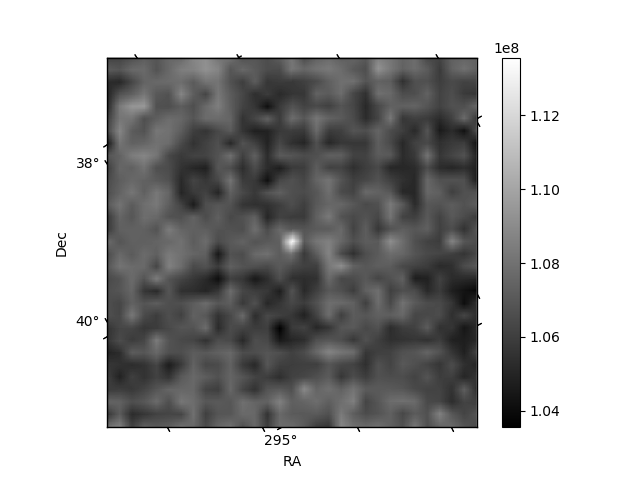
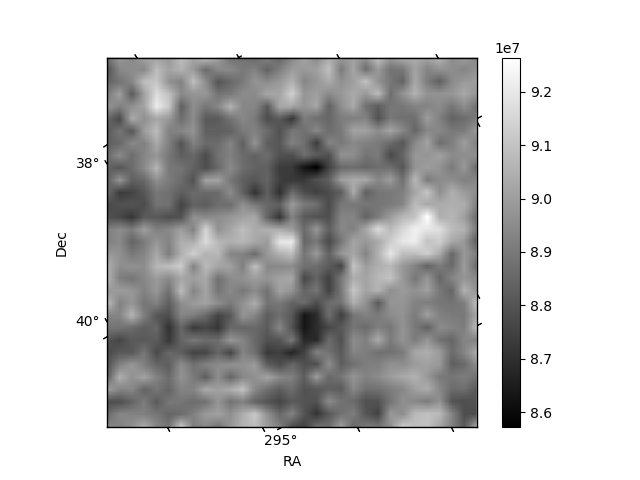
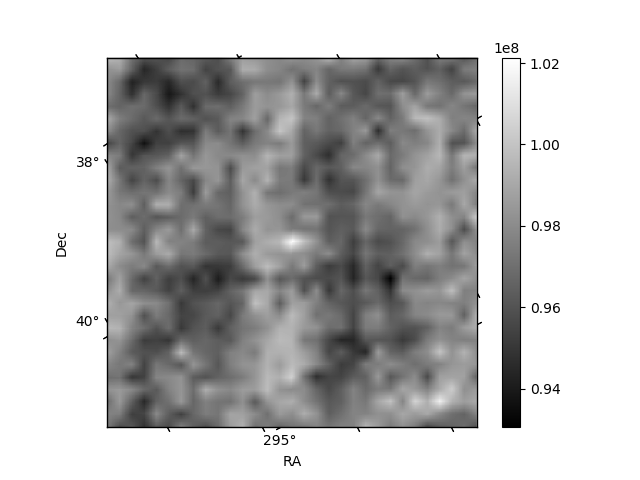
Histogram calculated using DETX and DETY for each event in the final _common_clean file
| Quadrant A | 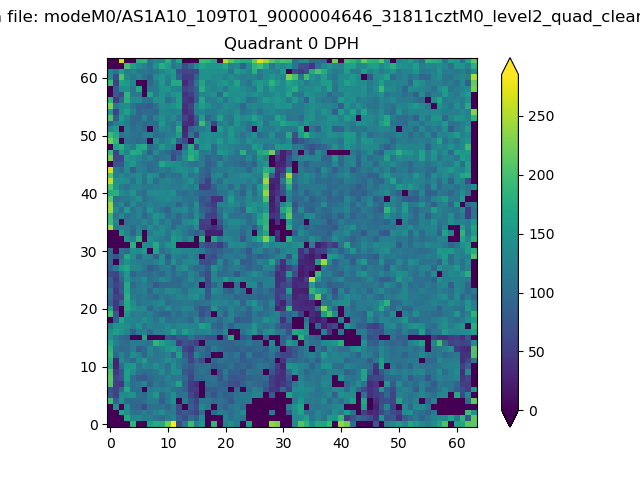 |
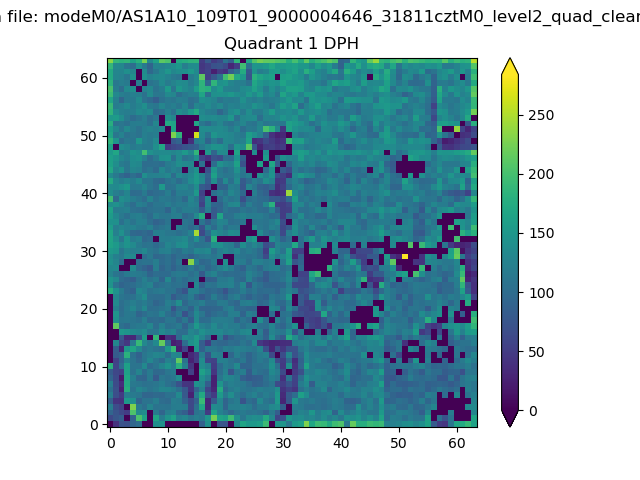 |
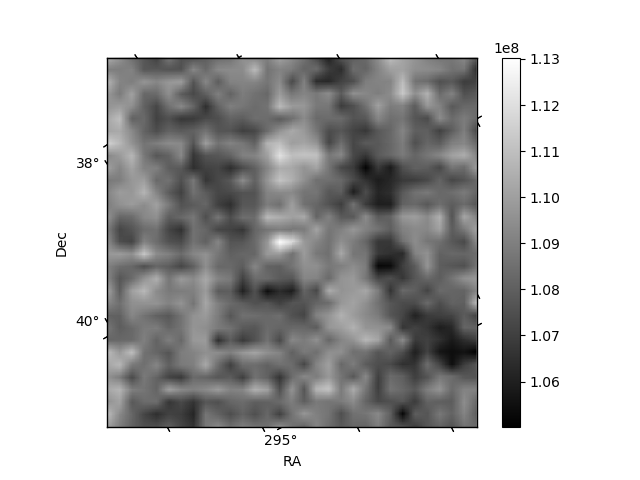
Quadrant B |
|---|---|---|---|
| Quadrant D | 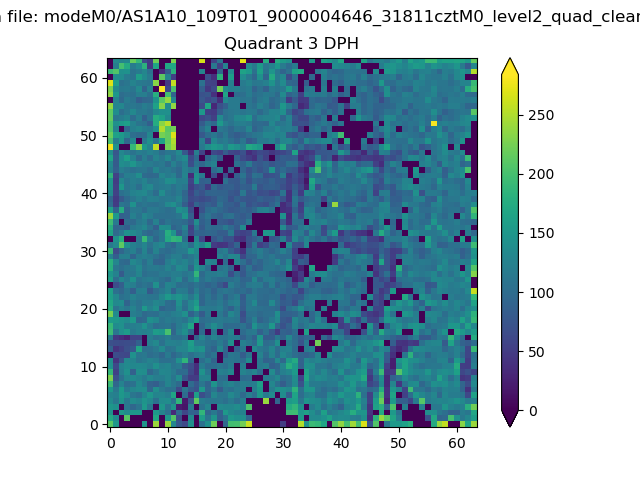 |
 |
Quadrant C |
| Plot type | Count rate plots | Images |
|---|---|---|
| Comparison with Poisson distribution Blue bars denote a histogram of data divided into 1 sec bins. Red curve is a Poisson curve with rate = median count rate of data. |
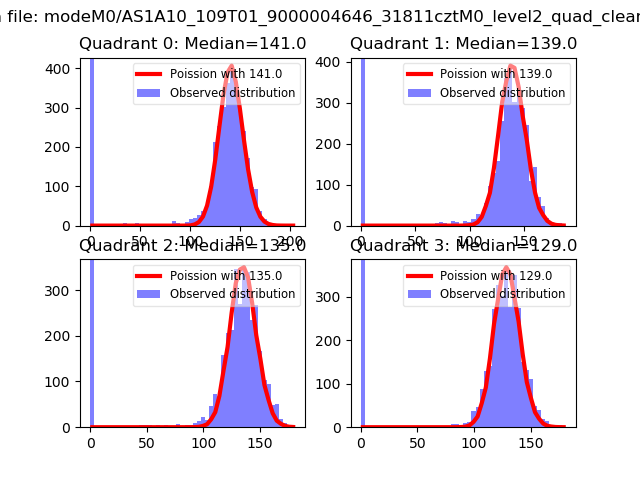 |
 |
| Quadrant-wise count rates Data is divided into 100 sec bins |
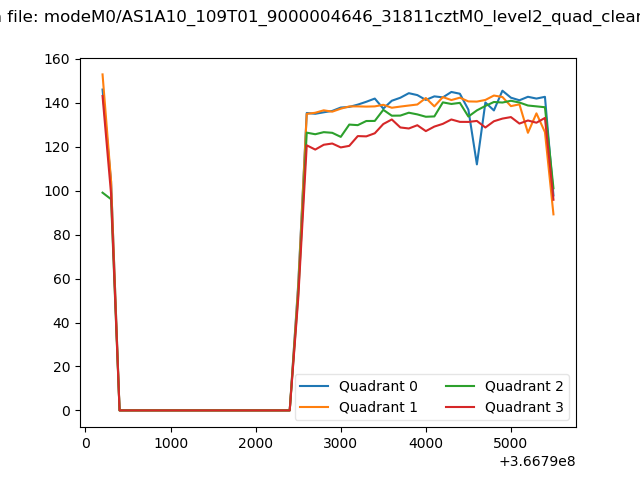 |
|
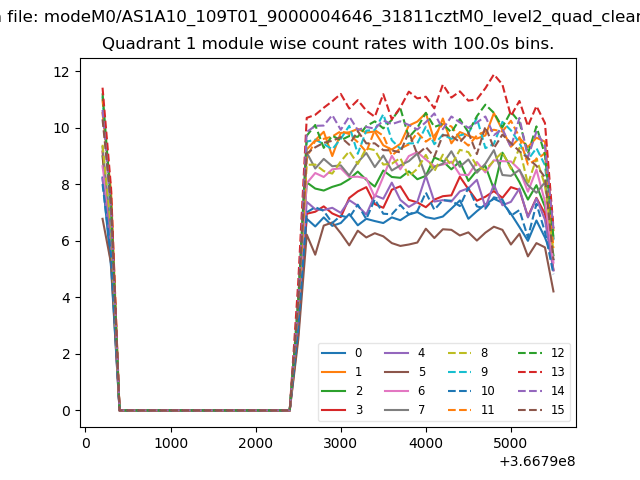
| Module-wise count rates for Quadrant A Data is divided into 100 sec bins |
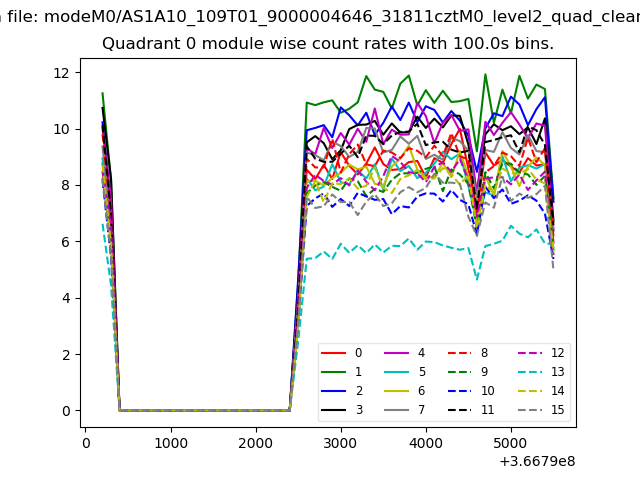 |
 |
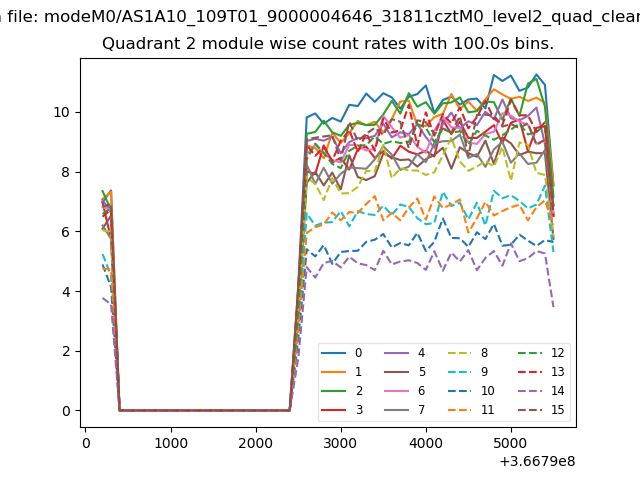
| Module-wise count rates for Quadrant B Data is divided into 100 sec bins |
 |
 |
| Module-wise count rates for Quadrant C Data is divided into 100 sec bins |
 |
 |
| Module-wise count rates for Quadrant D Data is divided into 100 sec bins |
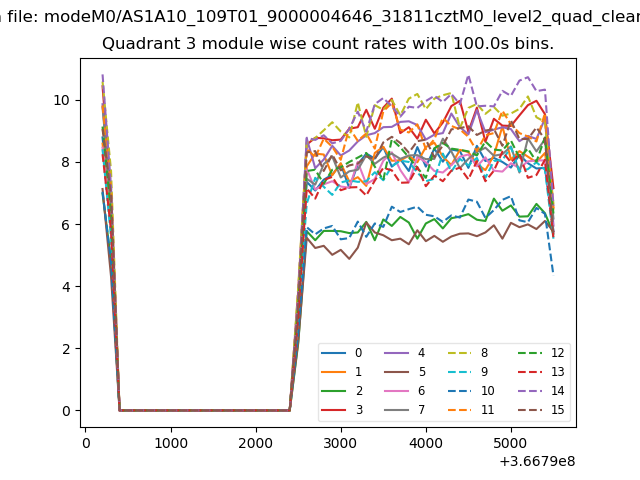 |
 |
| Parameter | Plot |
|---|---|
| CZT HV Monitor | 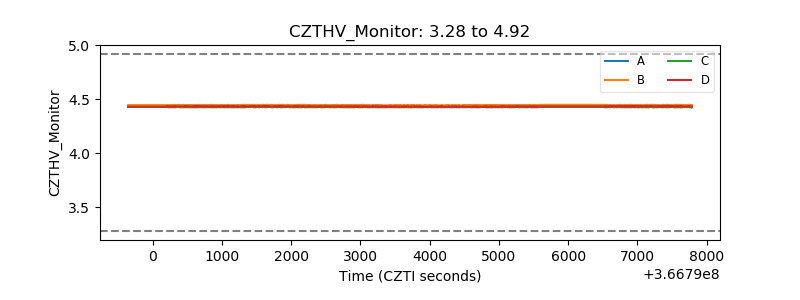 |
| D_VDD | 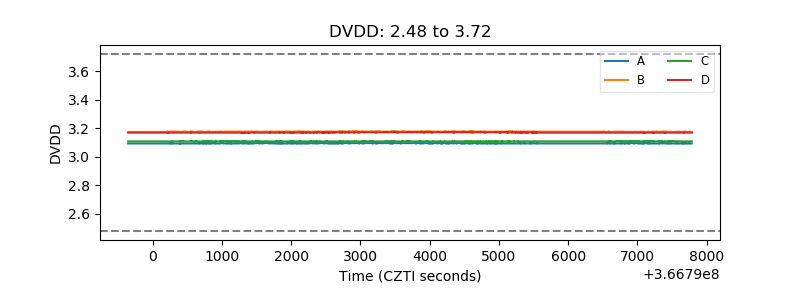 |
| Temperature 1 | 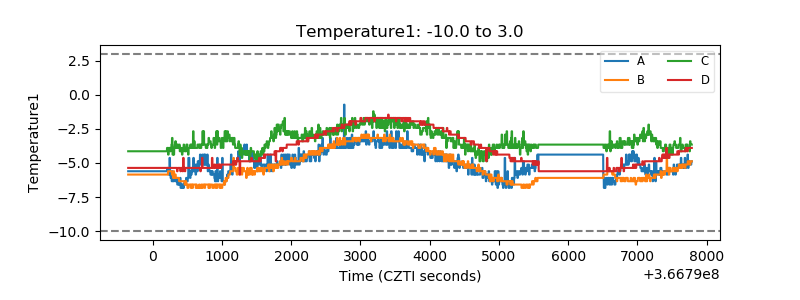 |
| Veto HV Monitor | 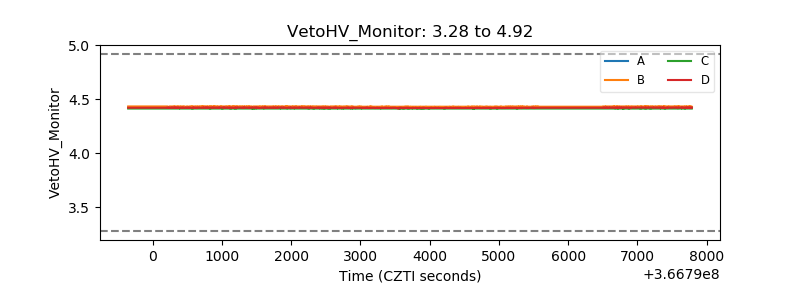 |
| Veto LLD | 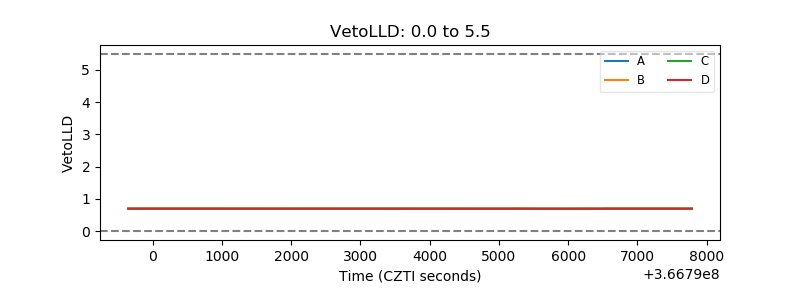 |
| Alpha Counter | 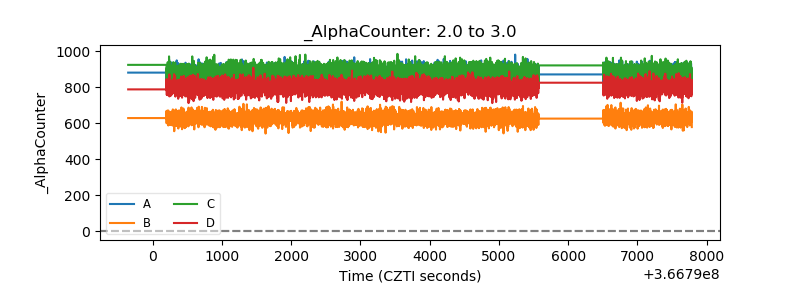 |
| _CPM_Rate | 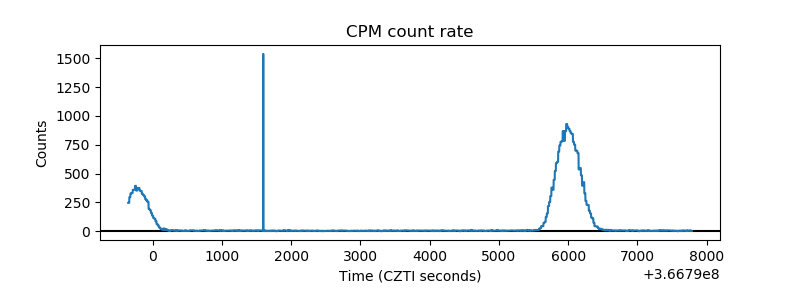 |
| CZT Counter | 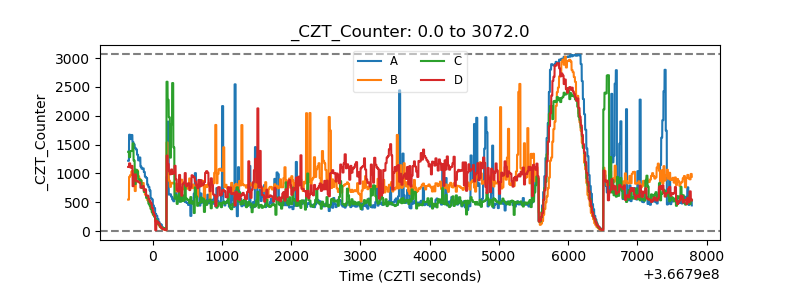 |
| +2.5 Volts monitor | 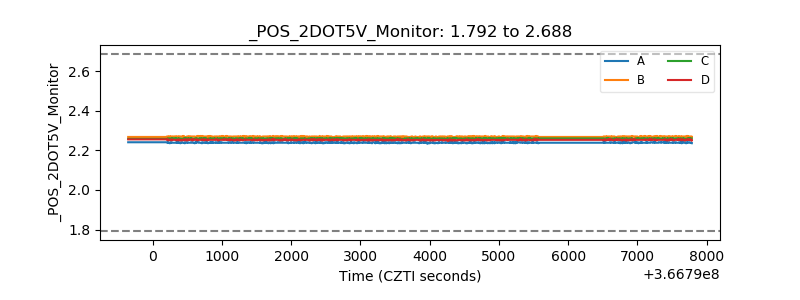 |
| +5 Volts monitor | 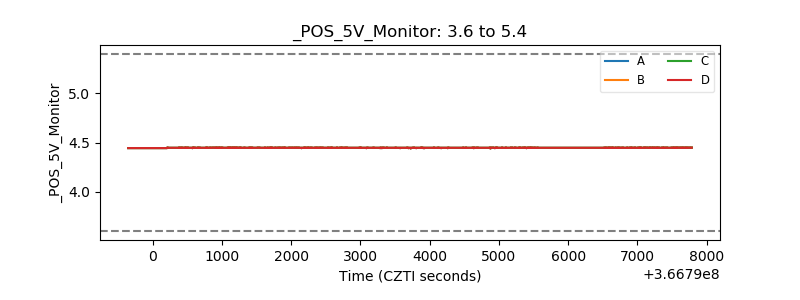 |
| _ROLL_ROT | 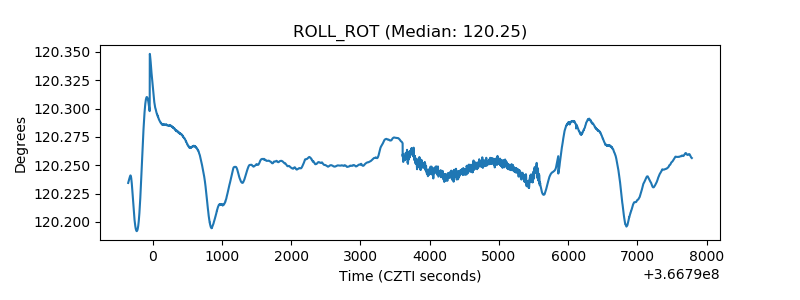 |
| _Roll_DEC | 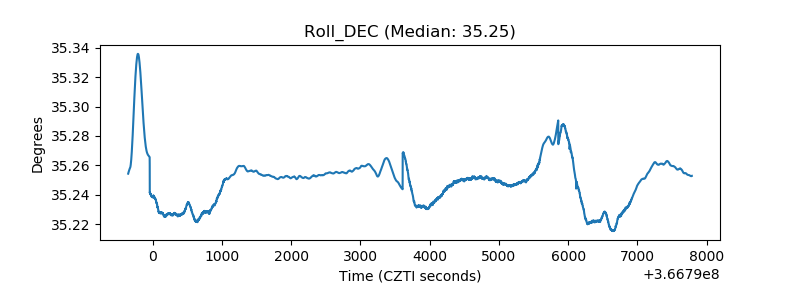 |
| _Roll_RA | 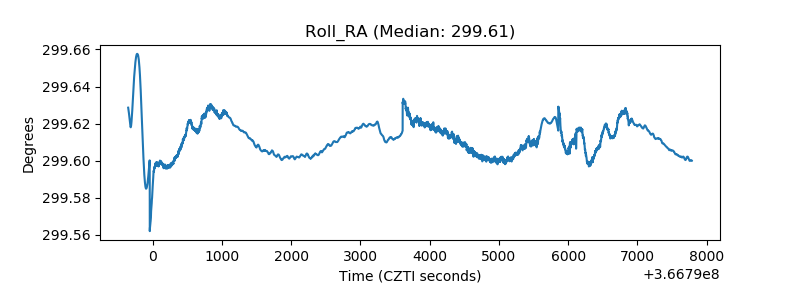 |
| Veto Counter | 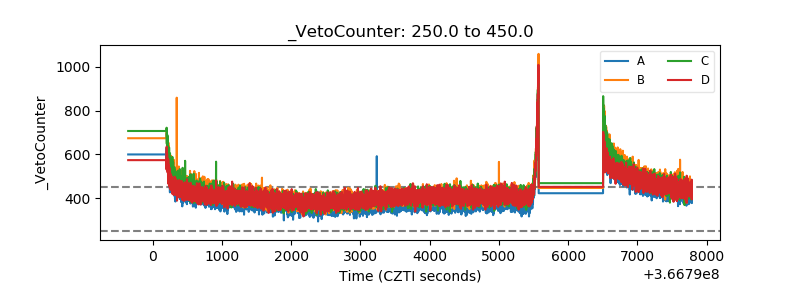 |