| Param | Original file | Final file |
|---|---|---|
| Filename | modeM0/AS1C06_010T03_9000004676_31998cztM0_level2.evt | modeM0/AS1C06_010T03_9000004676_31998cztM0_level2_quad_clean.evt |
| Size (bytes) | 1,105,179,840 | 233,688,960 |
| Size | 1.0 GB | 222.9 MB |
| Events in quadrant A | 5,847,749 | 1,617,692 |
| Events in quadrant B | 10,753,457 | 1,564,838 |
| Events in quadrant C | 7,799,313 | 1,536,601 |
| Events in quadrant D | 8,227,706 | 1,495,609 |
| Mode SS | |||
|---|---|---|---|
| Quadrant | BADHDUFLAG | Total packets | Discarded packets |
| A | 0 | 254 | 0 |
| B | 0 | 254 | 0 |
| C | 0 | 254 | 0 |
| D | 0 | 254 | 0 |
| Mode M0 | |||
|---|---|---|---|
| Quadrant | BADHDUFLAG | Total packets | Discarded packets |
| A | 0 | 25751 | 2 |
| B | 0 | 41696 | 2 |
| C | 0 | 31613 | 2 |
| D | 0 | 32927 | 3 |
| Mode M9 | |||
|---|---|---|---|
| Quadrant | BADHDUFLAG | Total packets | Discarded packets |
| A | 0 | 14 | 0 |
| B | 0 | 14 | 0 |
| C | 0 | 14 | 0 |
| D | 0 | 14 | 0 |
| Quadrant | Total seconds | Saturated seconds | Saturation percentage |
|---|---|---|---|
| A | 12486 | 43 | 0.344386% |
| B | 12487 | 703 | 5.629855% |
| C | 12487 | 349 | 2.794907% |
| D | 12486 | 732 | 5.862566% |
Noise dominated data is calculated using 1-second bins in cleaned event files. If a bin has >2000 counts, and if more than 50% of those come from <1% of pixels, then it is considered to be noise-dominated and hence unusable.
| Quadrant | # 1 sec bins | Bins with >0 counts | Bins with >2000 counts | High rate bins dominated by noise | Noise dominated (total time) | Noise dominated (detector-on time) | Marked lightcurve |
|---|---|---|---|---|---|---|---|
| A | 13926 | 12488 | 26 | 26 | 0.19% | 0.21% | 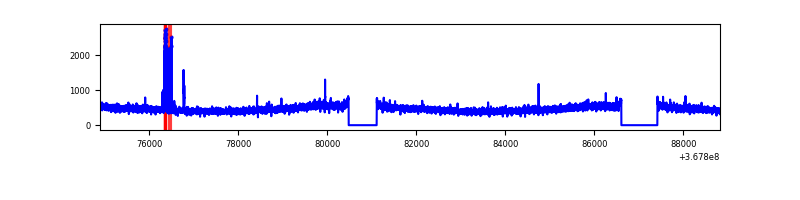 |
| B | 13927 | 12487 | 462 | 462 | 3.32% | 3.70% | 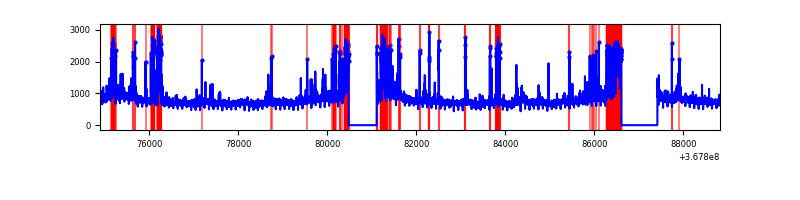 |
| C | 13927 | 12488 | 77 | 77 | 0.55% | 0.62% | 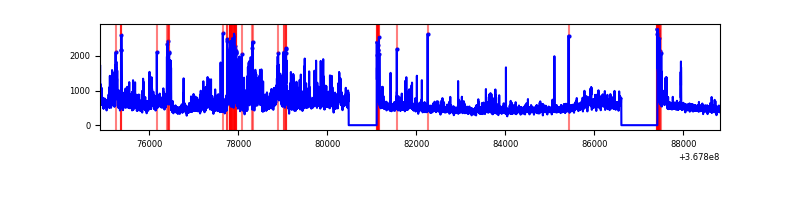 |
| D | 13926 | 12486 | 672 | 672 | 4.83% | 5.38% | 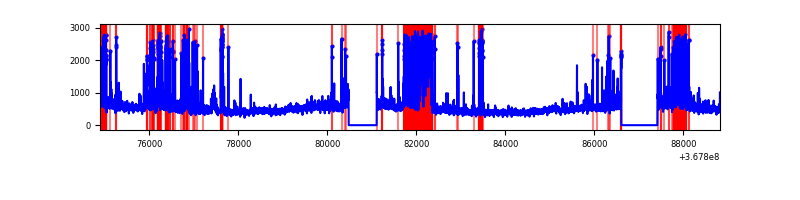 |
Top three noisy pixels from each quadrant. If the there are fewer than three noisy pixels in the level2.evt file, extra rows are filled as -1
| Pixel properties | Quadrant properties | ||||||
|---|---|---|---|---|---|---|---|
| Quadrant | DetID | PixID | Counts | Sigma | Mean | Median | Sigma |
| A | 15 | 174 | 116088 | 386.7 | 1478 | 1448 | 296.5 |
| A | 13 | 6 | 25174 | 80.03 | 1478 | 1448 | 296.5 |
| A | 13 | 254 | 23359 | 73.91 | 1478 | 1448 | 296.5 |
| B | 6 | 159 | 3425655 | 12695.31 | 1433 | 1395 | 269.7 |
| B | 5 | 172 | 989993 | 3665.19 | 1433 | 1395 | 269.7 |
| B | 10 | 245 | 536447 | 1983.68 | 1433 | 1395 | 269.7 |
| C | 3 | 233 | 1690290 | 5156.04 | 1410 | 1417 | 327.6 |
| C | 0 | 10 | 287096 | 872.16 | 1410 | 1417 | 327.6 |
| C | 14 | 238 | 230275 | 698.69 | 1410 | 1417 | 327.6 |
| D | 13 | 249 | 1834286 | 5537.92 | 1398 | 1357 | 331.0 |
| D | 8 | 195 | 585599 | 1765.2 | 1398 | 1357 | 331.0 |
| D | 12 | 218 | 189573 | 568.67 | 1398 | 1357 | 331.0 |
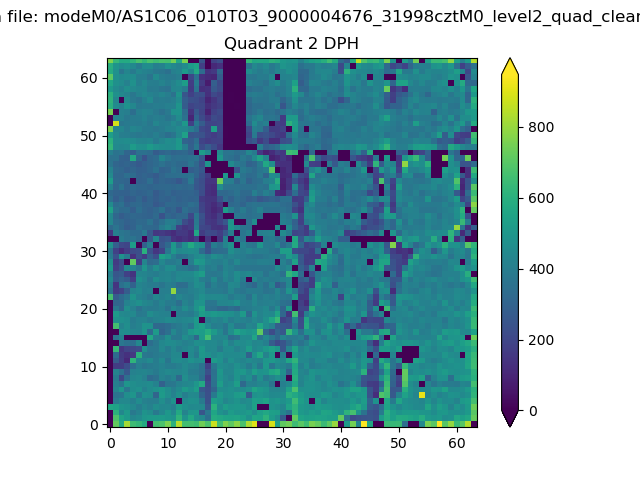
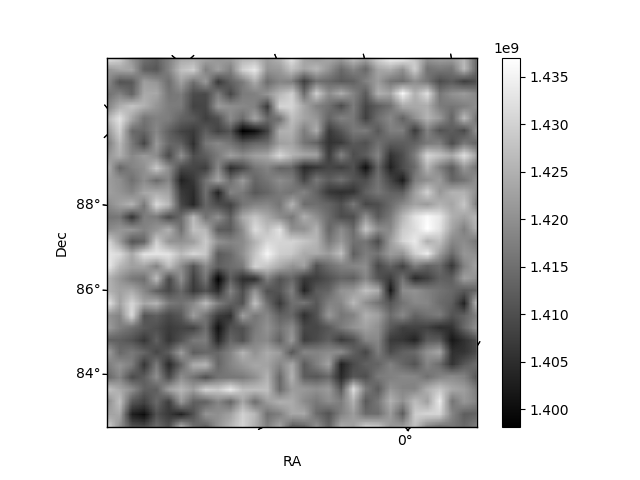
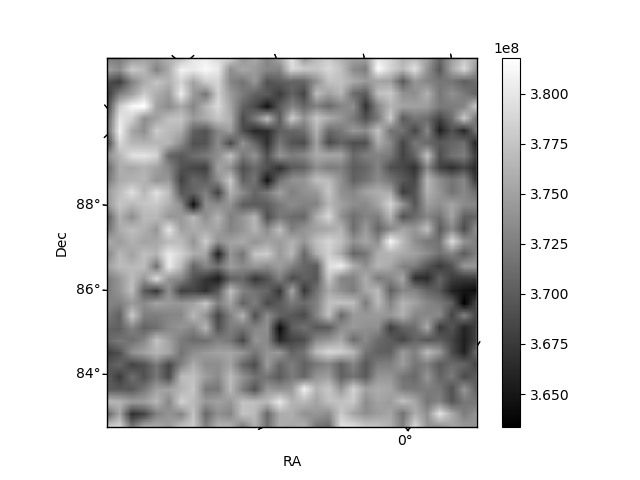
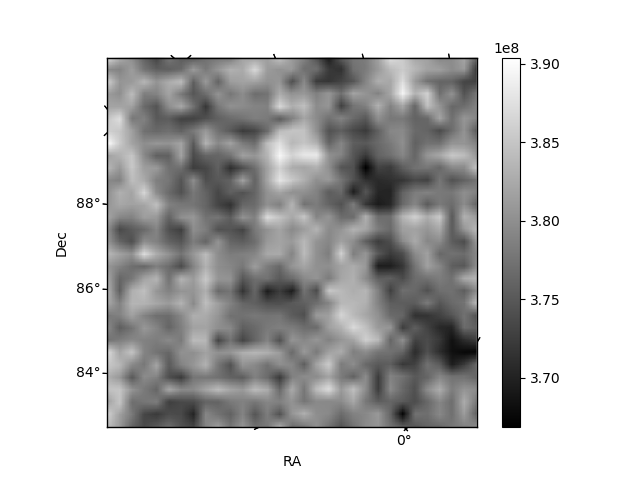
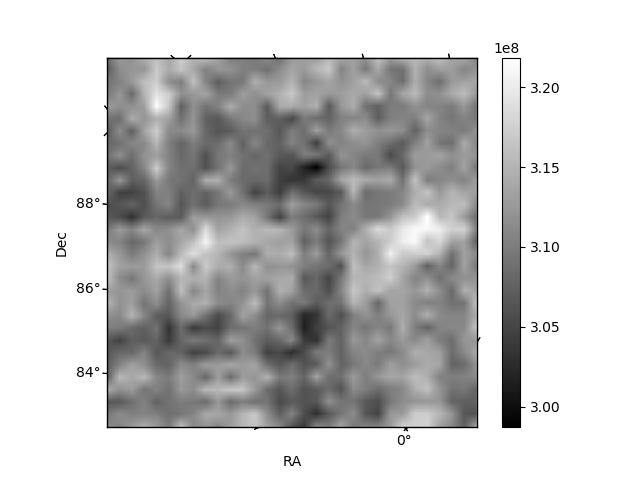
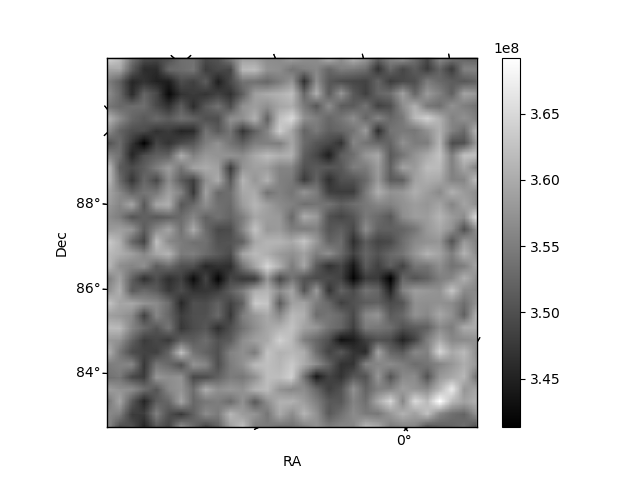
Histogram calculated using DETX and DETY for each event in the final _common_clean file
| Quadrant A | 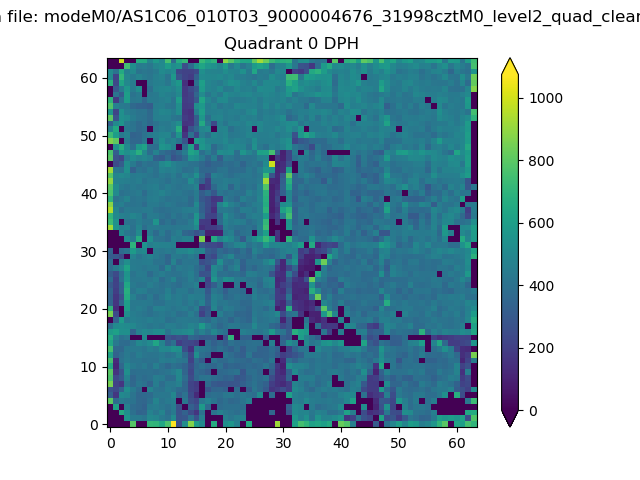 |
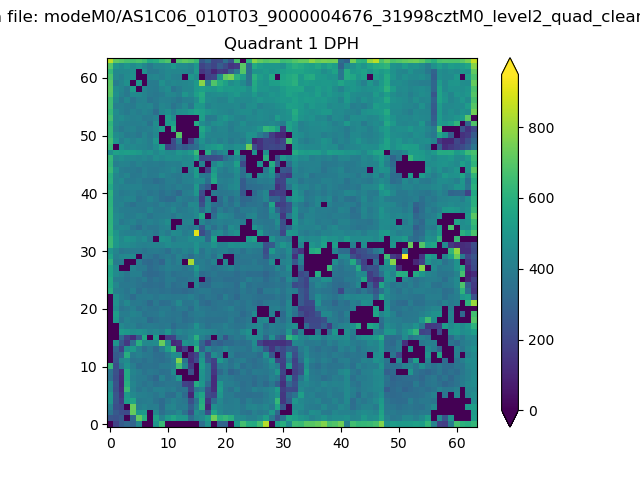 |
Quadrant B |
|---|---|---|---|
| Quadrant D | 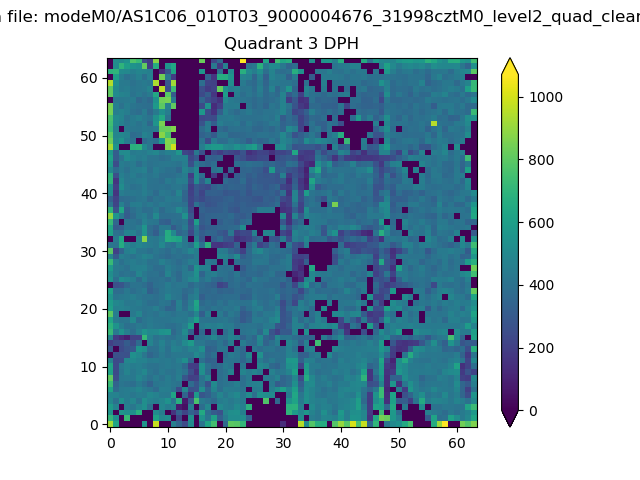 |
 |
Quadrant C |
| Plot type | Count rate plots | Images |
|---|---|---|
| Comparison with Poisson distribution Blue bars denote a histogram of data divided into 1 sec bins. Red curve is a Poisson curve with rate = median count rate of data. |
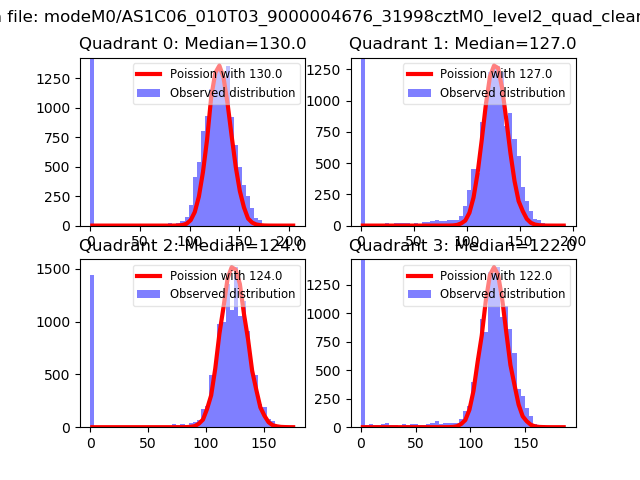 |
 |
| Quadrant-wise count rates Data is divided into 100 sec bins |
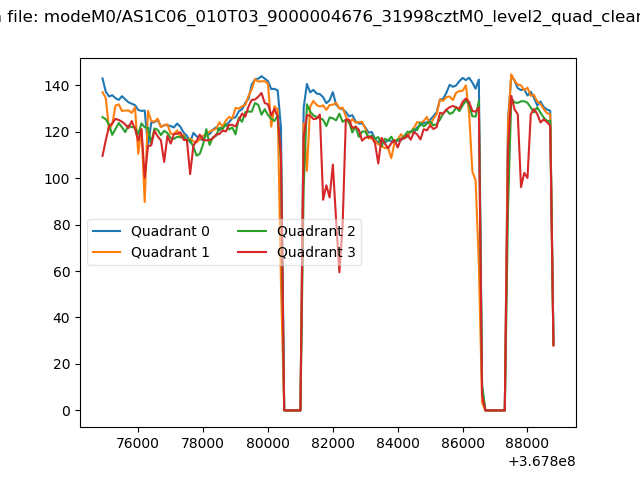 |
|
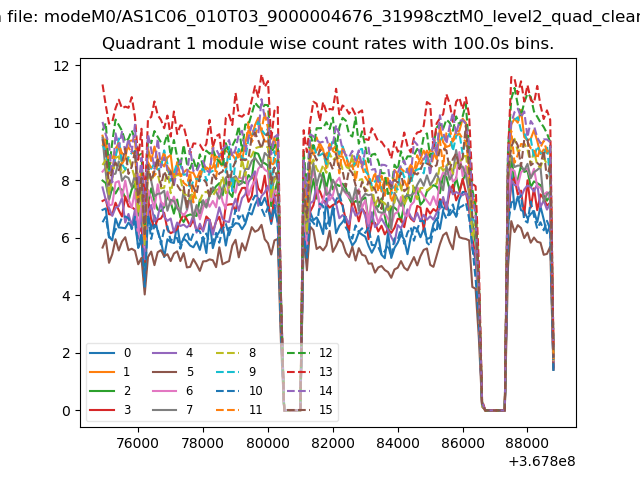
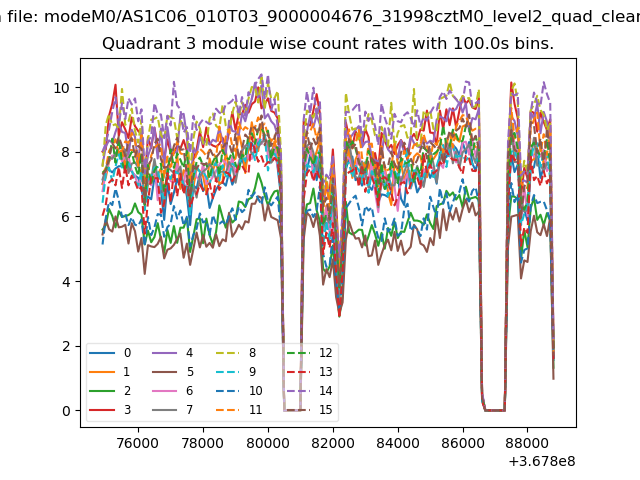
| Module-wise count rates for Quadrant A Data is divided into 100 sec bins |
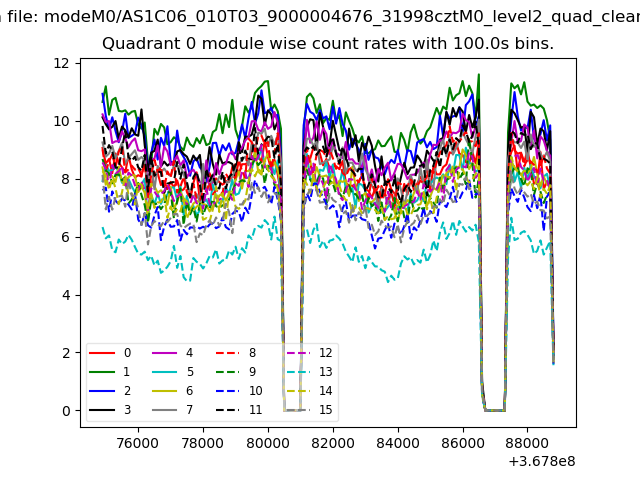 |
 |
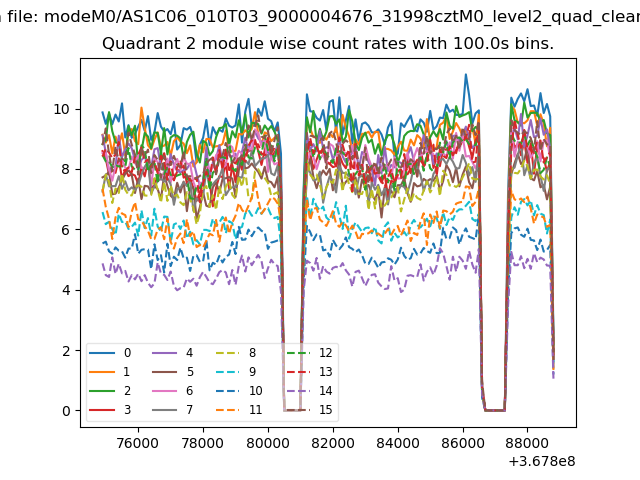
| Module-wise count rates for Quadrant B Data is divided into 100 sec bins |
 |
 |
| Module-wise count rates for Quadrant C Data is divided into 100 sec bins |
 |
 |
| Module-wise count rates for Quadrant D Data is divided into 100 sec bins |
 |
 |
| Parameter | Plot |
|---|---|
| CZT HV Monitor | 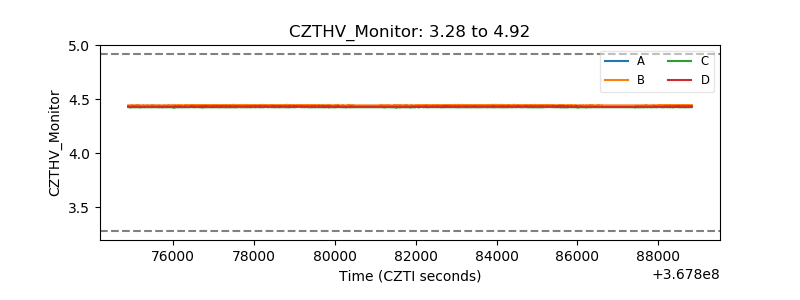 |
| D_VDD | 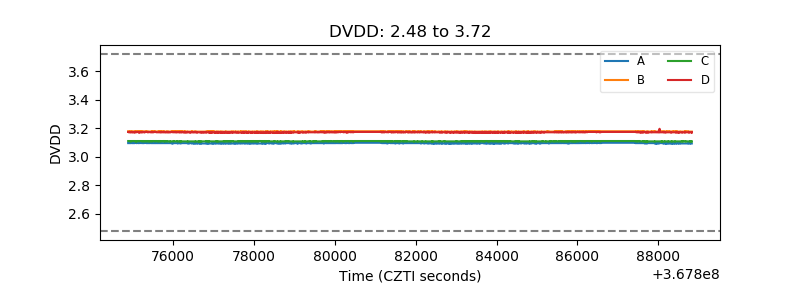 |
| Temperature 1 | 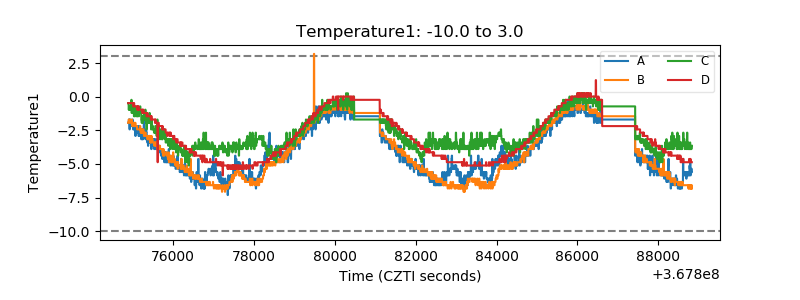 |
| Veto HV Monitor | 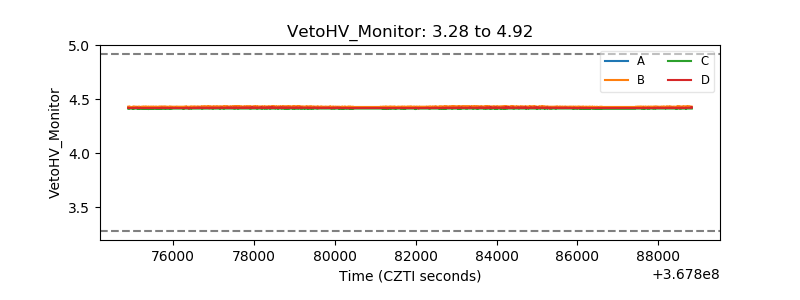 |
| Veto LLD | 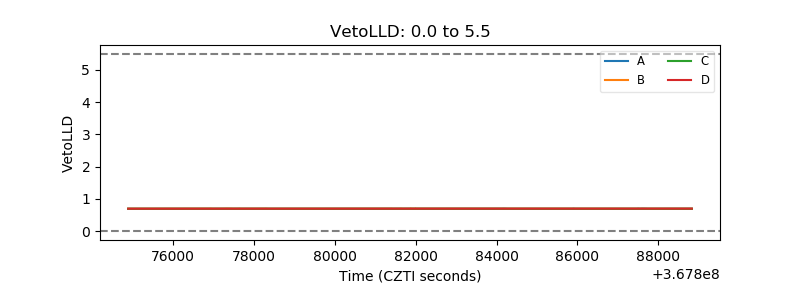 |
| Alpha Counter | 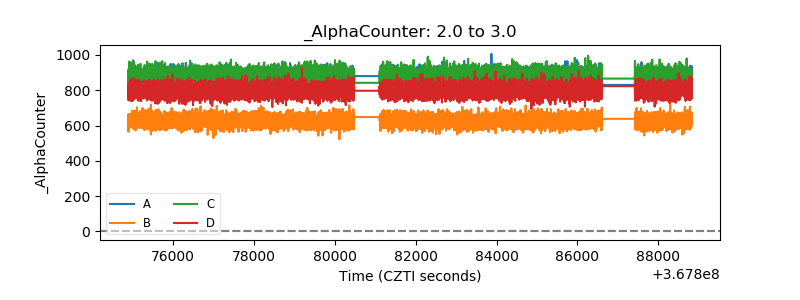 |
| _CPM_Rate | 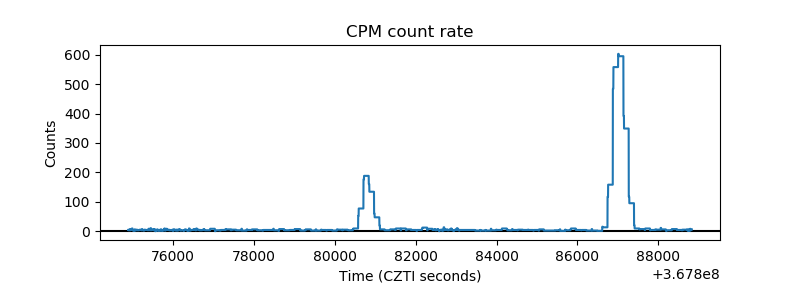 |
| CZT Counter | 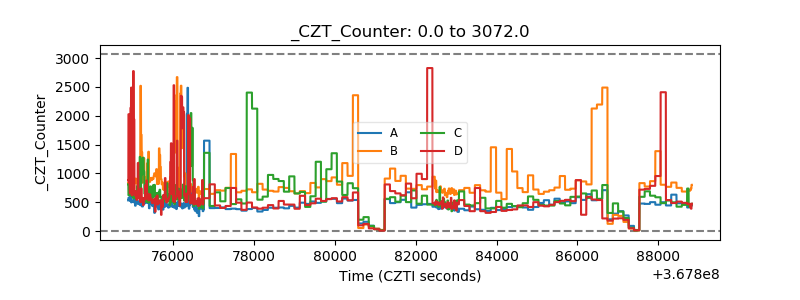 |
| +2.5 Volts monitor | 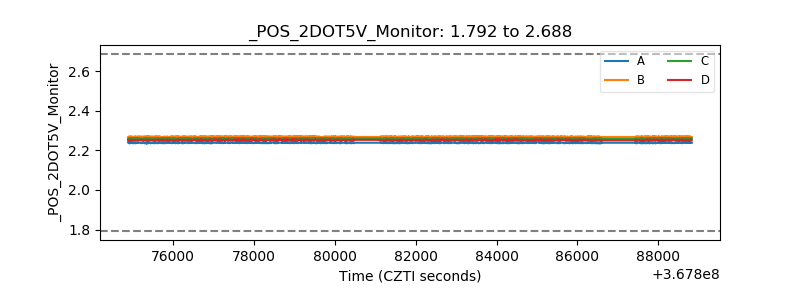 |
| +5 Volts monitor | 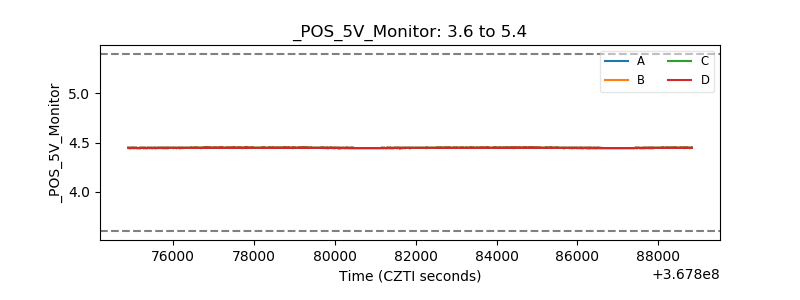 |
| _ROLL_ROT | 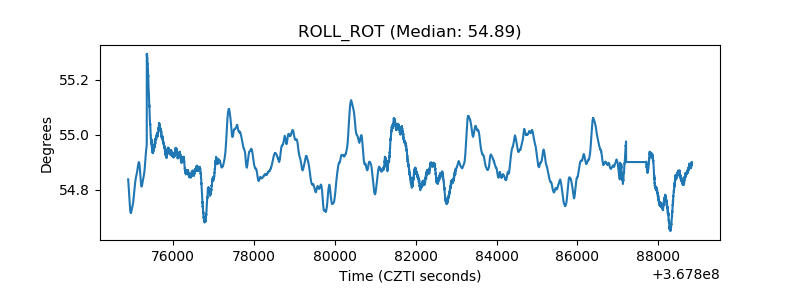 |
| _Roll_DEC | 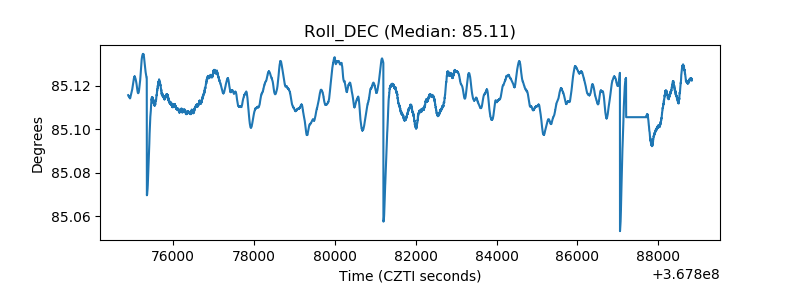 |
| _Roll_RA | 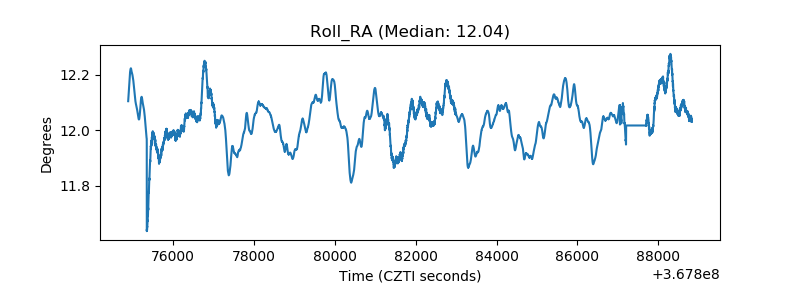 |
| Veto Counter | 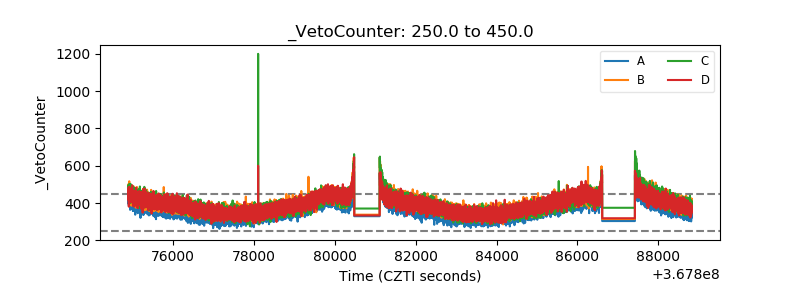 |