| Param | Original file | Final file |
|---|---|---|
| Filename | modeM0/AS1A10_057T03_9000004722_32670cztM0_level2.evt | modeM0/AS1A10_057T03_9000004722_32670cztM0_level2_quad_clean.evt |
| Size (bytes) | 534,893,760 | 66,784,320 |
| Size | 510.1 MB | 63.7 MB |
| Events in quadrant A | 3,423,859 | 424,752 |
| Events in quadrant B | 3,288,012 | 433,002 |
| Events in quadrant C | 2,883,250 | 423,188 |
| Events in quadrant D | 6,268,700 | 393,429 |
| Mode M0 | |||
|---|---|---|---|
| Quadrant | BADHDUFLAG | Total packets | Discarded packets |
| A | 0 | 13166 | 2 |
| B | 0 | 13162 | 1 |
| C | 0 | 11609 | 1 |
| D | 0 | 22147 | 1 |
| Mode M9 | |||
|---|---|---|---|
| Quadrant | BADHDUFLAG | Total packets | Discarded packets |
| A | 0 | 21 | 0 |
| B | 0 | 21 | 0 |
| C | 0 | 21 | 0 |
| D | 0 | 21 | 0 |
| Mode SS | |||
|---|---|---|---|
| Quadrant | BADHDUFLAG | Total packets | Discarded packets |
| A | 0 | 102 | 0 |
| B | 0 | 102 | 0 |
| C | 0 | 102 | 0 |
| D | 0 | 102 | 0 |
| Quadrant | Total seconds | Saturated seconds | Saturation percentage |
|---|---|---|---|
| A | 4955 | 238 | 4.803229% |
| B | 4955 | 47 | 0.948537% |
| C | 4955 | 94 | 1.897074% |
| D | 4955 | 948 | 19.132190% |
Noise dominated data is calculated using 1-second bins in cleaned event files. If a bin has >2000 counts, and if more than 50% of those come from <1% of pixels, then it is considered to be noise-dominated and hence unusable.
| Quadrant | # 1 sec bins | Bins with >0 counts | Bins with >2000 counts | High rate bins dominated by noise | Noise dominated (total time) | Noise dominated (detector-on time) | Marked lightcurve |
|---|---|---|---|---|---|---|---|
| A | 7048 | 4956 | 195 | 195 | 2.77% | 3.93% | 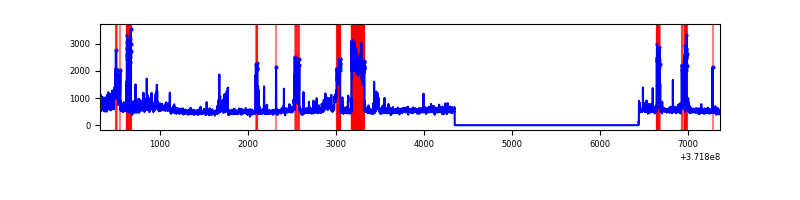 |
| B | 7048 | 4956 | 33 | 33 | 0.47% | 0.67% | 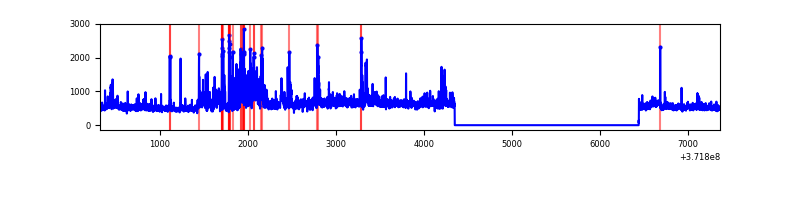 |
| C | 7048 | 4956 | 80 | 80 | 1.14% | 1.61% | 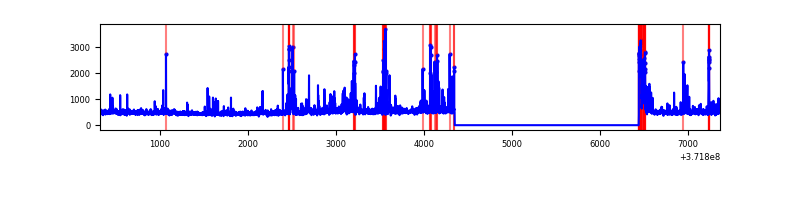 |
| D | 7048 | 4956 | 911 | 911 | 12.93% | 18.38% | 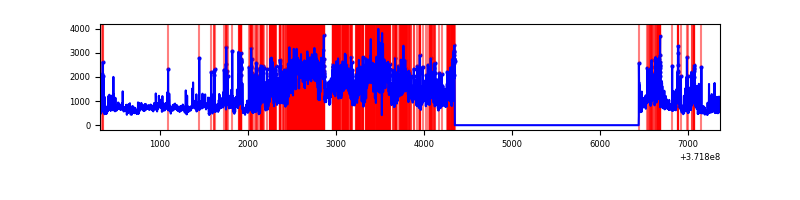 |
Top three noisy pixels from each quadrant. If the there are fewer than three noisy pixels in the level2.evt file, extra rows are filled as -1
| Pixel properties | Quadrant properties | ||||||
|---|---|---|---|---|---|---|---|
| Quadrant | DetID | PixID | Counts | Sigma | Mean | Median | Sigma |
| A | 15 | 249 | 968123 | 8008.99 | 612 | 602 | 120.8 |
| A | 0 | 253 | 23846 | 192.41 | 612 | 602 | 120.8 |
| A | 14 | 239 | 12606 | 99.37 | 612 | 602 | 120.8 |
| B | 0 | 219 | 276366 | 2345.93 | 625 | 614 | 117.5 |
| B | 3 | 26 | 229788 | 1949.67 | 625 | 614 | 117.5 |
| B | 12 | 1 | 145757 | 1234.79 | 625 | 614 | 117.5 |
| C | 8 | 35 | 238271 | 1764.85 | 592 | 597 | 134.7 |
| C | 0 | 10 | 139510 | 1031.5 | 592 | 597 | 134.7 |
| C | 0 | 207 | 48428 | 355.17 | 592 | 597 | 134.7 |
| D | 8 | 195 | 892510 | 6874.55 | 556 | 546 | 129.7 |
| D | 12 | 33 | 750164 | 5777.46 | 556 | 546 | 129.7 |
| D | 7 | 38 | 738821 | 5690.04 | 556 | 546 | 129.7 |
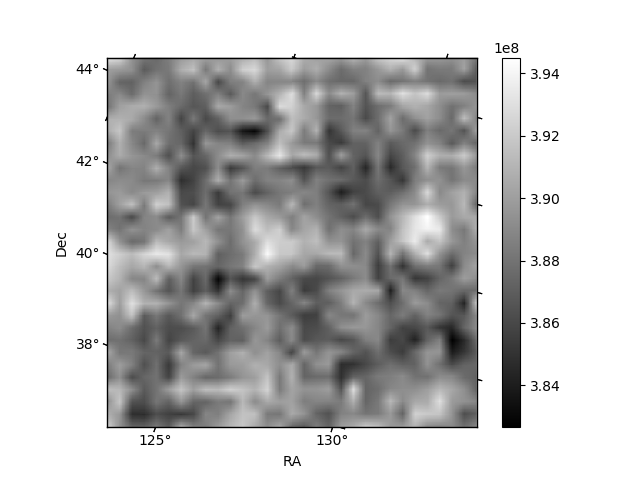
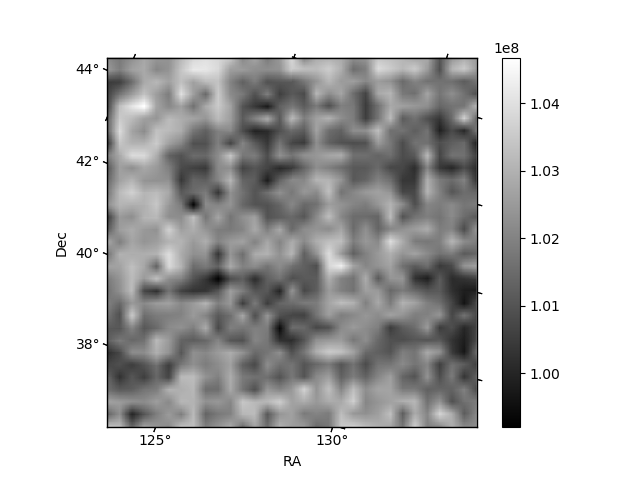
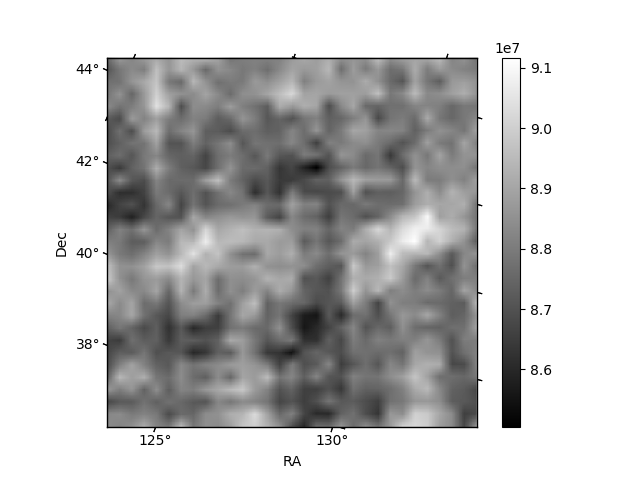
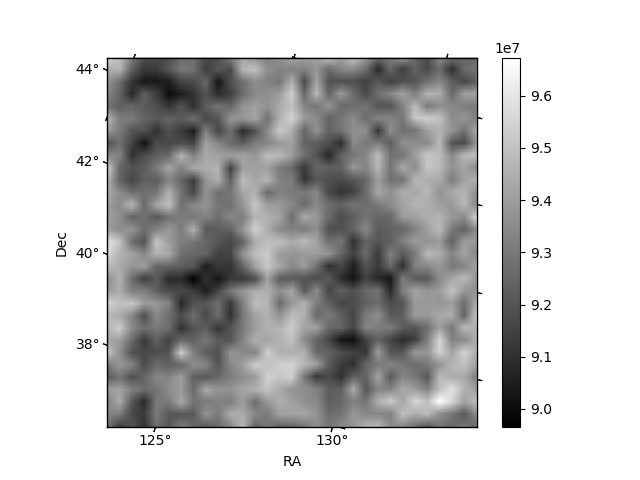
Histogram calculated using DETX and DETY for each event in the final _common_clean file
| Quadrant A | 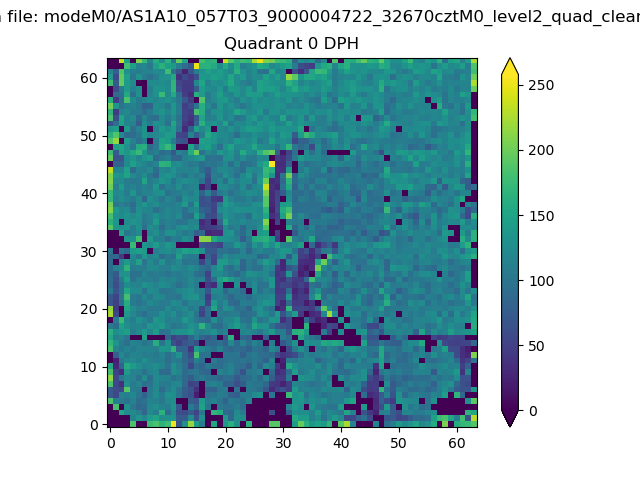 |
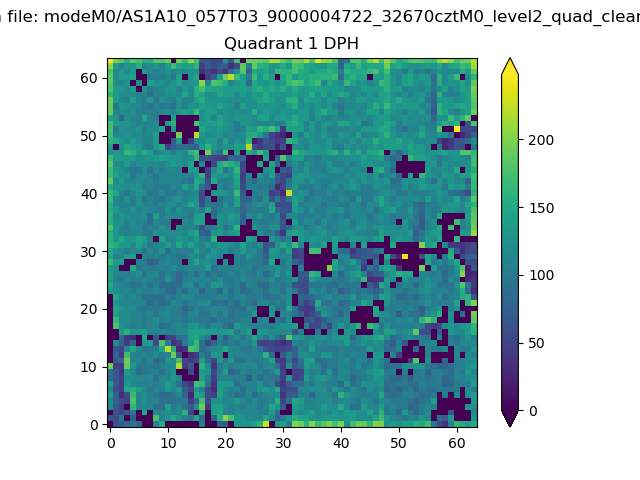 |
Quadrant B |
|---|---|---|---|
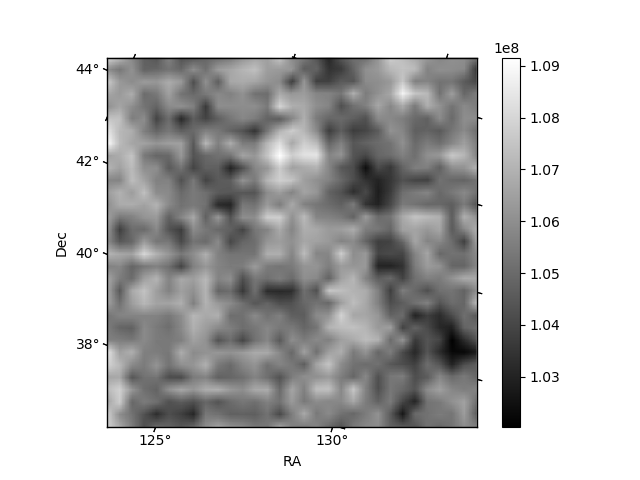
| Quadrant D | 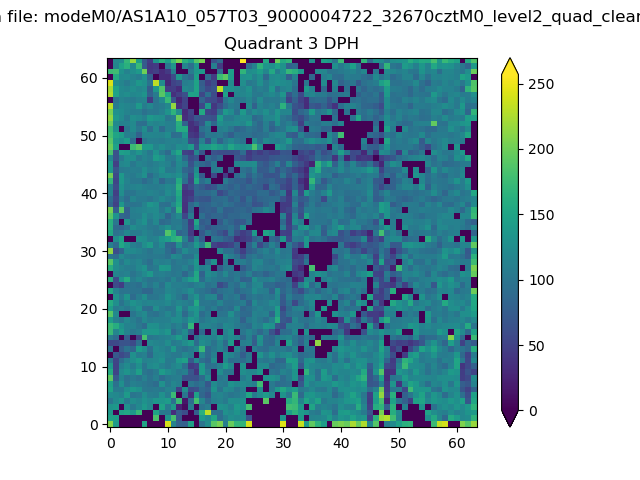 |
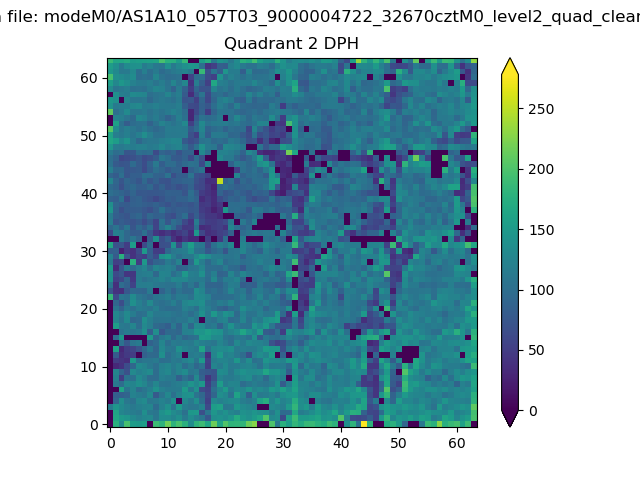 |
Quadrant C |
| Plot type | Count rate plots | Images |
|---|---|---|
| Comparison with Poisson distribution Blue bars denote a histogram of data divided into 1 sec bins. Red curve is a Poisson curve with rate = median count rate of data. |
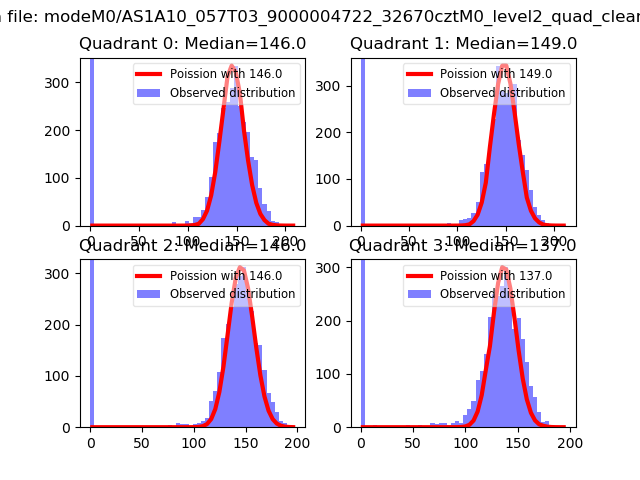 |
 |
| Quadrant-wise count rates Data is divided into 100 sec bins |
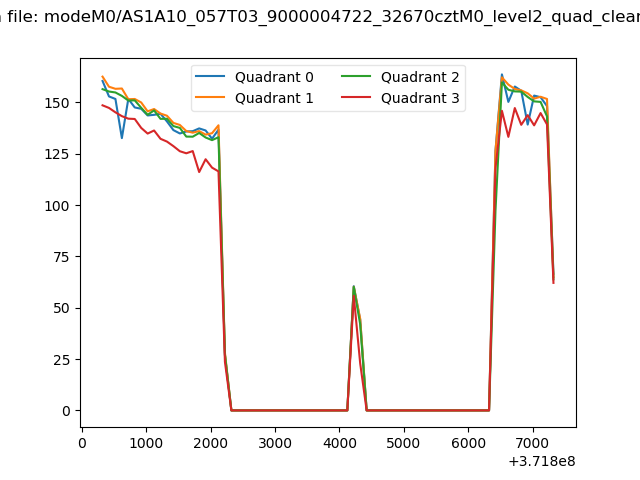 |
|
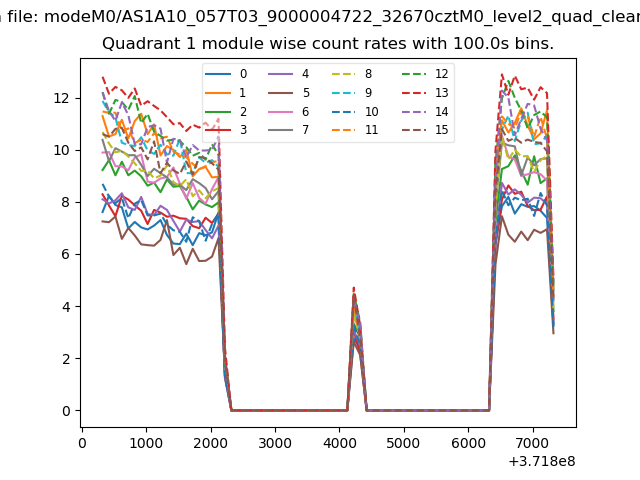
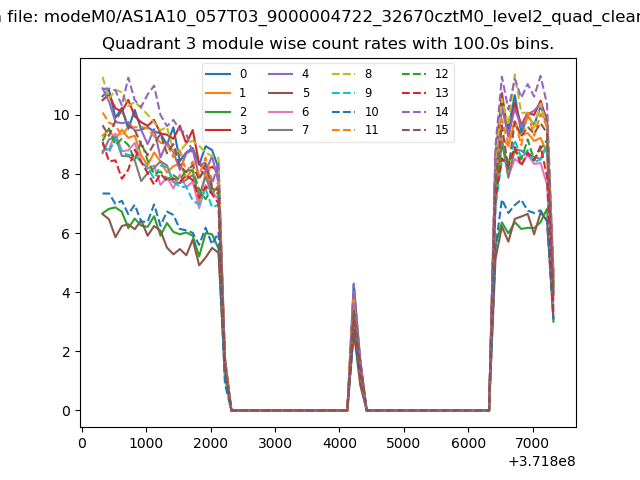
| Module-wise count rates for Quadrant A Data is divided into 100 sec bins |
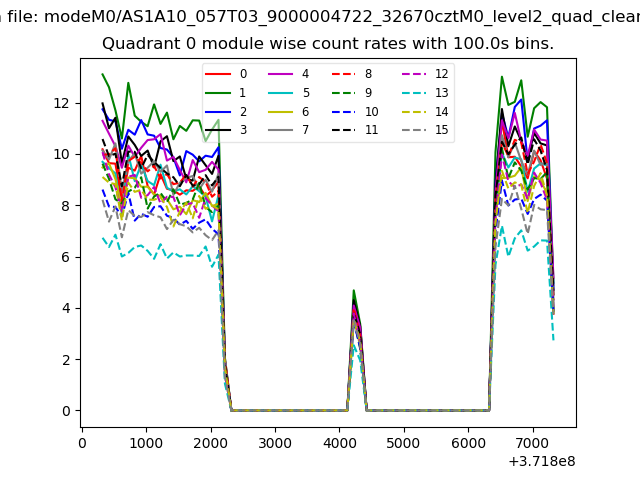 |
 |
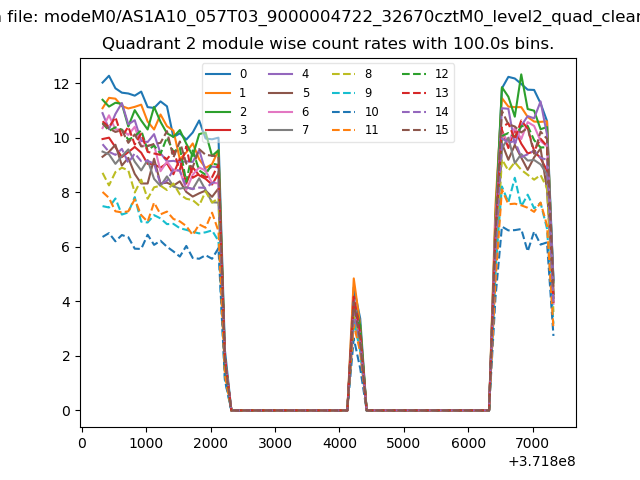
| Module-wise count rates for Quadrant B Data is divided into 100 sec bins |
 |
 |
| Module-wise count rates for Quadrant C Data is divided into 100 sec bins |
 |
 |
| Module-wise count rates for Quadrant D Data is divided into 100 sec bins |
 |
 |
| Parameter | Plot |
|---|---|
| CZT HV Monitor | 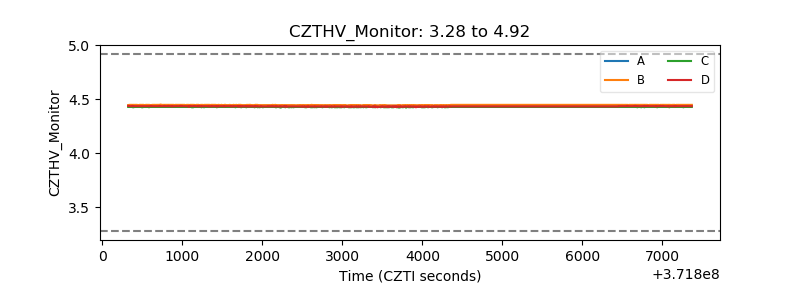 |
| D_VDD | 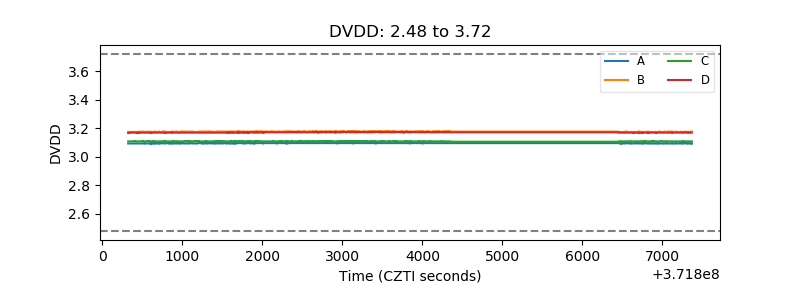 |
| Temperature 1 | 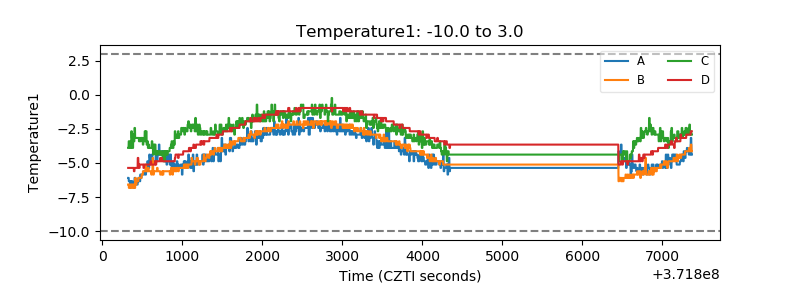 |
| Veto HV Monitor | 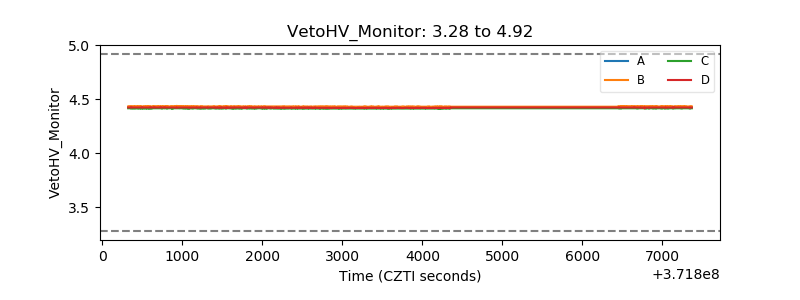 |
| Veto LLD | 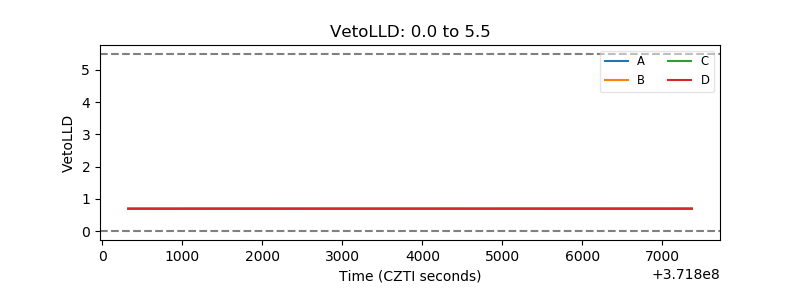 |
| Alpha Counter | 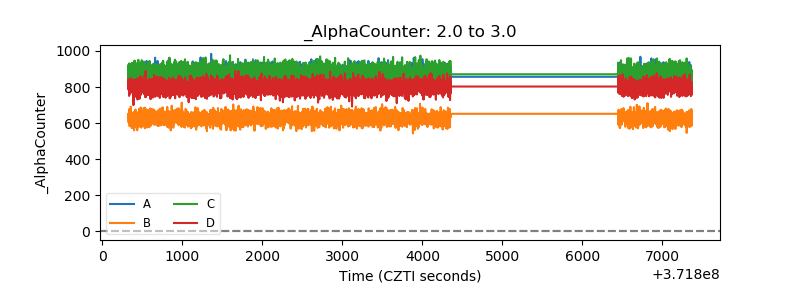 |
| _CPM_Rate | 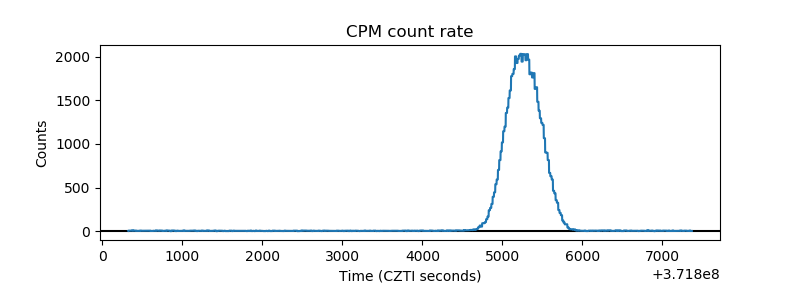 |
| CZT Counter | 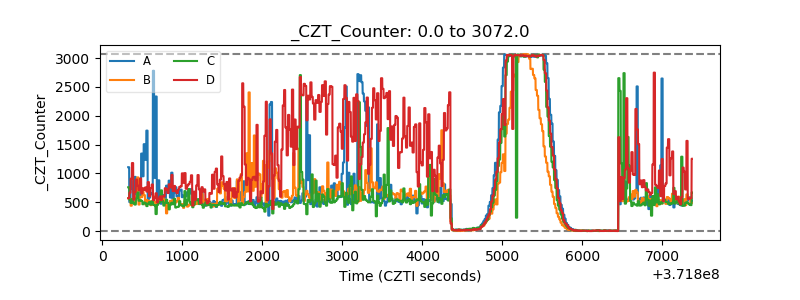 |
| +2.5 Volts monitor | 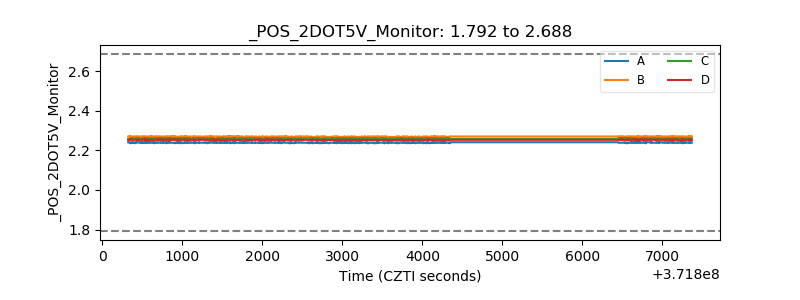 |
| +5 Volts monitor | 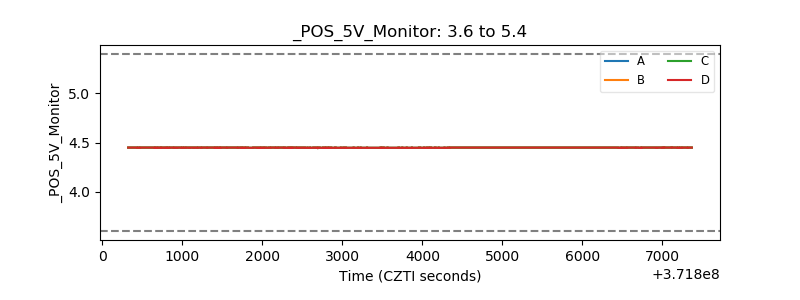 |
| _ROLL_ROT | 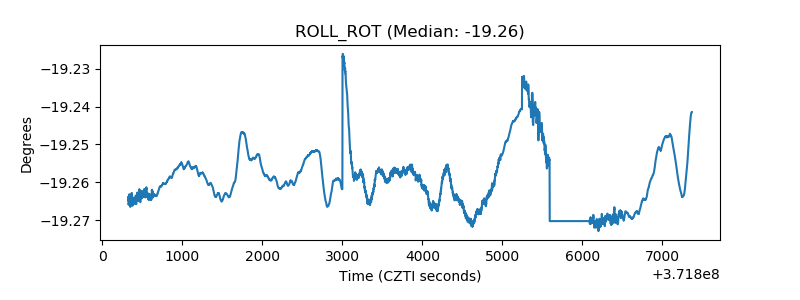 |
| _Roll_DEC | 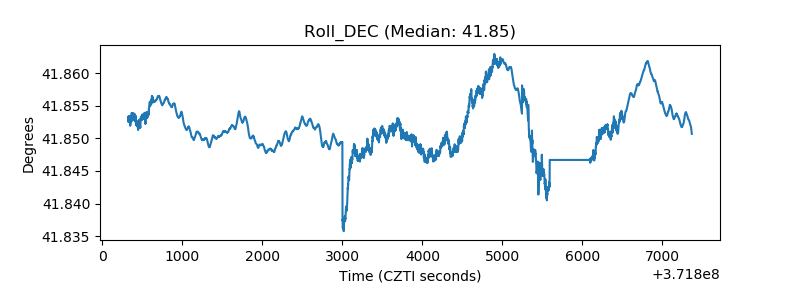 |
| _Roll_RA | 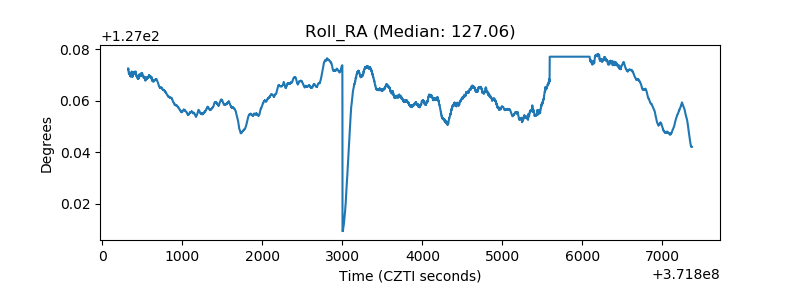 |
| Veto Counter | 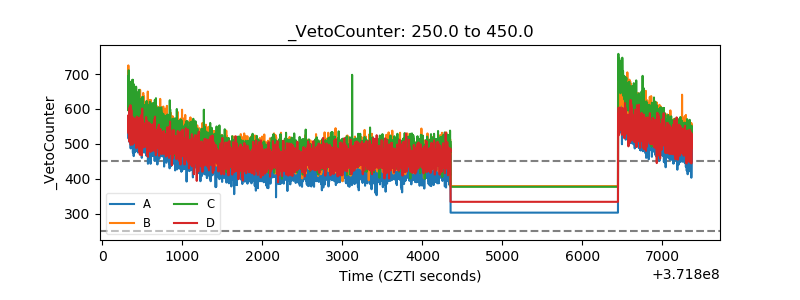 |