| Param | Original file | Final file |
|---|---|---|
| Filename | modeM0/AS1T04_064T01_9000004730_32767cztM0_level2.evt | modeM0/AS1T04_064T01_9000004730_32767cztM0_level2_quad_clean.evt |
| Size (bytes) | 554,783,040 | 57,715,200 |
| Size | 529.1 MB | 55.0 MB |
| Events in quadrant A | 3,029,580 | 347,754 |
| Events in quadrant B | 3,635,184 | 348,572 |
| Events in quadrant C | 2,885,681 | 351,537 |
| Events in quadrant D | 6,868,386 | 303,703 |
| Mode M9 | |||
|---|---|---|---|
| Quadrant | BADHDUFLAG | Total packets | Discarded packets |
| A | 0 | 28 | 0 |
| B | 0 | 28 | 0 |
| C | 0 | 28 | 0 |
| D | 0 | 29 | 0 |
| Mode SS | |||
|---|---|---|---|
| Quadrant | BADHDUFLAG | Total packets | Discarded packets |
| A | 0 | 116 | 0 |
| B | 0 | 116 | 0 |
| C | 0 | 116 | 0 |
| D | 0 | 116 | 0 |
| Mode M0 | |||
|---|---|---|---|
| Quadrant | BADHDUFLAG | Total packets | Discarded packets |
| A | 0 | 12654 | 3 |
| B | 0 | 14453 | 2 |
| C | 0 | 12208 | 2 |
| D | 0 | 24460 | 2 |
| Quadrant | Total seconds | Saturated seconds | Saturation percentage |
|---|---|---|---|
| A | 5650 | 83 | 1.469027% |
| B | 5650 | 229 | 4.053097% |
| C | 5650 | 67 | 1.185841% |
| D | 5650 | 888 | 15.716814% |
Noise dominated data is calculated using 1-second bins in cleaned event files. If a bin has >2000 counts, and if more than 50% of those come from <1% of pixels, then it is considered to be noise-dominated and hence unusable.
| Quadrant | # 1 sec bins | Bins with >0 counts | Bins with >2000 counts | High rate bins dominated by noise | Noise dominated (total time) | Noise dominated (detector-on time) | Marked lightcurve |
|---|---|---|---|---|---|---|---|
| A | 7352 | 5651 | 51 | 51 | 0.69% | 0.90% | 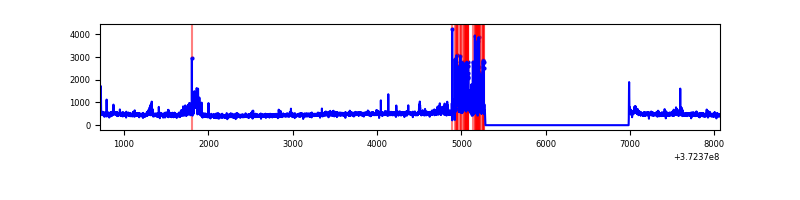 |
| B | 7352 | 5651 | 118 | 118 | 1.61% | 2.09% | 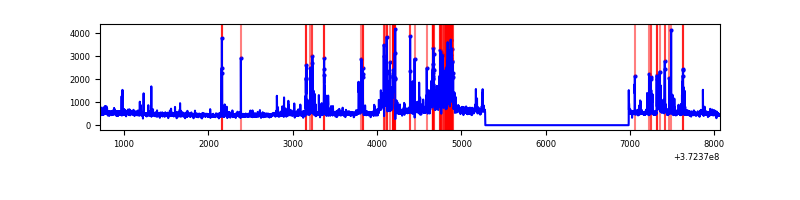 |
| C | 7352 | 5651 | 48 | 48 | 0.65% | 0.85% | 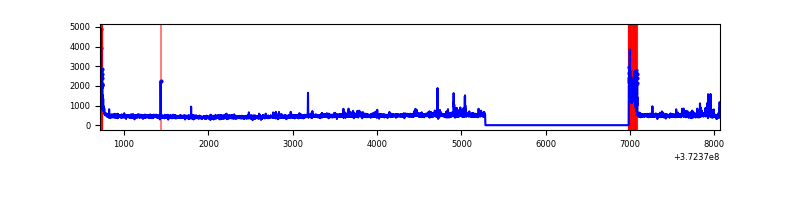 |
| D | 7352 | 5651 | 645 | 645 | 8.77% | 11.41% | 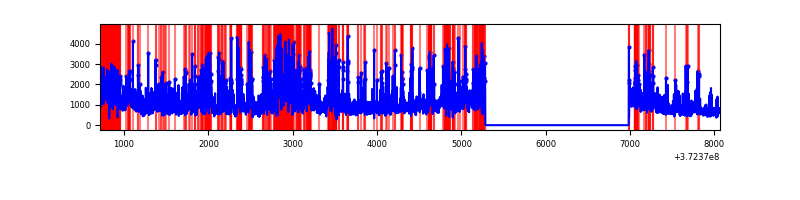 |
Top three noisy pixels from each quadrant. If the there are fewer than three noisy pixels in the level2.evt file, extra rows are filled as -1
| Pixel properties | Quadrant properties | ||||||
|---|---|---|---|---|---|---|---|
| Quadrant | DetID | PixID | Counts | Sigma | Mean | Median | Sigma |
| A | 15 | 237 | 254079 | 1881.45 | 669 | 656 | 134.7 |
| A | 12 | 16 | 129827 | 958.98 | 669 | 656 | 134.7 |
| A | 12 | 194 | 22587 | 162.82 | 669 | 656 | 134.7 |
| B | 12 | 1 | 365823 | 2830.7 | 672 | 658 | 129.0 |
| B | 5 | 172 | 103679 | 798.6 | 672 | 658 | 129.0 |
| B | 0 | 197 | 81386 | 625.79 | 672 | 658 | 129.0 |
| C | 0 | 10 | 258370 | 1699.34 | 652 | 657 | 151.7 |
| C | 3 | 233 | 31595 | 204.0 | 652 | 657 | 151.7 |
| C | 14 | 67 | 14797 | 93.24 | 652 | 657 | 151.7 |
| D | 8 | 195 | 1351153 | 8878.41 | 604 | 589 | 152.1 |
| D | 2 | 250 | 1324185 | 8701.13 | 604 | 589 | 152.1 |
| D | 12 | 17 | 1315075 | 8641.24 | 604 | 589 | 152.1 |
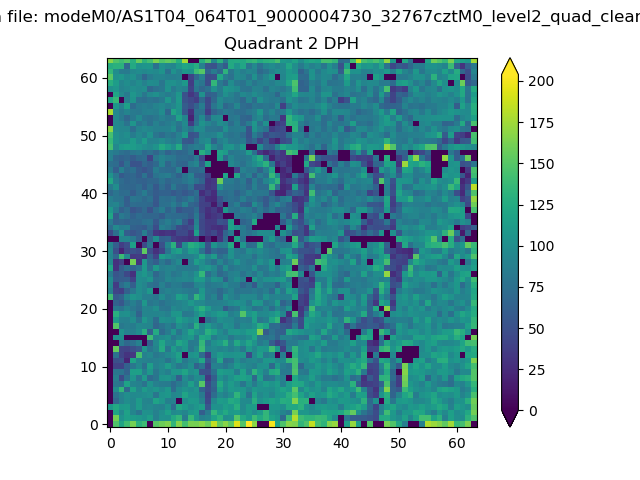
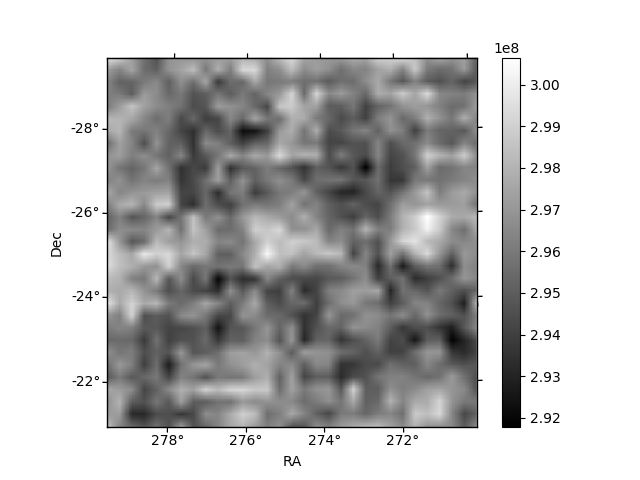
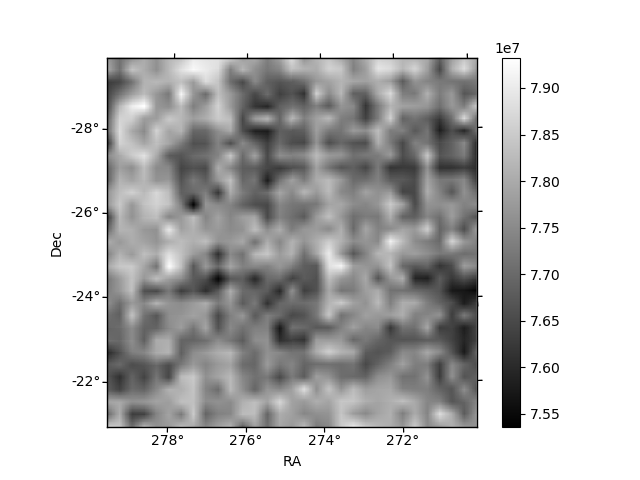
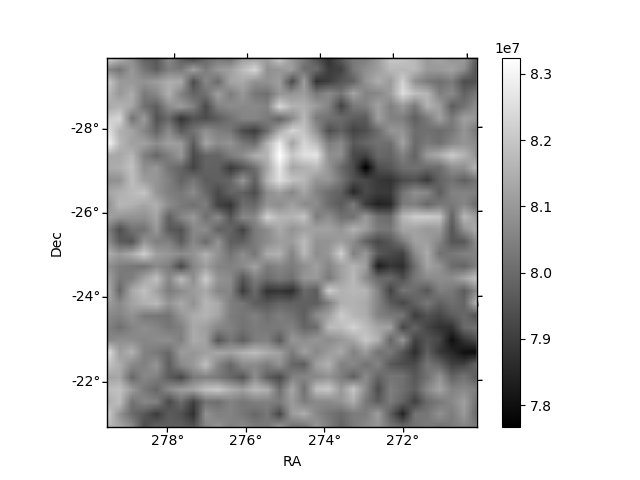
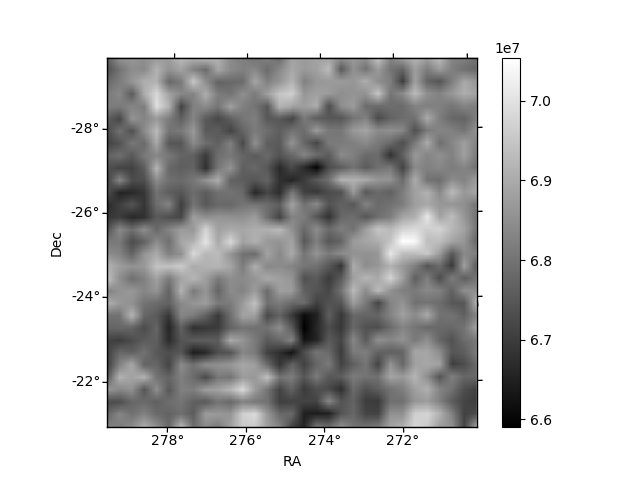
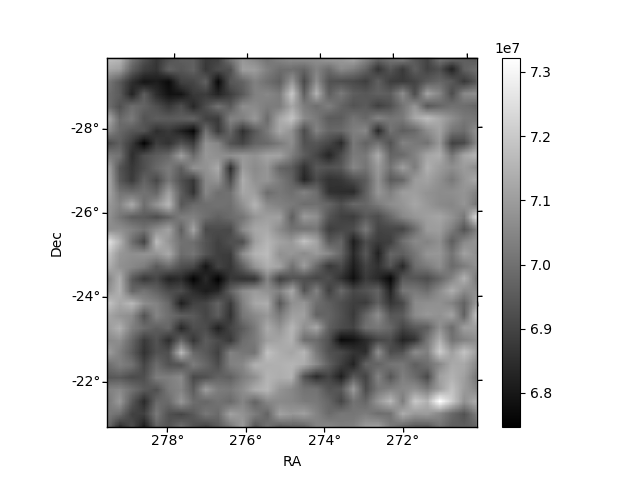
Histogram calculated using DETX and DETY for each event in the final _common_clean file
| Quadrant A | 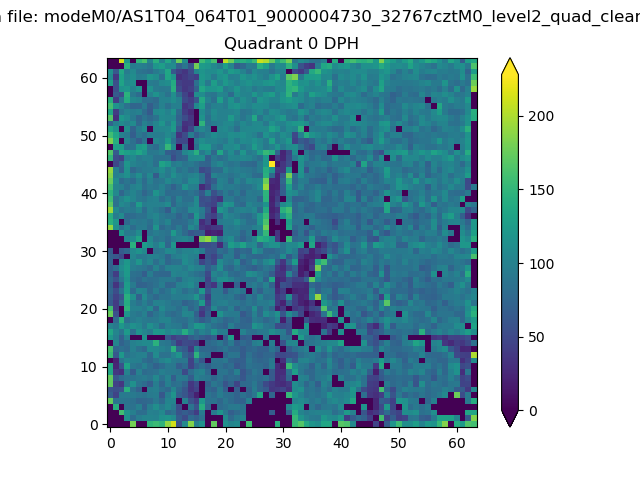 |
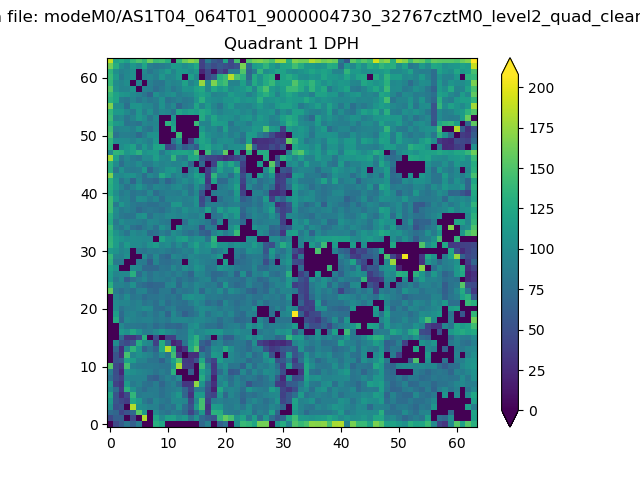 |
Quadrant B |
|---|---|---|---|
| Quadrant D | 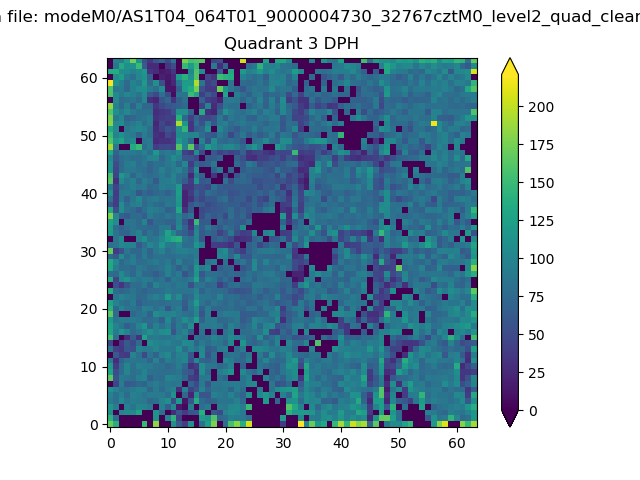 |
 |
Quadrant C |
| Plot type | Count rate plots | Images |
|---|---|---|
| Comparison with Poisson distribution Blue bars denote a histogram of data divided into 1 sec bins. Red curve is a Poisson curve with rate = median count rate of data. |
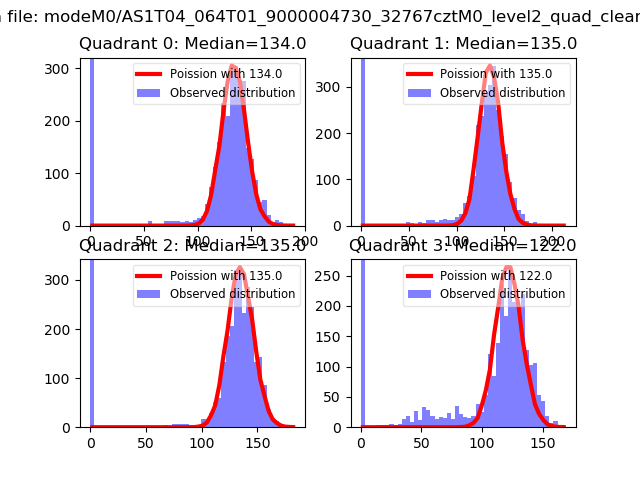 |
 |
| Quadrant-wise count rates Data is divided into 100 sec bins |
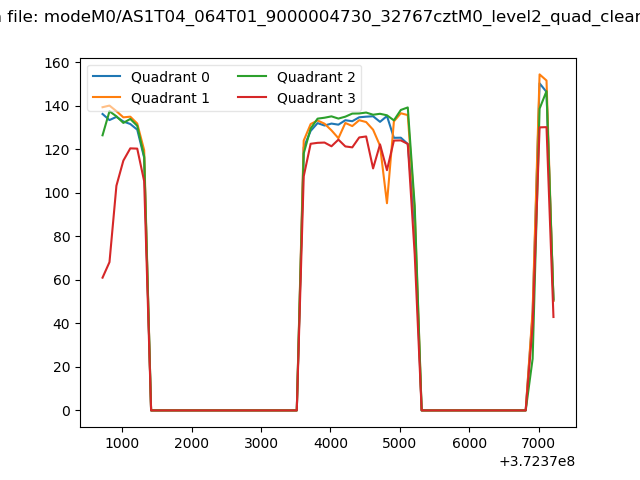 |
|
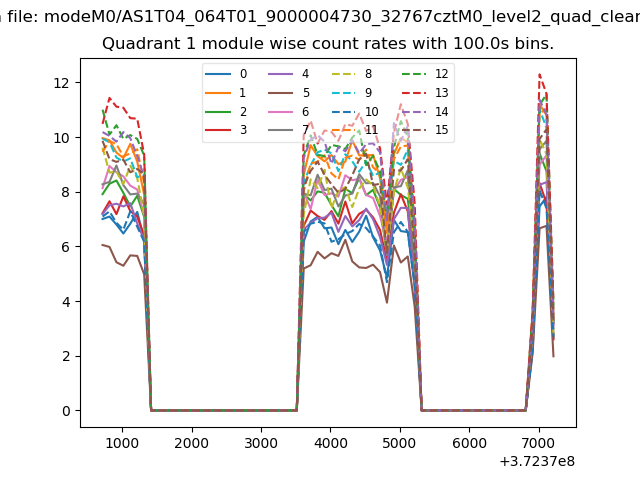
| Module-wise count rates for Quadrant A Data is divided into 100 sec bins |
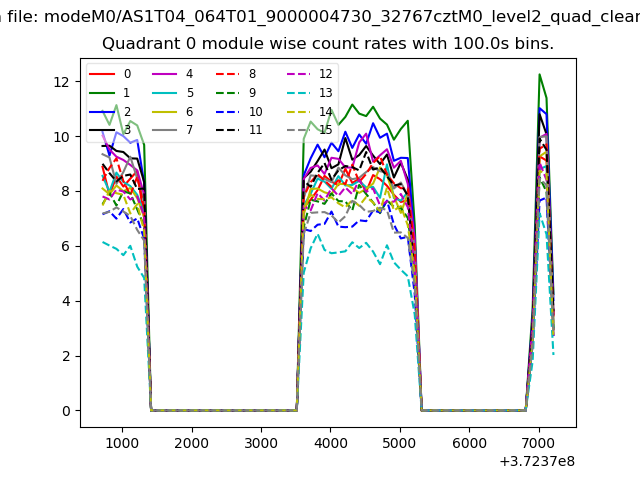 |
 |
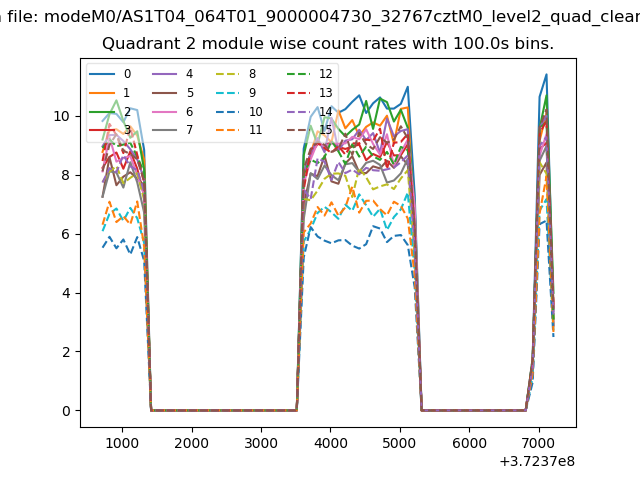
| Module-wise count rates for Quadrant B Data is divided into 100 sec bins |
 |
 |
| Module-wise count rates for Quadrant C Data is divided into 100 sec bins |
 |
 |
| Module-wise count rates for Quadrant D Data is divided into 100 sec bins |
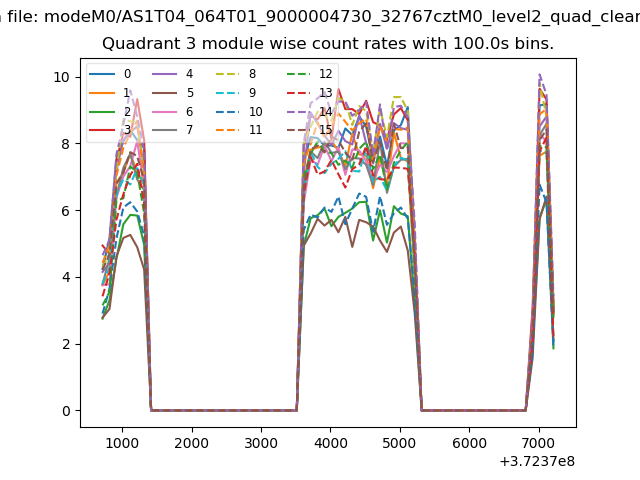 |
 |
| Parameter | Plot |
|---|---|
| CZT HV Monitor | 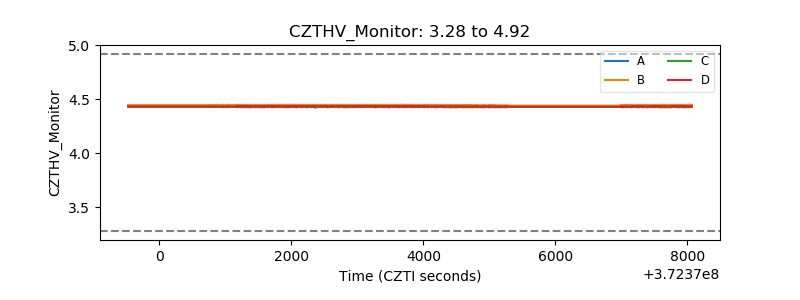 |
| D_VDD | 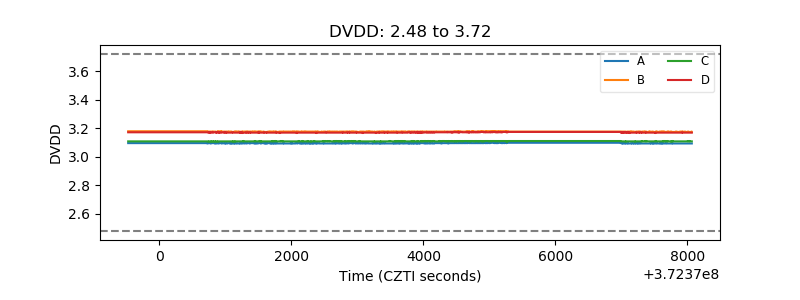 |
| Temperature 1 | 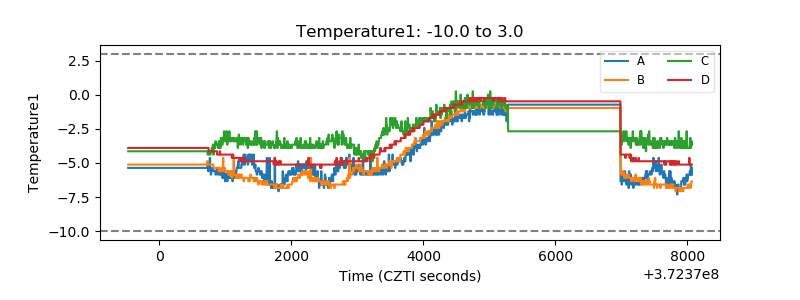 |
| Veto HV Monitor | 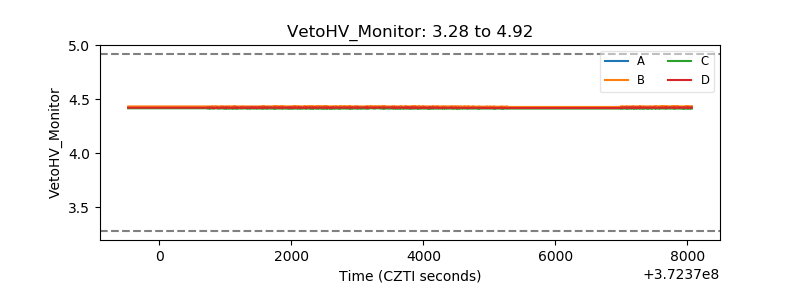 |
| Veto LLD | 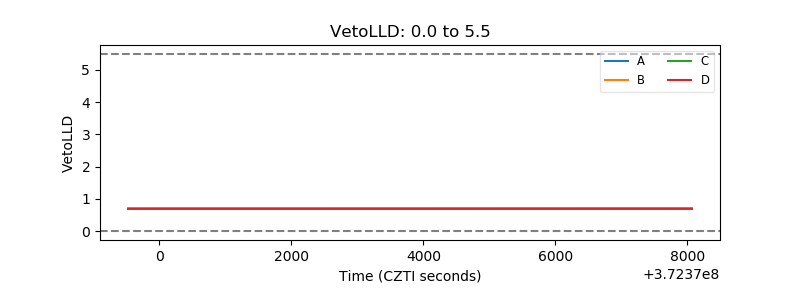 |
| Alpha Counter | 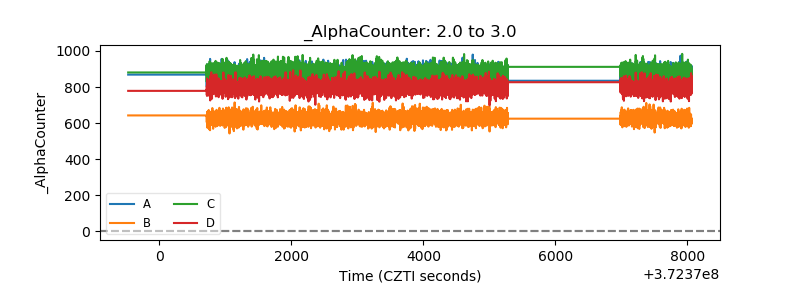 |
| _CPM_Rate | 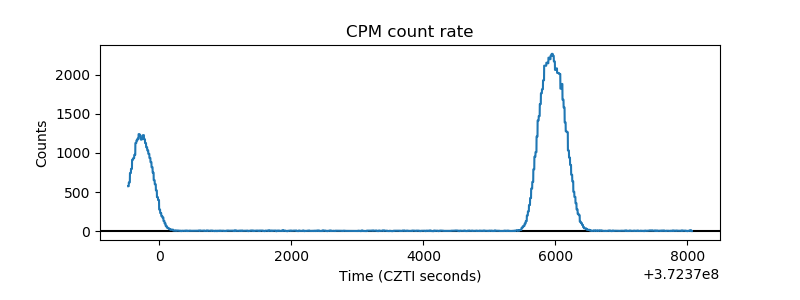 |
| CZT Counter | 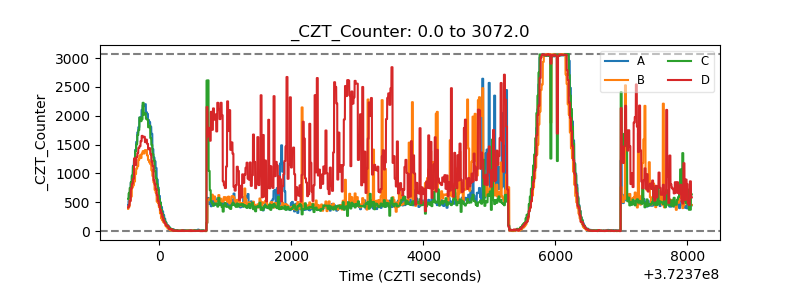 |
| +2.5 Volts monitor | 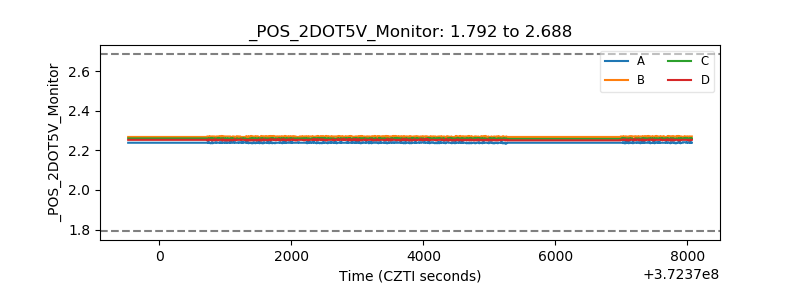 |
| +5 Volts monitor | 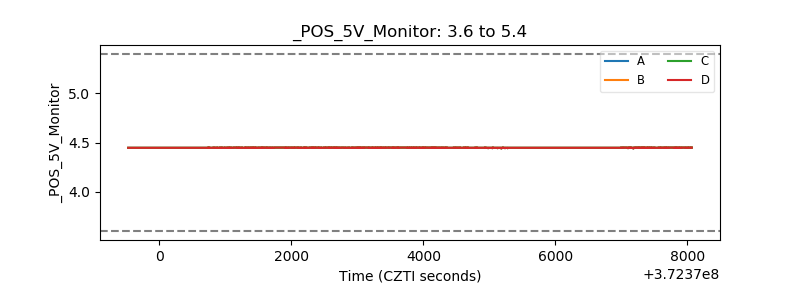 |
| _ROLL_ROT | 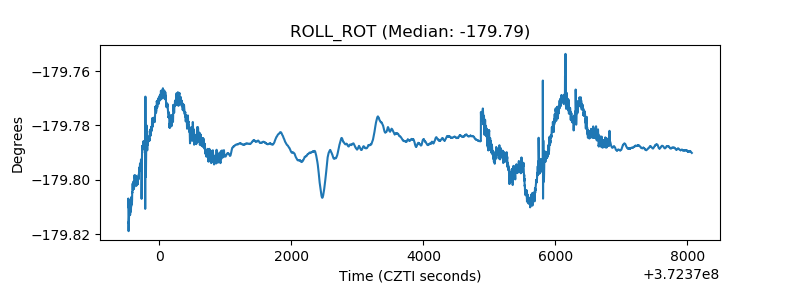 |
| _Roll_DEC | 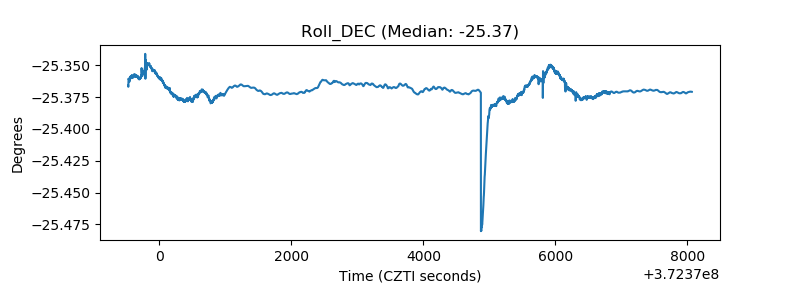 |
| _Roll_RA | 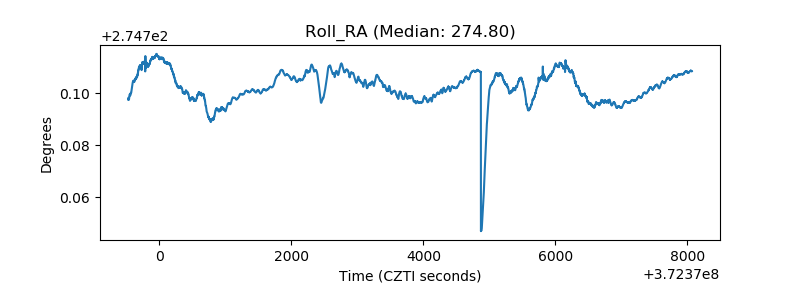 |
| Veto Counter | 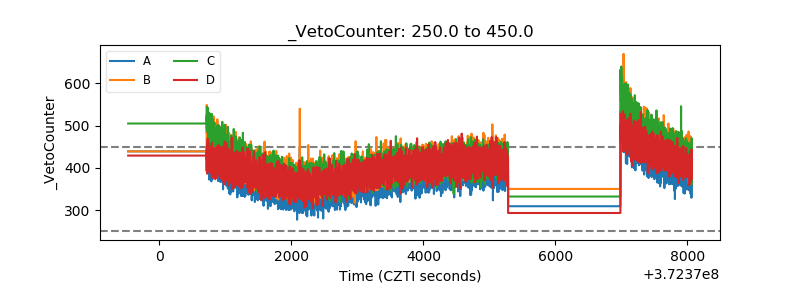 |