| Param | Original file | Final file |
|---|---|---|
| Filename | modeM0/AS1A11_007T07_9000004758_33077cztM0_level2.evt | modeM0/AS1A11_007T07_9000004758_33077cztM0_level2_quad_clean.evt |
| Size (bytes) | 695,738,880 | 63,541,440 |
| Size | 663.5 MB | 60.6 MB |
| Events in quadrant A | 2,347,056 | 480,996 |
| Events in quadrant B | 3,098,575 | 463,195 |
| Events in quadrant C | 3,546,767 | 467,827 |
| Events in quadrant D | 11,749,010 | 168,856 |
| Mode SS | |||
|---|---|---|---|
| Quadrant | BADHDUFLAG | Total packets | Discarded packets |
| A | 0 | 98 | 0 |
| B | 0 | 98 | 0 |
| C | 0 | 98 | 0 |
| D | 0 | 98 | 0 |
| Mode M0 | |||
|---|---|---|---|
| Quadrant | BADHDUFLAG | Total packets | Discarded packets |
| A | 0 | 9922 | 2 |
| B | 0 | 12249 | 1 |
| C | 0 | 13605 | 1 |
| D | 0 | 38246 | 1 |
| Mode M9 | |||
|---|---|---|---|
| Quadrant | BADHDUFLAG | Total packets | Discarded packets |
| A | 0 | 32 | 0 |
| B | 0 | 32 | 0 |
| C | 0 | 32 | 0 |
| D | 0 | 33 | 0 |
| Quadrant | Total seconds | Saturated seconds | Saturation percentage |
|---|---|---|---|
| A | 4869 | 2 | 0.041076% |
| B | 4869 | 189 | 3.881701% |
| C | 4869 | 252 | 5.175601% |
| D | 4869 | 3944 | 81.002259% |
Noise dominated data is calculated using 1-second bins in cleaned event files. If a bin has >2000 counts, and if more than 50% of those come from <1% of pixels, then it is considered to be noise-dominated and hence unusable.
| Quadrant | # 1 sec bins | Bins with >0 counts | Bins with >2000 counts | High rate bins dominated by noise | Noise dominated (total time) | Noise dominated (detector-on time) | Marked lightcurve |
|---|---|---|---|---|---|---|---|
| A | 6991 | 4870 | 0 | 0 | 0.00% | 0.00% | 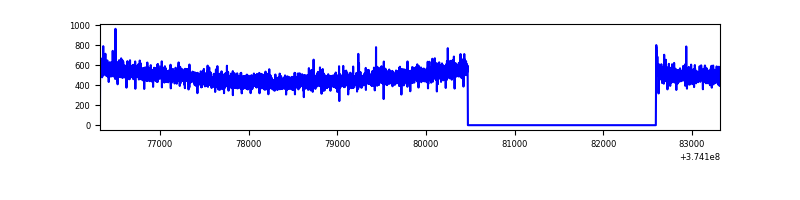 |
| B | 6991 | 4870 | 145 | 145 | 2.07% | 2.98% | 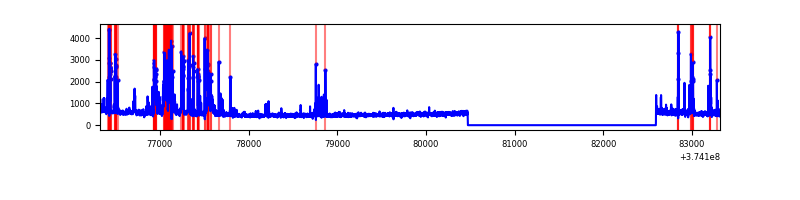 |
| C | 6991 | 4870 | 221 | 221 | 3.16% | 4.54% | 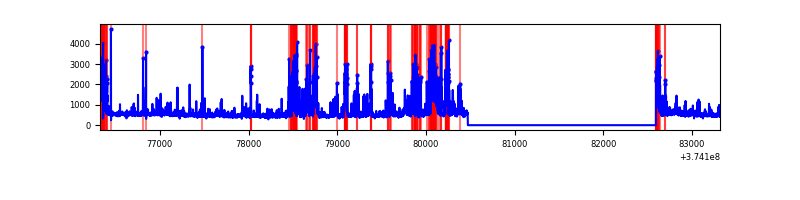 |
| D | 6990 | 4869 | 4066 | 4066 | 58.17% | 83.51% | 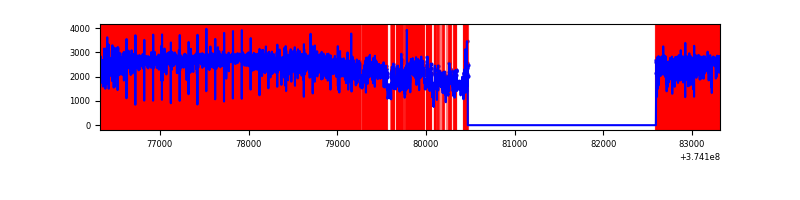 |
Top three noisy pixels from each quadrant. If the there are fewer than three noisy pixels in the level2.evt file, extra rows are filled as -1
| Pixel properties | Quadrant properties | ||||||
|---|---|---|---|---|---|---|---|
| Quadrant | DetID | PixID | Counts | Sigma | Mean | Median | Sigma |
| A | 10 | 17 | 22870 | 186.72 | 596 | 585 | 119.3 |
| A | 13 | 254 | 11759 | 93.62 | 596 | 585 | 119.3 |
| A | 15 | 169 | 9777 | 77.02 | 596 | 585 | 119.3 |
| B | 5 | 172 | 480647 | 4413.15 | 583 | 569 | 108.8 |
| B | 5 | 200 | 108783 | 994.76 | 583 | 569 | 108.8 |
| B | 15 | 85 | 53078 | 482.69 | 583 | 569 | 108.8 |
| C | 8 | 111 | 734612 | 5566.19 | 573 | 578 | 131.9 |
| C | 7 | 221 | 253351 | 1916.78 | 573 | 578 | 131.9 |
| C | 0 | 10 | 199349 | 1507.28 | 573 | 578 | 131.9 |
| D | 7 | 223 | 8421897 | 91201.19 | 353 | 347 | 92.3 |
| D | 12 | 218 | 1252408 | 13559.2 | 353 | 347 | 92.3 |
| D | 8 | 195 | 317589 | 3435.57 | 353 | 347 | 92.3 |
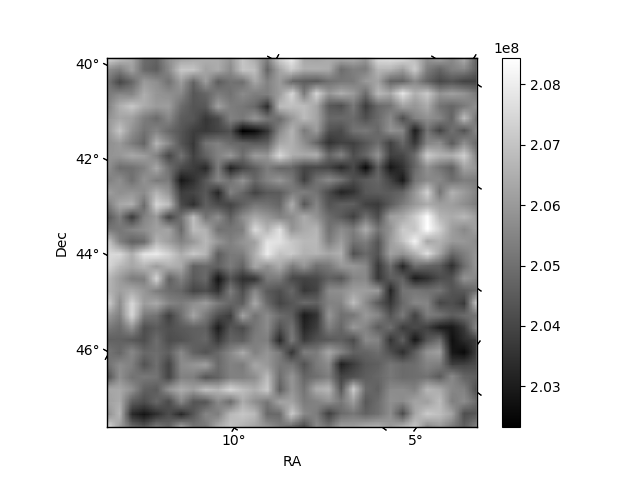
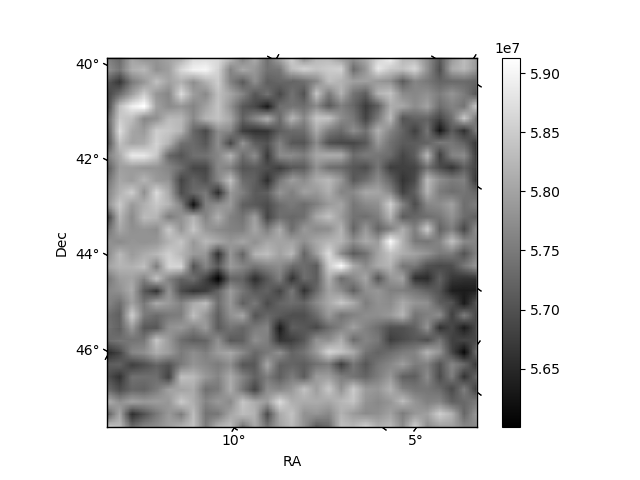
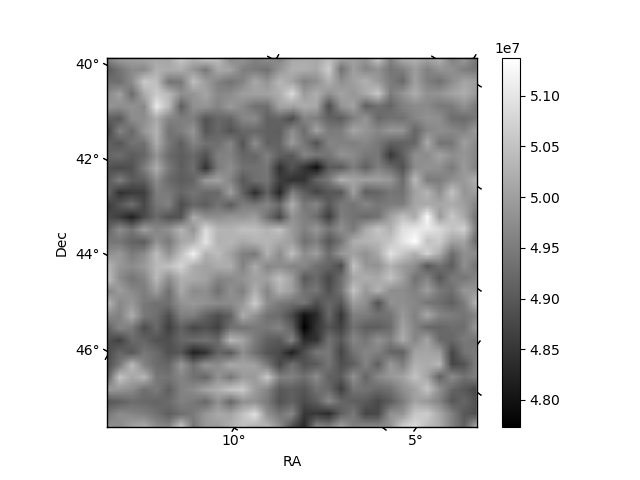
Histogram calculated using DETX and DETY for each event in the final _common_clean file
| Quadrant A | 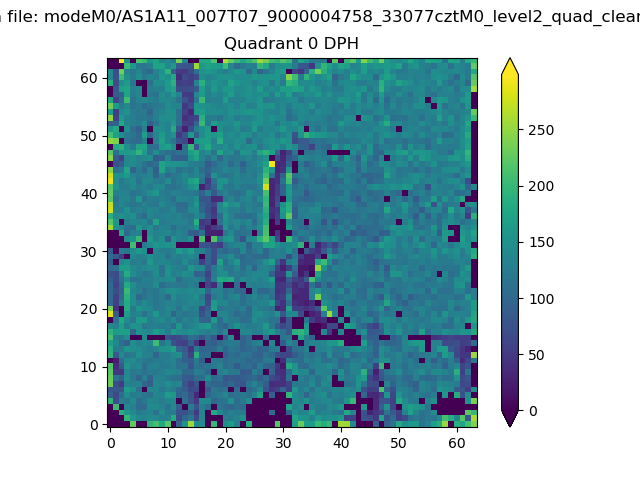 |
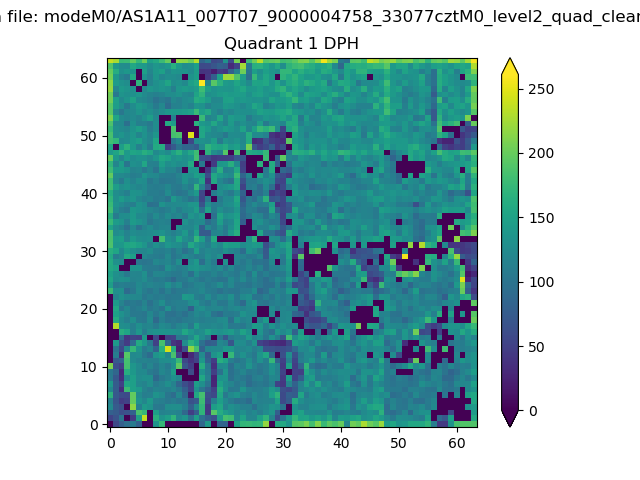 |
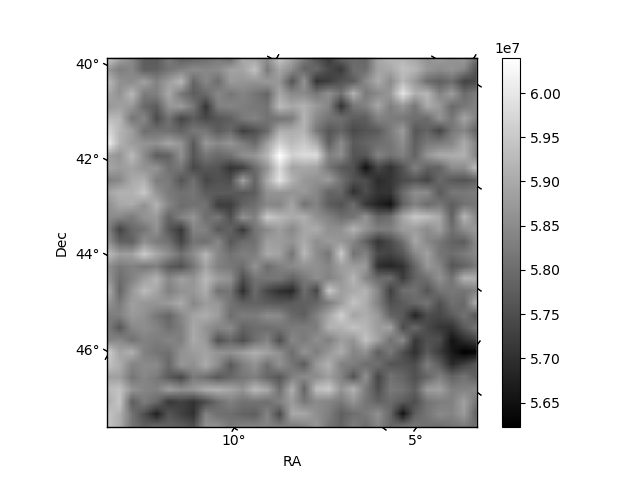
Quadrant B |
|---|---|---|---|
| Quadrant D | 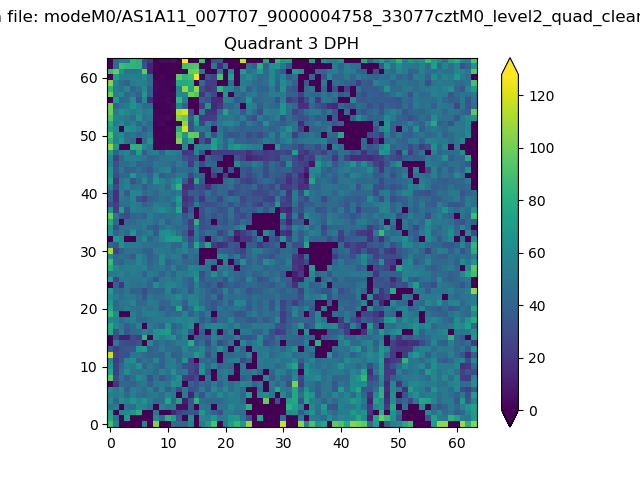 |
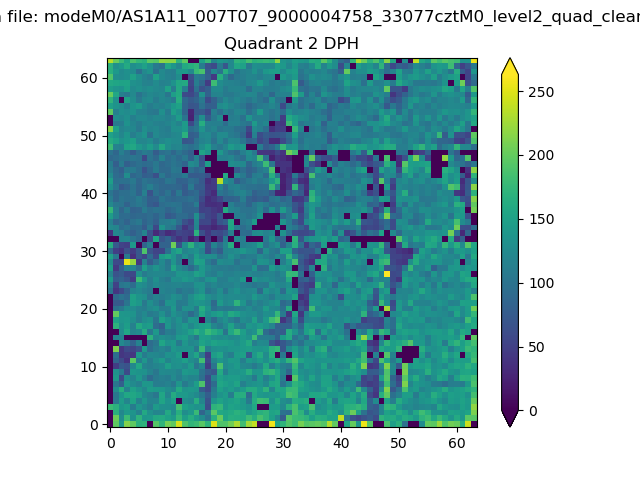 |
Quadrant C |
| Plot type | Count rate plots | Images |
|---|---|---|
| Comparison with Poisson distribution Blue bars denote a histogram of data divided into 1 sec bins. Red curve is a Poisson curve with rate = median count rate of data. |
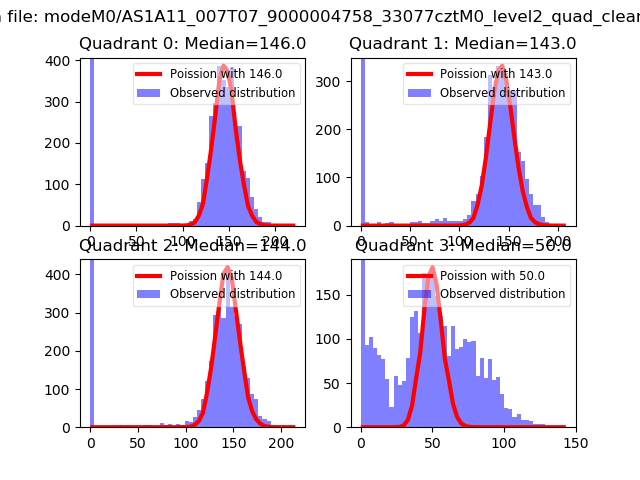 |
 |
| Quadrant-wise count rates Data is divided into 100 sec bins |
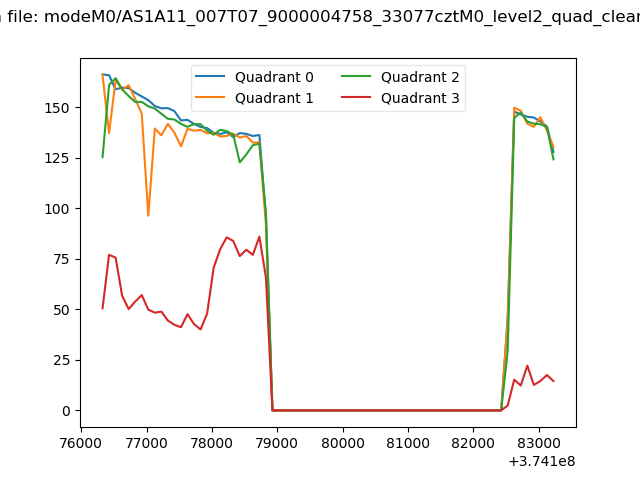 |
|
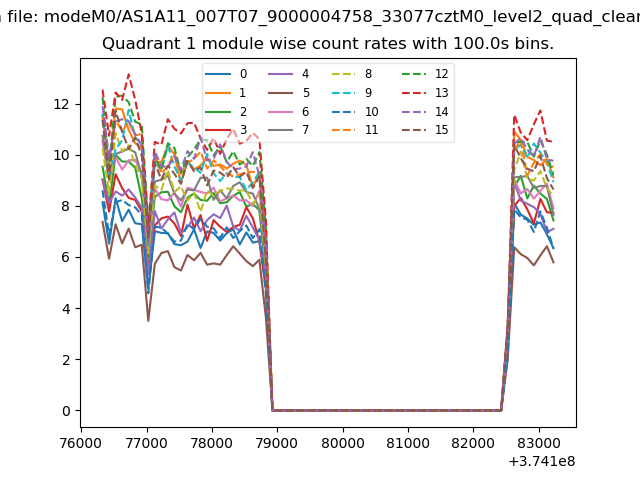
| Module-wise count rates for Quadrant A Data is divided into 100 sec bins |
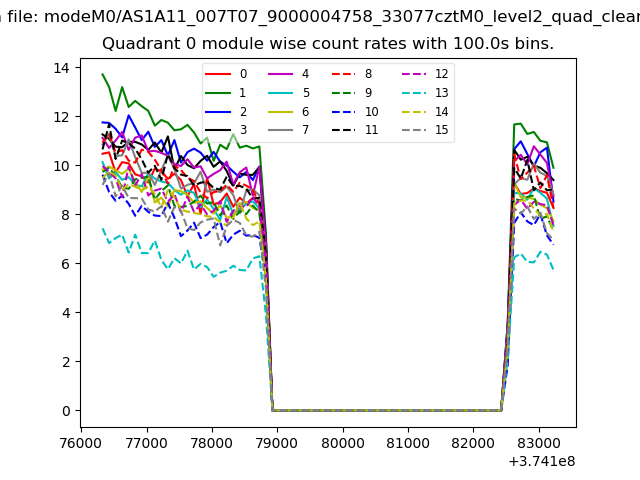 |
 |
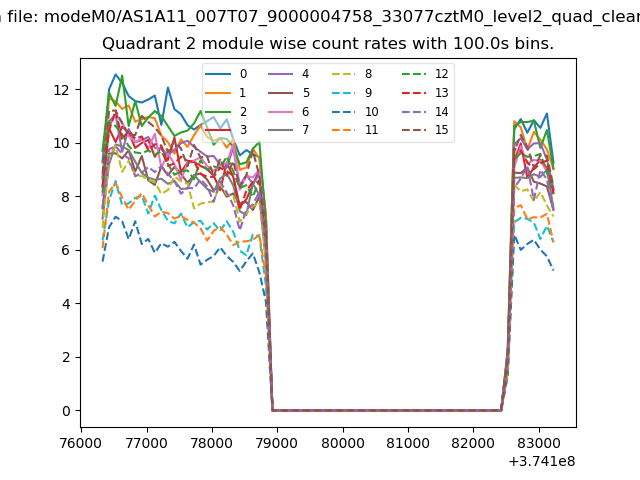
| Module-wise count rates for Quadrant B Data is divided into 100 sec bins |
 |
 |
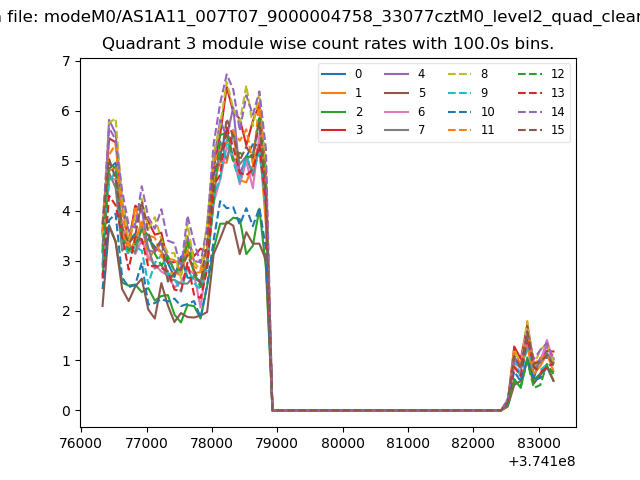
| Module-wise count rates for Quadrant C Data is divided into 100 sec bins |
 |
 |
| Module-wise count rates for Quadrant D Data is divided into 100 sec bins |
 |
 |
| Parameter | Plot |
|---|---|
| CZT HV Monitor | 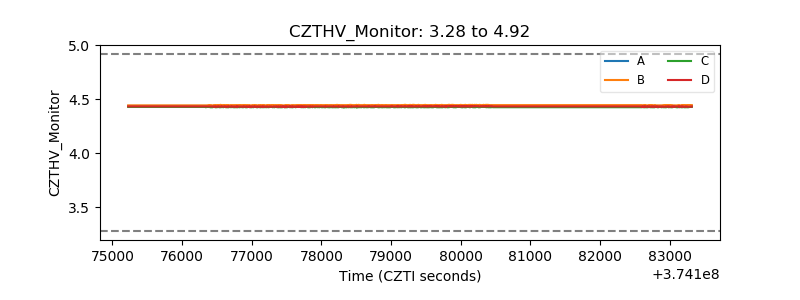 |
| D_VDD | 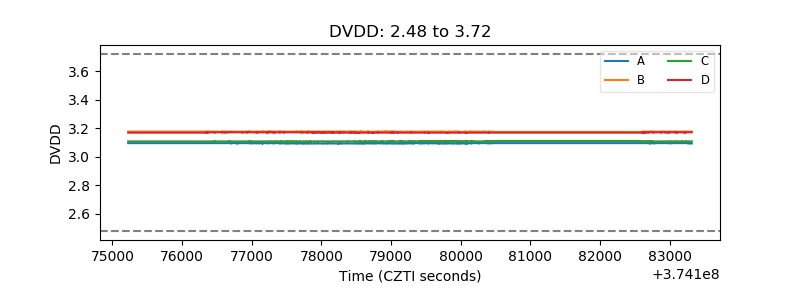 |
| Temperature 1 | 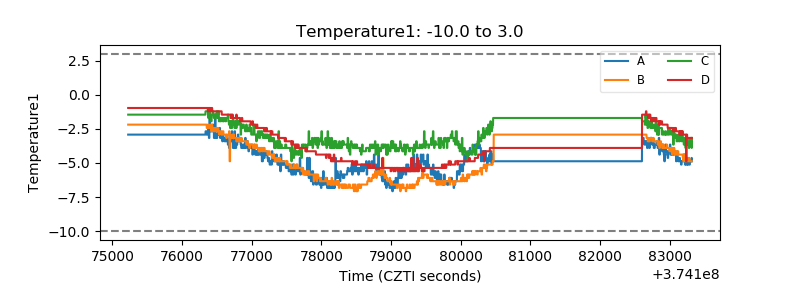 |
| Veto HV Monitor | 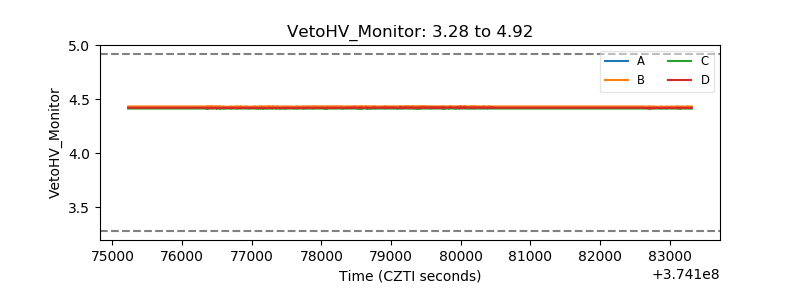 |
| Veto LLD | 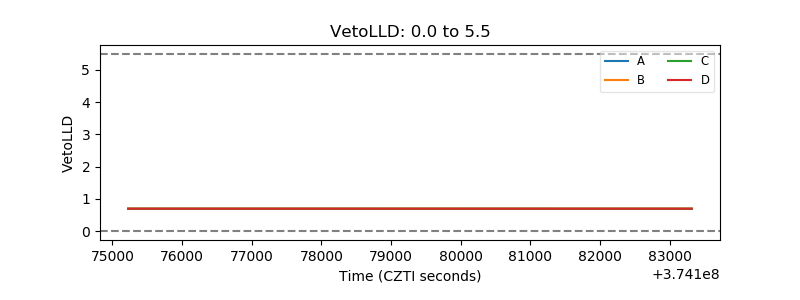 |
| Alpha Counter | 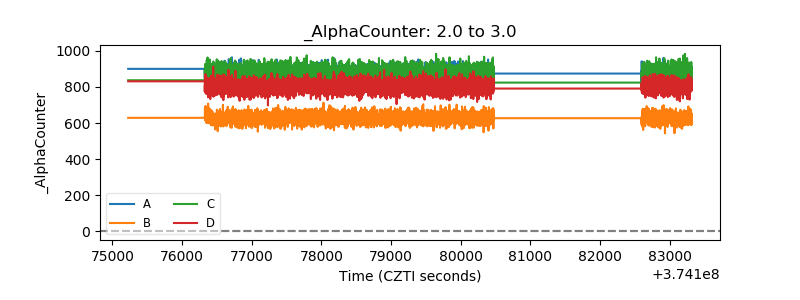 |
| _CPM_Rate | 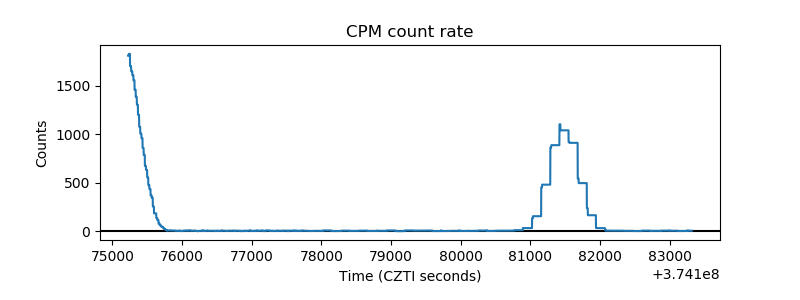 |
| CZT Counter | 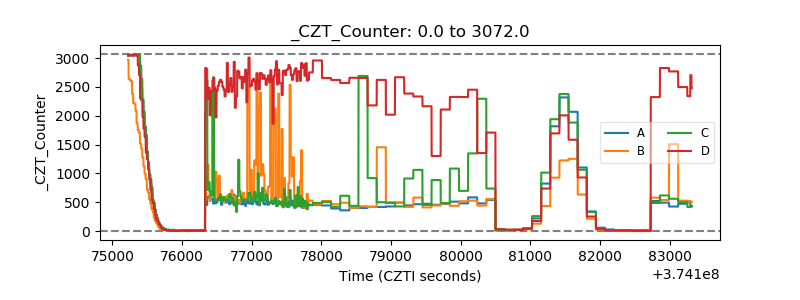 |
| +2.5 Volts monitor | 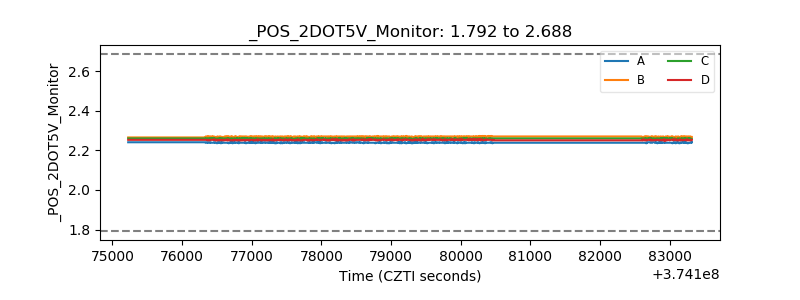 |
| +5 Volts monitor | 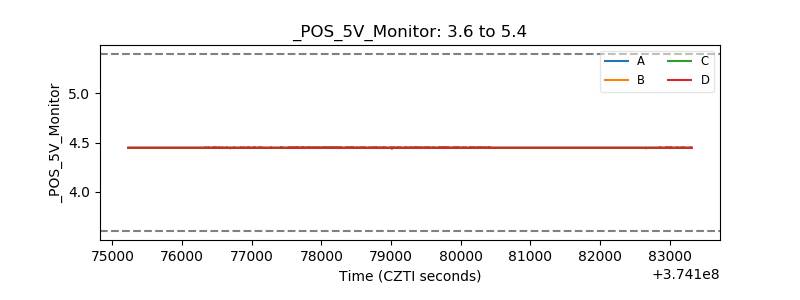 |
| _ROLL_ROT | 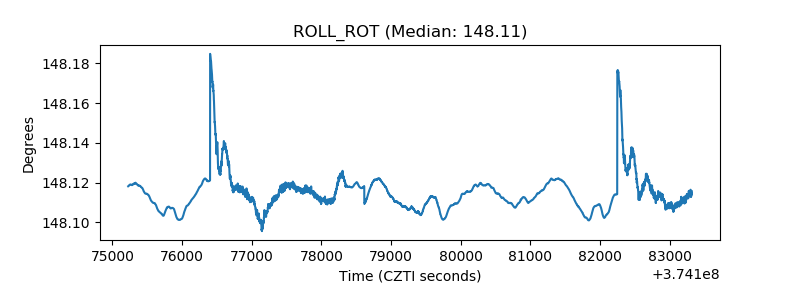 |
| _Roll_DEC | 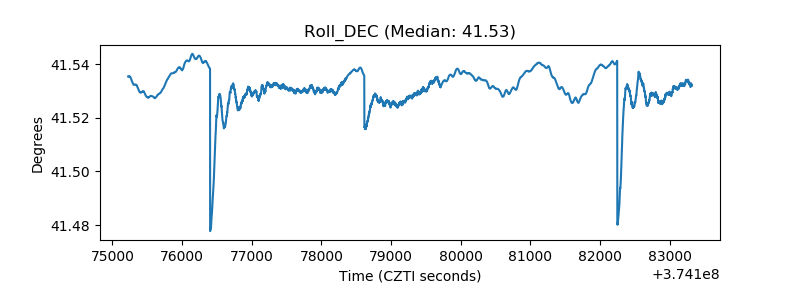 |
| _Roll_RA | 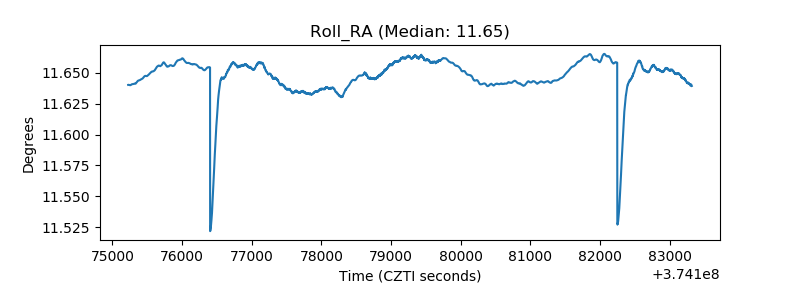 |
| Veto Counter | 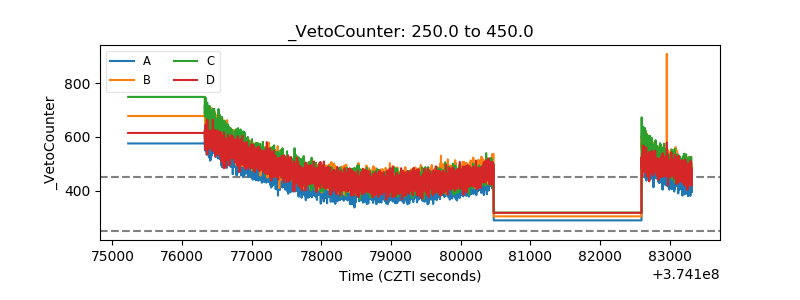 |