| Param | Original file | Final file |
|---|---|---|
| Filename | modeM0/AS1T04_072T01_9000004780_33311cztM0_level2.evt | modeM0/AS1T04_072T01_9000004780_33311cztM0_level2_quad_clean.evt |
| Size (bytes) | 544,060,800 | 82,814,400 |
| Size | 518.9 MB | 79.0 MB |
| Events in quadrant A | 2,649,449 | 558,033 |
| Events in quadrant B | 4,167,487 | 530,125 |
| Events in quadrant C | 5,225,924 | 508,209 |
| Events in quadrant D | 4,057,090 | 521,319 |
| Mode SS | |||
|---|---|---|---|
| Quadrant | BADHDUFLAG | Total packets | Discarded packets |
| A | 0 | 112 | 0 |
| B | 0 | 112 | 0 |
| C | 0 | 112 | 0 |
| D | 0 | 112 | 0 |
| Mode M0 | |||
|---|---|---|---|
| Quadrant | BADHDUFLAG | Total packets | Discarded packets |
| A | 0 | 11378 | 3 |
| B | 0 | 15905 | 2 |
| C | 0 | 19170 | 2 |
| D | 0 | 15927 | 2 |
| Mode M9 | |||
|---|---|---|---|
| Quadrant | BADHDUFLAG | Total packets | Discarded packets |
| A | 0 | 19 | 0 |
| B | 0 | 19 | 0 |
| C | 0 | 19 | 0 |
| D | 0 | 20 | 0 |
| Quadrant | Total seconds | Saturated seconds | Saturation percentage |
|---|---|---|---|
| A | 5576 | 11 | 0.197274% |
| B | 5576 | 372 | 6.671449% |
| C | 5576 | 409 | 7.335007% |
| D | 5576 | 120 | 2.152080% |
Noise dominated data is calculated using 1-second bins in cleaned event files. If a bin has >2000 counts, and if more than 50% of those come from <1% of pixels, then it is considered to be noise-dominated and hence unusable.
| Quadrant | # 1 sec bins | Bins with >0 counts | Bins with >2000 counts | High rate bins dominated by noise | Noise dominated (total time) | Noise dominated (detector-on time) | Marked lightcurve |
|---|---|---|---|---|---|---|---|
| A | 7189 | 5577 | 1 | 1 | 0.01% | 0.02% | 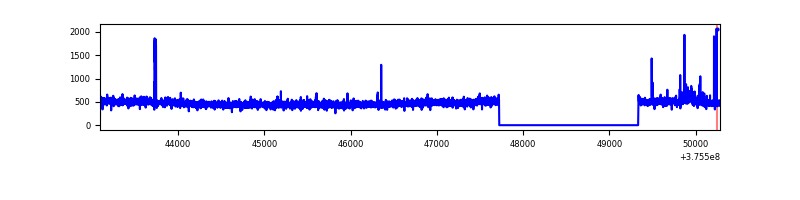 |
| B | 7189 | 5577 | 275 | 275 | 3.83% | 4.93% | 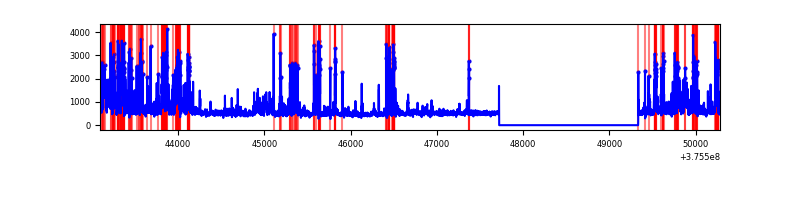 |
| C | 7189 | 5577 | 376 | 376 | 5.23% | 6.74% | 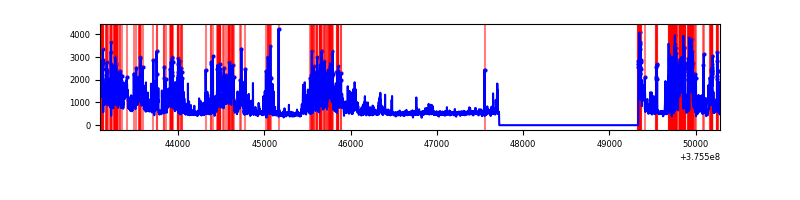 |
| D | 7189 | 5577 | 92 | 92 | 1.28% | 1.65% |  |
Top three noisy pixels from each quadrant. If the there are fewer than three noisy pixels in the level2.evt file, extra rows are filled as -1
| Pixel properties | Quadrant properties | ||||||
|---|---|---|---|---|---|---|---|
| Quadrant | DetID | PixID | Counts | Sigma | Mean | Median | Sigma |
| A | 15 | 47 | 41649 | 309.62 | 663 | 651 | 132.4 |
| A | 15 | 169 | 35910 | 266.28 | 663 | 651 | 132.4 |
| A | 13 | 254 | 9941 | 70.16 | 663 | 651 | 132.4 |
| B | 5 | 172 | 1209489 | 10044.43 | 639 | 622 | 120.4 |
| B | 0 | 219 | 229317 | 1900.22 | 639 | 622 | 120.4 |
| B | 4 | 170 | 33916 | 276.64 | 639 | 622 | 120.4 |
| C | 1 | 23 | 1066341 | 7401.73 | 622 | 626 | 144.0 |
| C | 10 | 49 | 909951 | 6315.55 | 622 | 626 | 144.0 |
| C | 0 | 207 | 294954 | 2044.2 | 622 | 626 | 144.0 |
| D | 8 | 195 | 837671 | 5098.42 | 637 | 624 | 164.2 |
| D | 2 | 250 | 194419 | 1180.4 | 637 | 624 | 164.2 |
| D | 12 | 233 | 149781 | 908.51 | 637 | 624 | 164.2 |
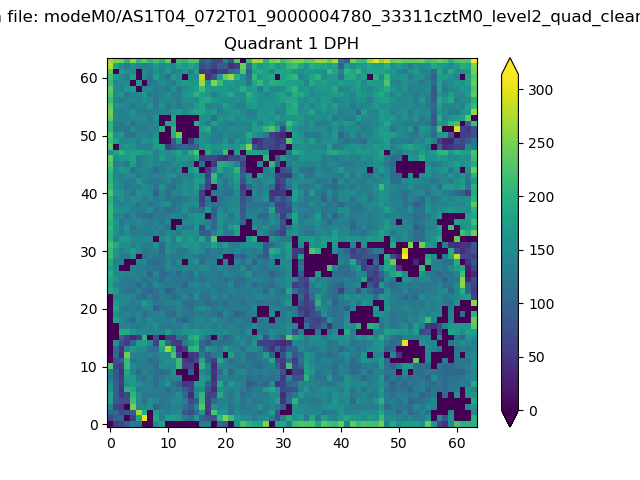
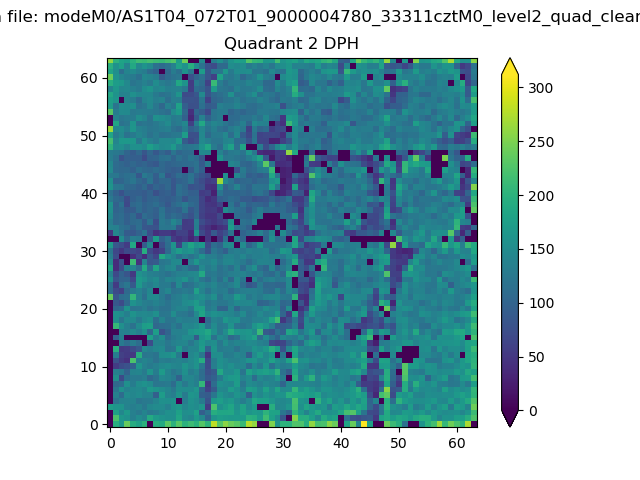
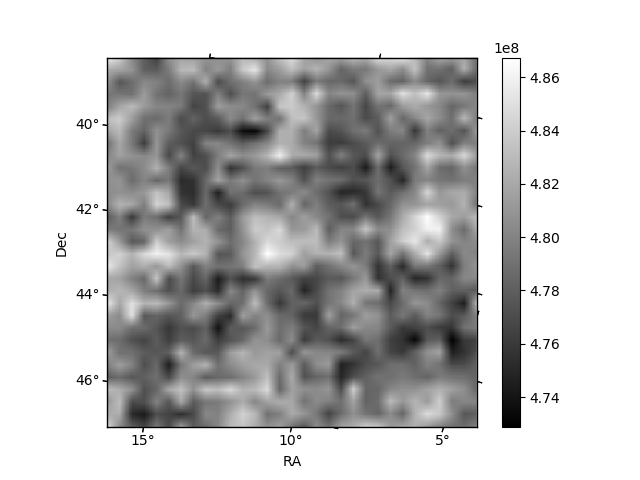
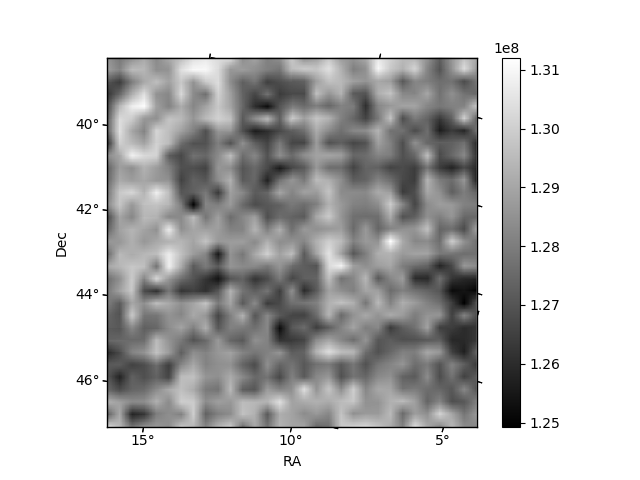
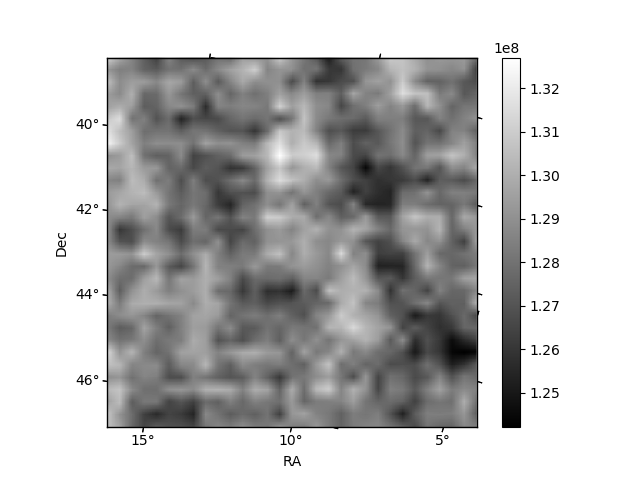
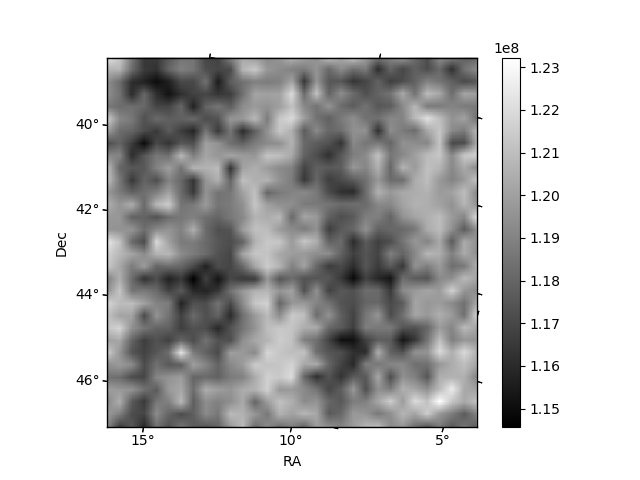
Histogram calculated using DETX and DETY for each event in the final _common_clean file
| Quadrant A | 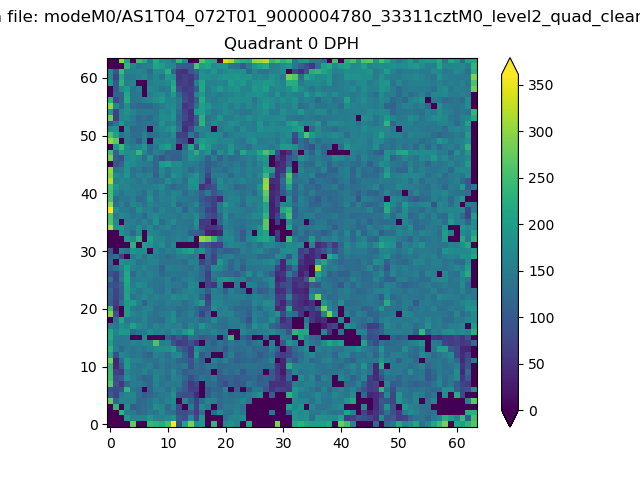 |
 |
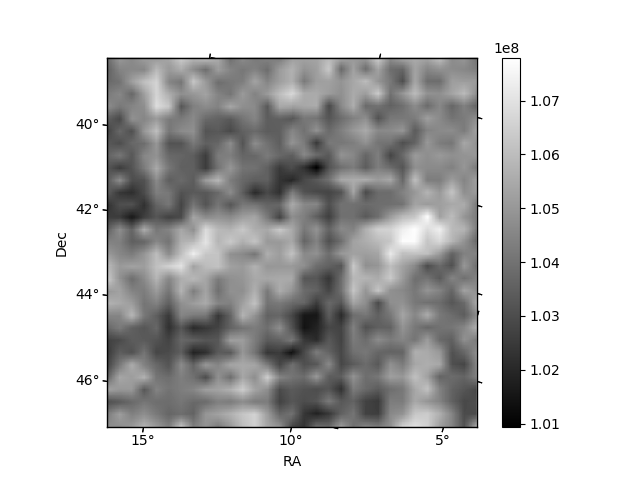
Quadrant B |
|---|---|---|---|
| Quadrant D | 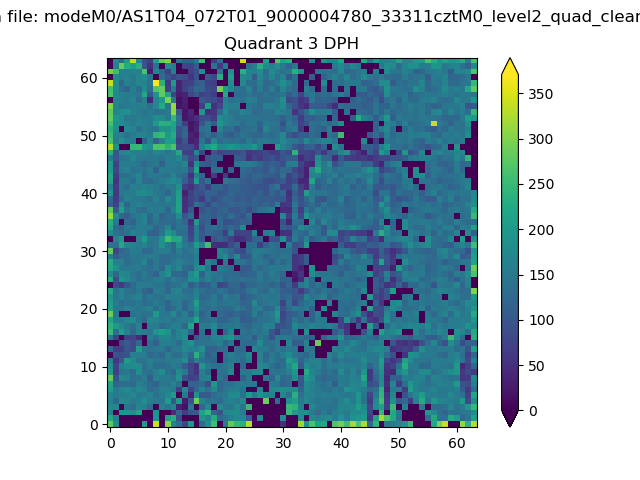 |
 |
Quadrant C |
| Plot type | Count rate plots | Images |
|---|---|---|
| Comparison with Poisson distribution Blue bars denote a histogram of data divided into 1 sec bins. Red curve is a Poisson curve with rate = median count rate of data. |
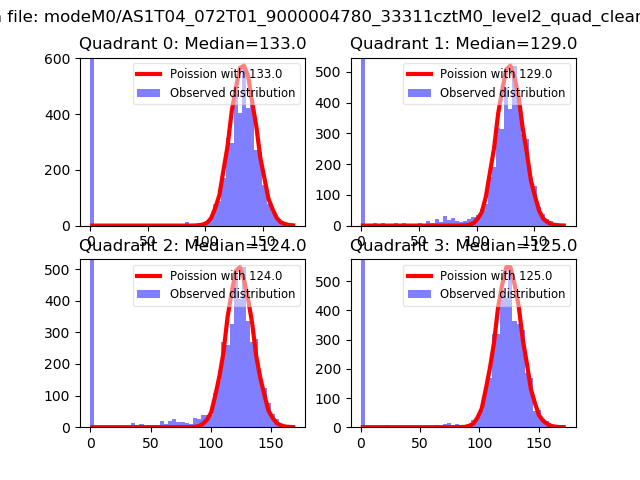 |
 |
| Quadrant-wise count rates Data is divided into 100 sec bins |
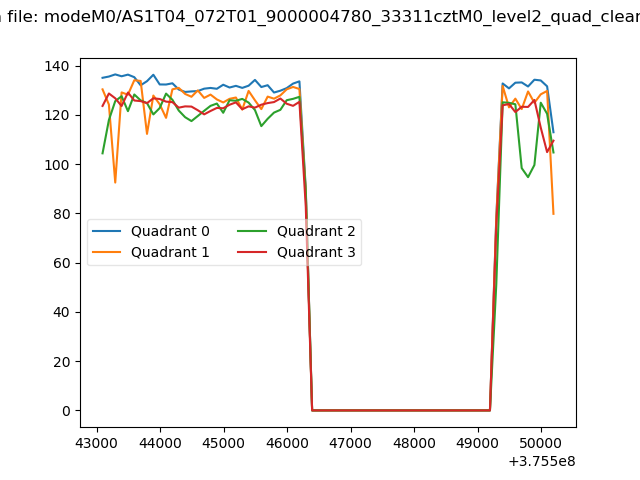 |
|
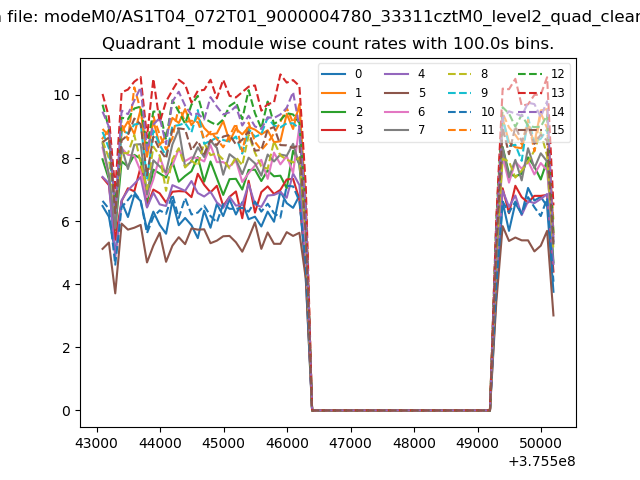
| Module-wise count rates for Quadrant A Data is divided into 100 sec bins |
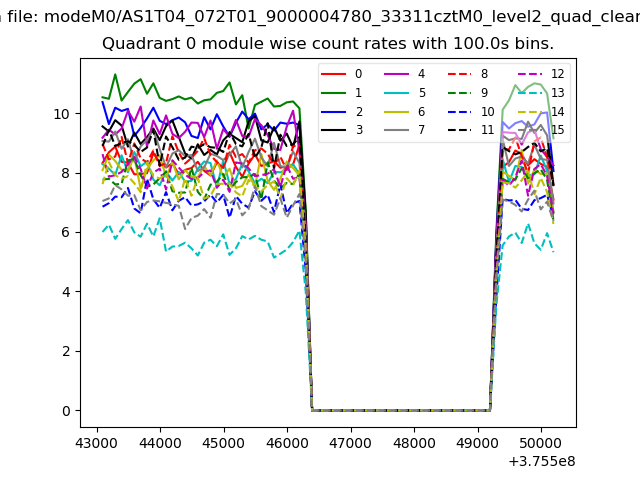 |
 |
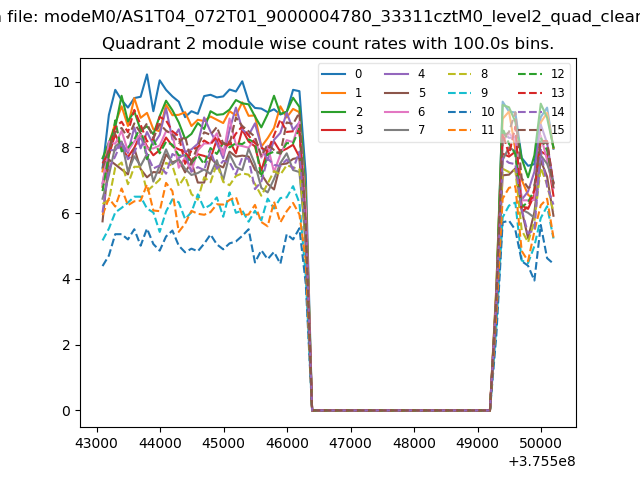
| Module-wise count rates for Quadrant B Data is divided into 100 sec bins |
 |
 |
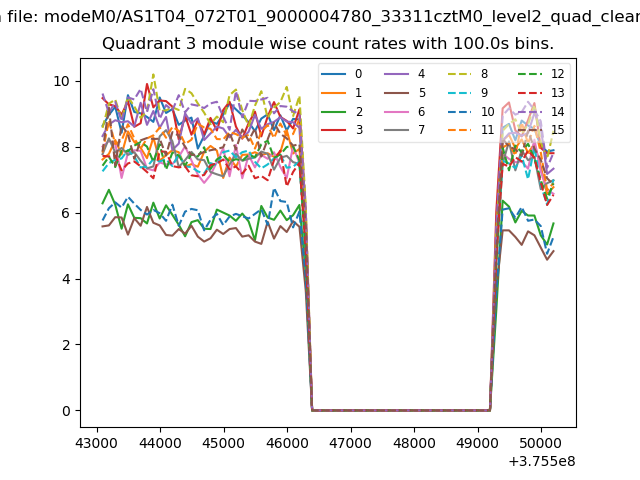
| Module-wise count rates for Quadrant C Data is divided into 100 sec bins |
 |
 |
| Module-wise count rates for Quadrant D Data is divided into 100 sec bins |
 |
 |
| Parameter | Plot |
|---|---|
| CZT HV Monitor |  |
| D_VDD | 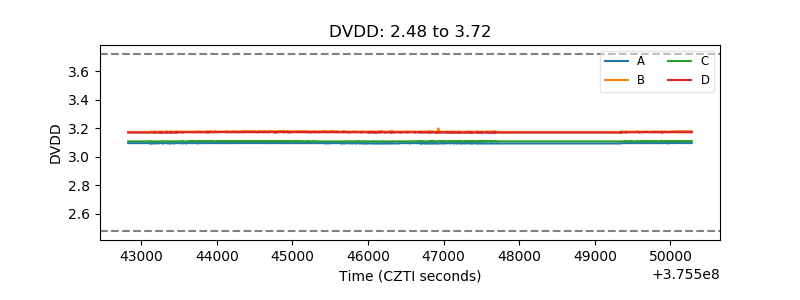 |
| Temperature 1 | 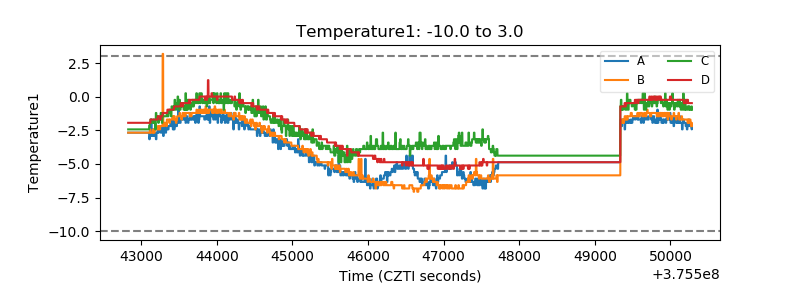 |
| Veto HV Monitor | 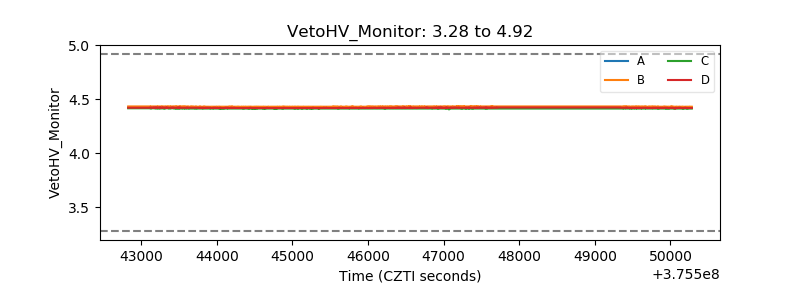 |
| Veto LLD | 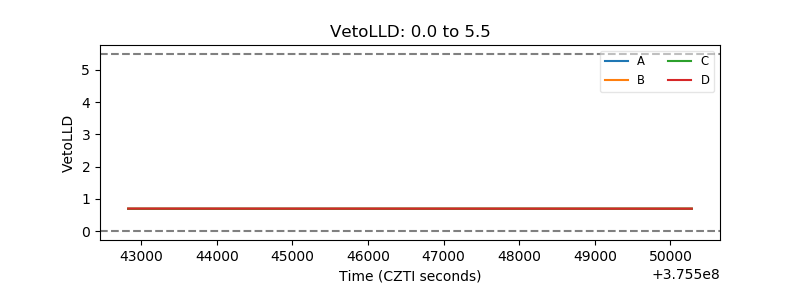 |
| Alpha Counter | 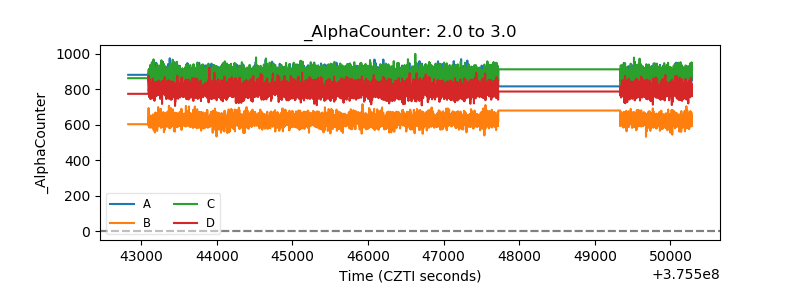 |
| _CPM_Rate | 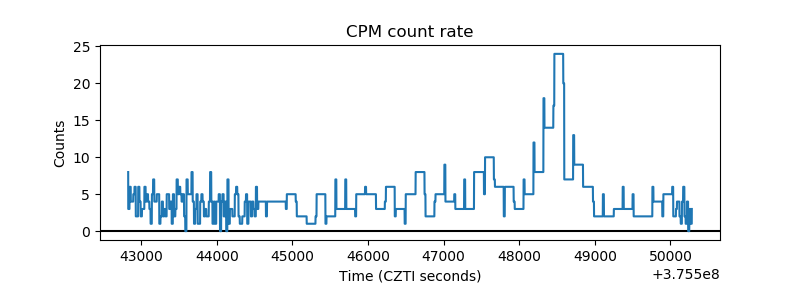 |
| CZT Counter | 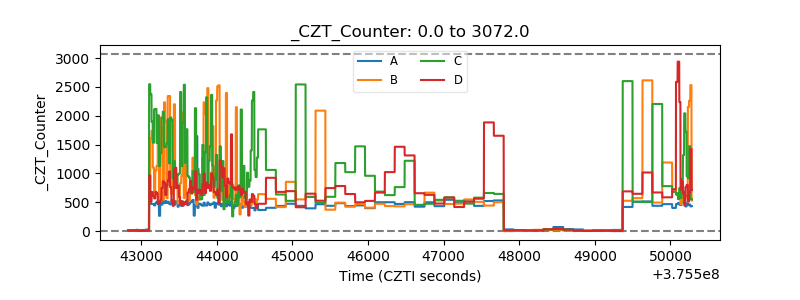 |
| +2.5 Volts monitor | 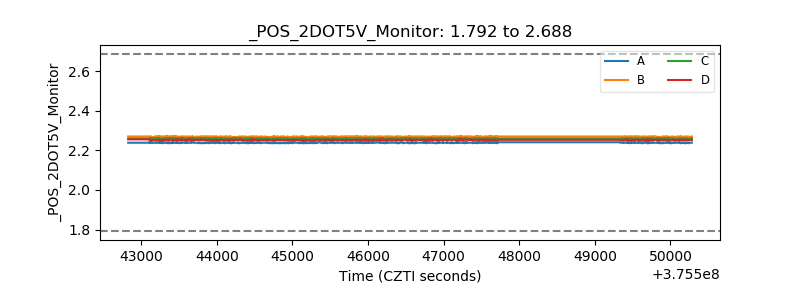 |
| +5 Volts monitor | 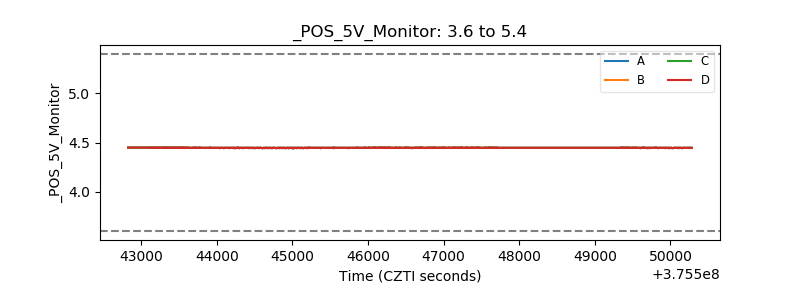 |
| _ROLL_ROT | 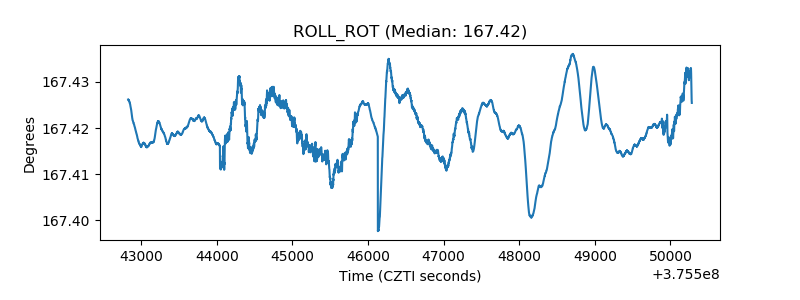 |
| _Roll_DEC | 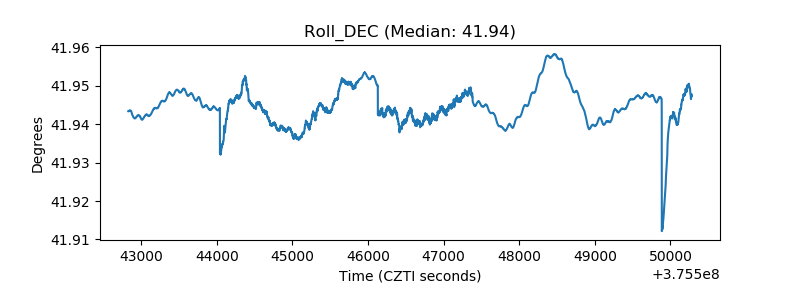 |
| _Roll_RA | 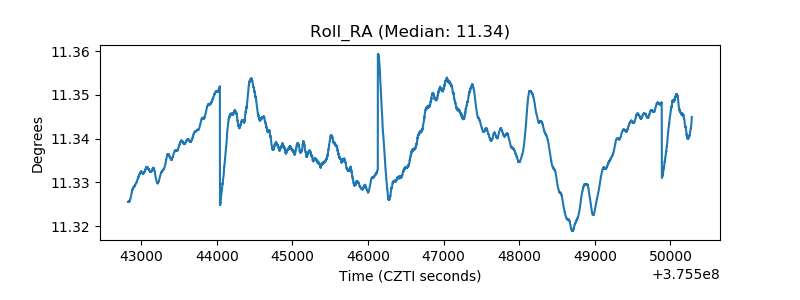 |
| Veto Counter | 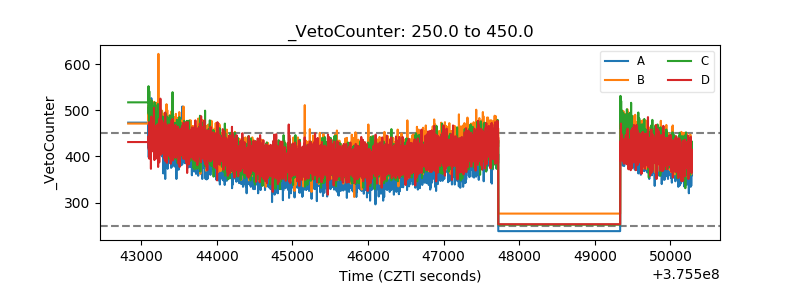 |