| Param | Original file | Final file |
|---|---|---|
| Filename | modeM0/AS1A10_058T15_9000004786_33354cztM0_level2.evt | modeM0/AS1A10_058T15_9000004786_33354cztM0_level2_quad_clean.evt |
| Size (bytes) | 411,192,000 | 64,768,320 |
| Size | 392.1 MB | 61.8 MB |
| Events in quadrant A | 2,139,227 | 437,271 |
| Events in quadrant B | 2,997,669 | 427,168 |
| Events in quadrant C | 3,191,156 | 407,942 |
| Events in quadrant D | 3,826,930 | 380,012 |
| Mode M0 | |||
|---|---|---|---|
| Quadrant | BADHDUFLAG | Total packets | Discarded packets |
| A | 0 | 10795 | 1659 |
| B | 0 | 14742 | 2957 |
| C | 0 | 14918 | 2795 |
| D | 0 | 18699 | 4439 |
| Mode M9 | |||
|---|---|---|---|
| Quadrant | BADHDUFLAG | Total packets | Discarded packets |
| A | 0 | 18 | 0 |
| B | 0 | 18 | 0 |
| C | 0 | 18 | 0 |
| D | 0 | 18 | 0 |
| Mode SS | |||
|---|---|---|---|
| Quadrant | BADHDUFLAG | Total packets | Discarded packets |
| A | 0 | 108 | 12 |
| B | 0 | 108 | 14 |
| C | 0 | 108 | 14 |
| D | 0 | 108 | 12 |
| Quadrant | Total seconds | Saturated seconds | Saturation percentage |
|---|---|---|---|
| A | 4446 | 6 | 0.134953% |
| B | 4397 | 166 | 3.775301% |
| C | 4353 | 320 | 7.351252% |
| D | 4257 | 231 | 5.426357% |
Noise dominated data is calculated using 1-second bins in cleaned event files. If a bin has >2000 counts, and if more than 50% of those come from <1% of pixels, then it is considered to be noise-dominated and hence unusable.
| Quadrant | # 1 sec bins | Bins with >0 counts | Bins with >2000 counts | High rate bins dominated by noise | Noise dominated (total time) | Noise dominated (detector-on time) | Marked lightcurve |
|---|---|---|---|---|---|---|---|
| A | 7047 | 4637 | 0 | 0 | 0.00% | 0.00% | 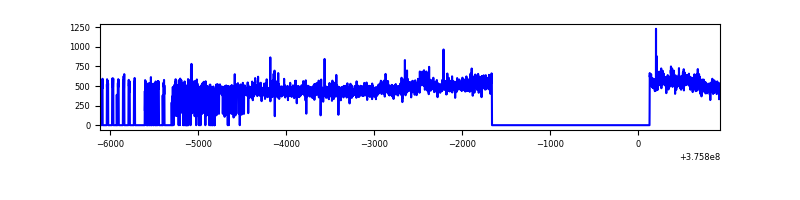 |
| B | 7043 | 4575 | 120 | 120 | 1.70% | 2.62% | 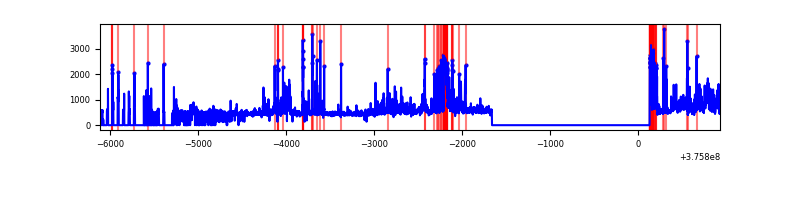 |
| C | 7029 | 4541 | 288 | 288 | 4.10% | 6.34% | 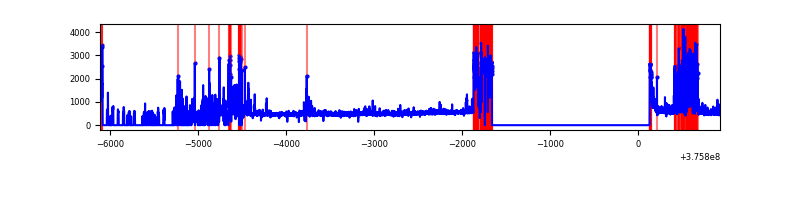 |
| D | 7029 | 4450 | 214 | 214 | 3.04% | 4.81% | 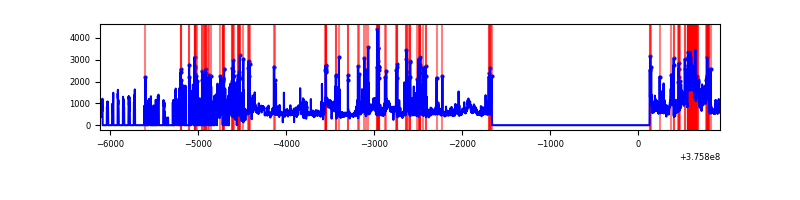 |
Top three noisy pixels from each quadrant. If the there are fewer than three noisy pixels in the level2.evt file, extra rows are filled as -1
| Pixel properties | Quadrant properties | ||||||
|---|---|---|---|---|---|---|---|
| Quadrant | DetID | PixID | Counts | Sigma | Mean | Median | Sigma |
| A | 15 | 169 | 80229 | 753.1 | 527 | 519 | 105.8 |
| A | 15 | 174 | 6572 | 57.19 | 527 | 519 | 105.8 |
| A | 13 | 254 | 6410 | 55.66 | 527 | 519 | 105.8 |
| B | 5 | 172 | 414969 | 4206.93 | 514 | 502 | 98.5 |
| B | 0 | 245 | 264770 | 2682.38 | 514 | 502 | 98.5 |
| B | 0 | 219 | 189457 | 1917.93 | 514 | 502 | 98.5 |
| C | 1 | 23 | 912494 | 8254.9 | 478 | 482 | 110.5 |
| C | 15 | 214 | 183925 | 1660.4 | 478 | 482 | 110.5 |
| C | 0 | 10 | 120675 | 1087.9 | 478 | 482 | 110.5 |
| D | 8 | 195 | 779875 | 6324.87 | 474 | 465 | 123.2 |
| D | 1 | 52 | 322753 | 2615.35 | 474 | 465 | 123.2 |
| D | 14 | 52 | 220919 | 1788.97 | 474 | 465 | 123.2 |
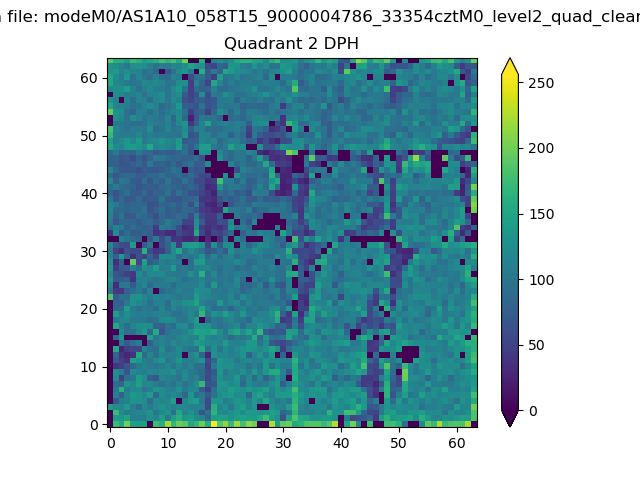
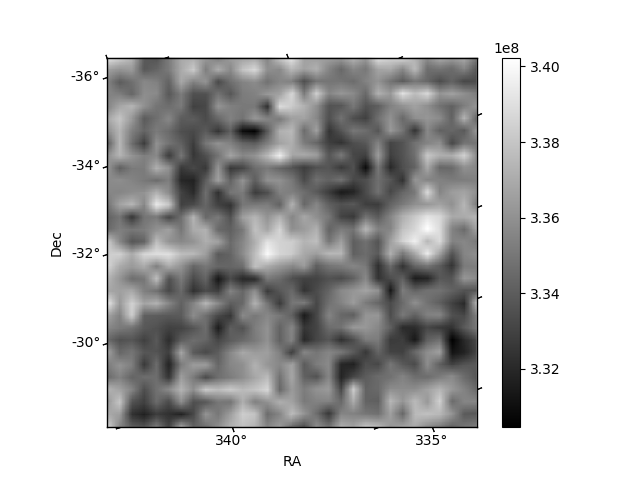
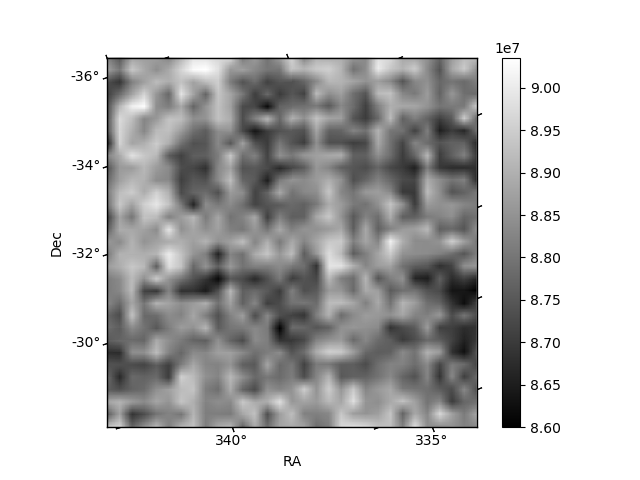
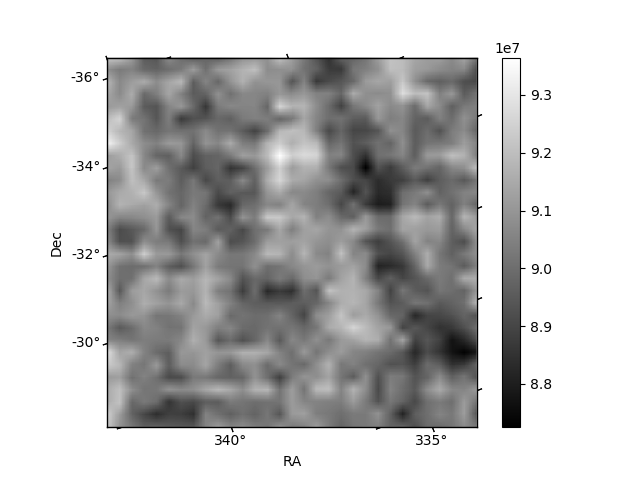
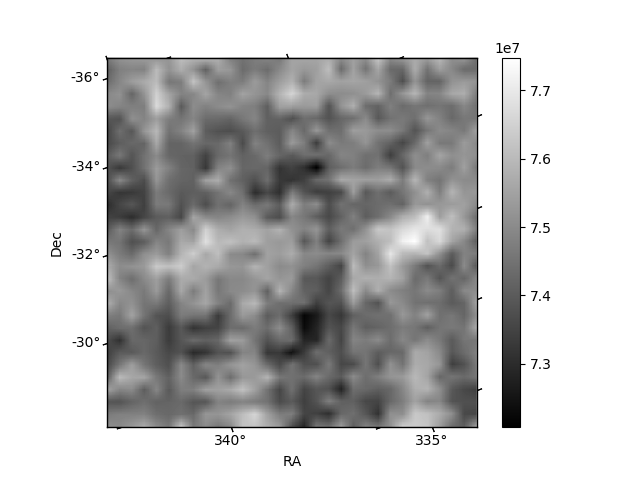
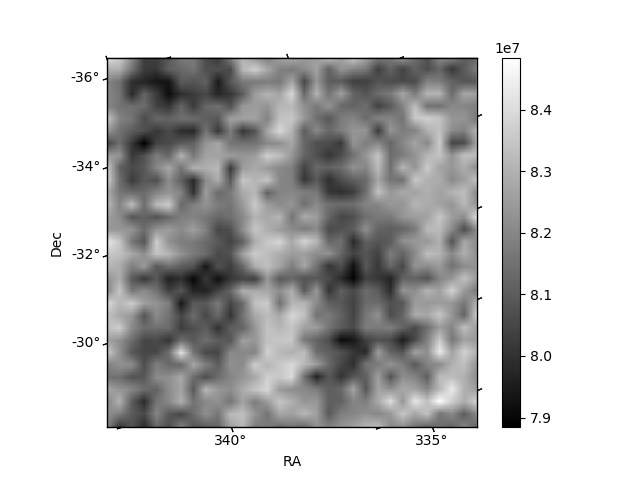
Histogram calculated using DETX and DETY for each event in the final _common_clean file
| Quadrant A | 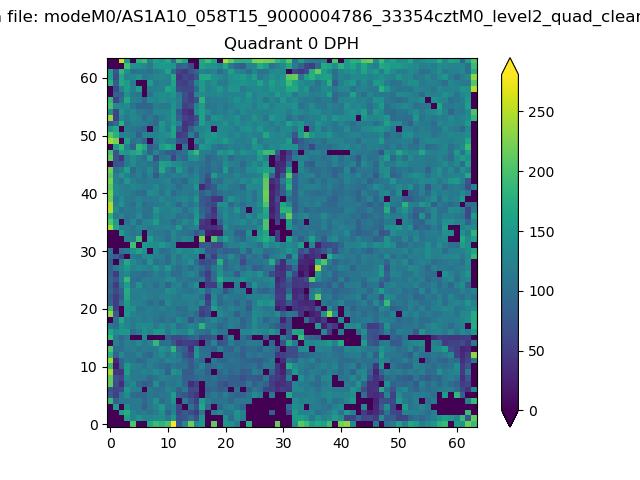 |
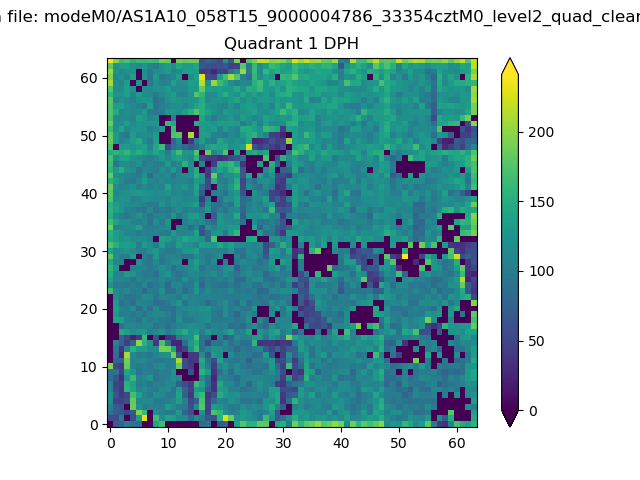 |
Quadrant B |
|---|---|---|---|
| Quadrant D | 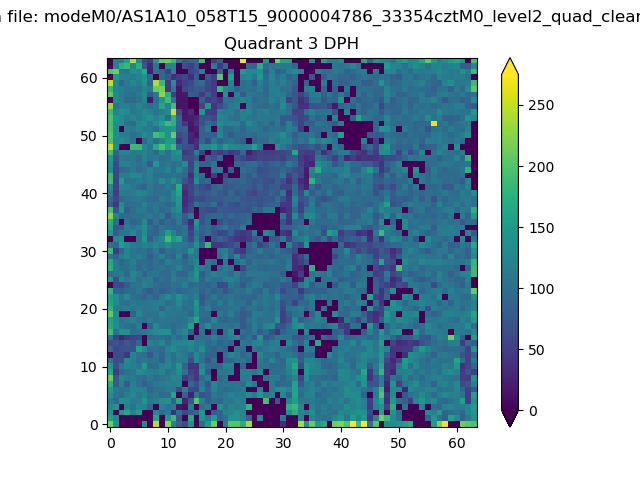 |
 |
Quadrant C |
| Plot type | Count rate plots | Images |
|---|---|---|
| Comparison with Poisson distribution Blue bars denote a histogram of data divided into 1 sec bins. Red curve is a Poisson curve with rate = median count rate of data. |
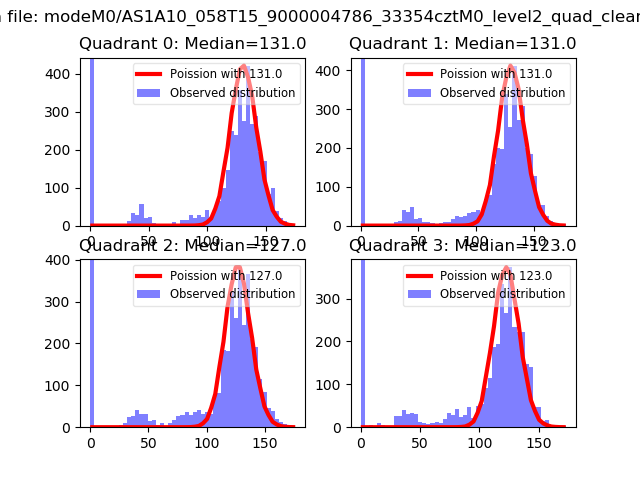 |
 |
| Quadrant-wise count rates Data is divided into 100 sec bins |
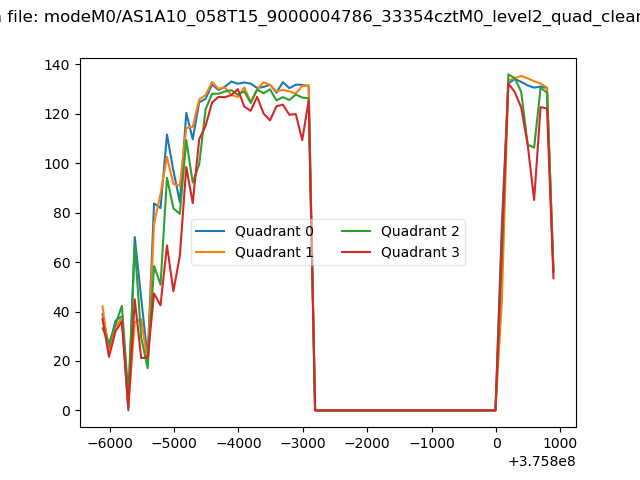 |
|
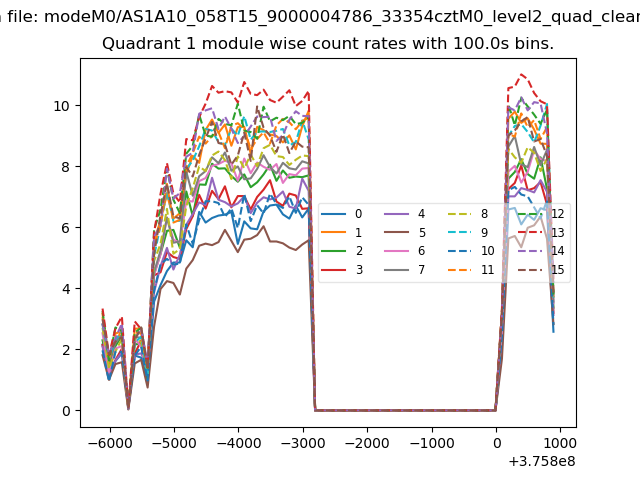
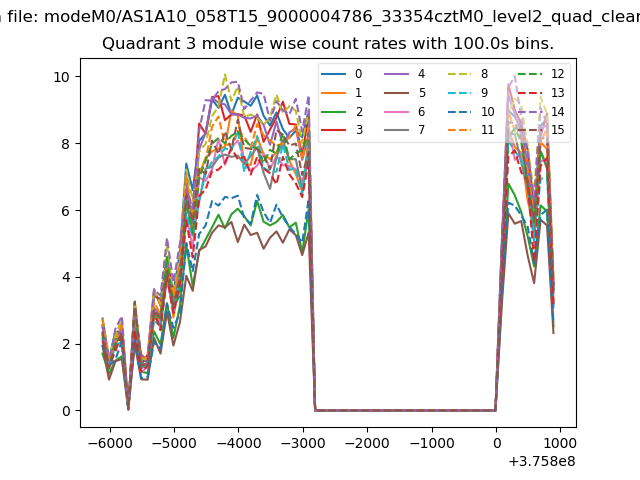
| Module-wise count rates for Quadrant A Data is divided into 100 sec bins |
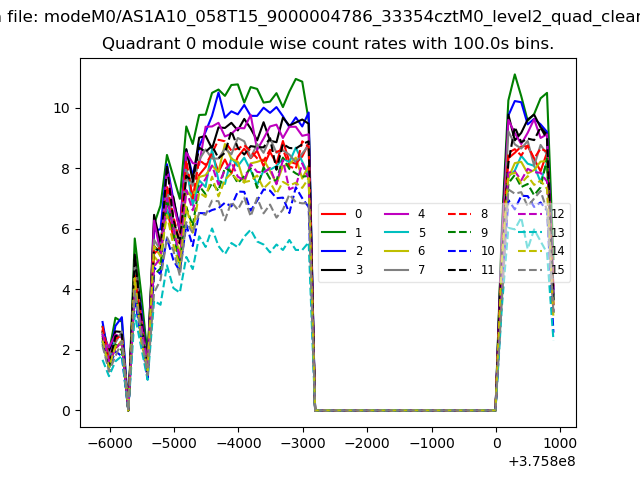 |
 |
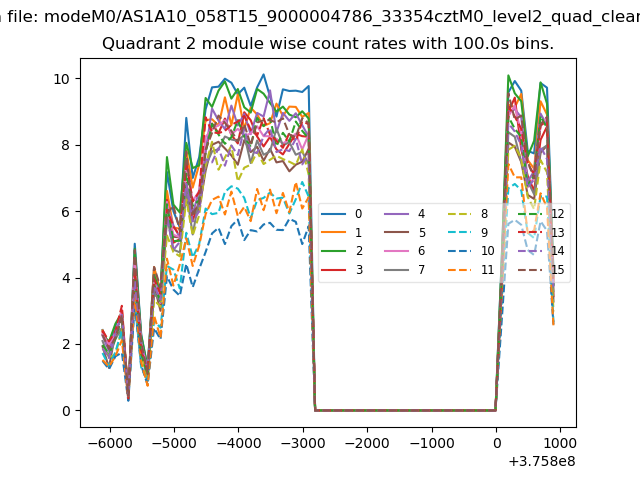
| Module-wise count rates for Quadrant B Data is divided into 100 sec bins |
 |
 |
| Module-wise count rates for Quadrant C Data is divided into 100 sec bins |
 |
 |
| Module-wise count rates for Quadrant D Data is divided into 100 sec bins |
 |
 |
| Parameter | Plot |
|---|---|
| CZT HV Monitor | 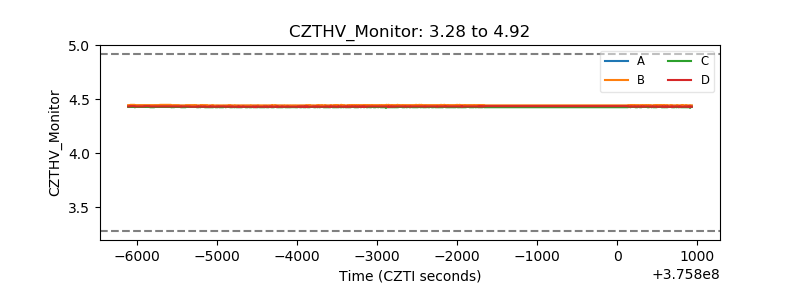 |
| D_VDD | 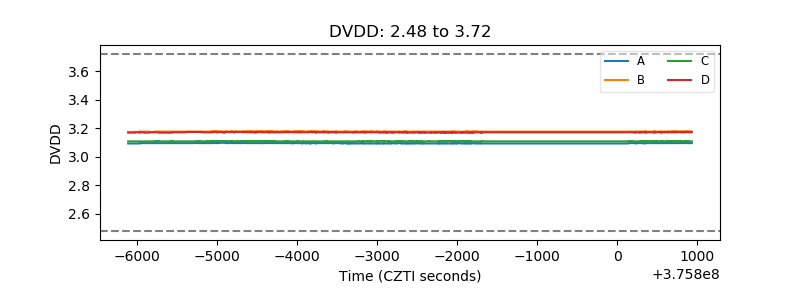 |
| Temperature 1 | 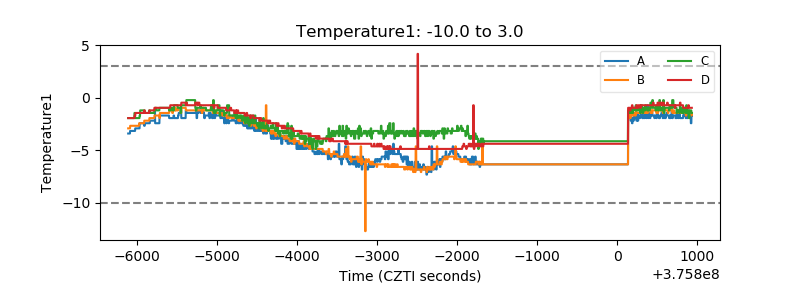 |
| Veto HV Monitor | 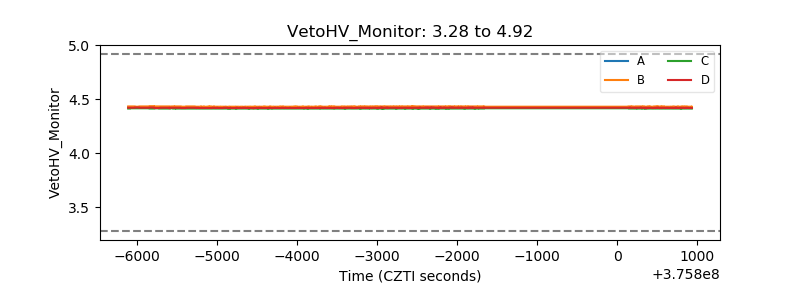 |
| Veto LLD | 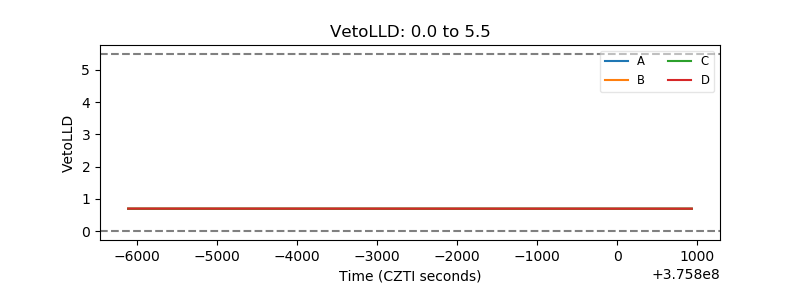 |
| Alpha Counter | 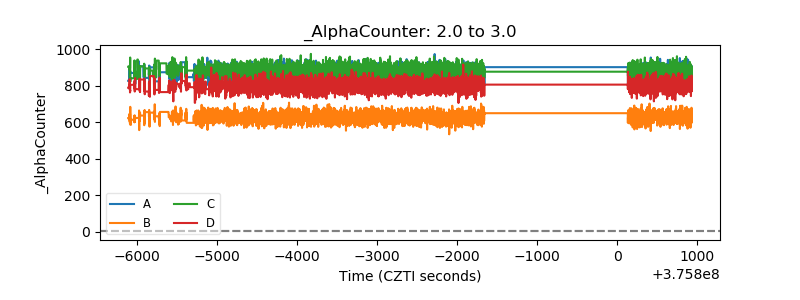 |
| _CPM_Rate | 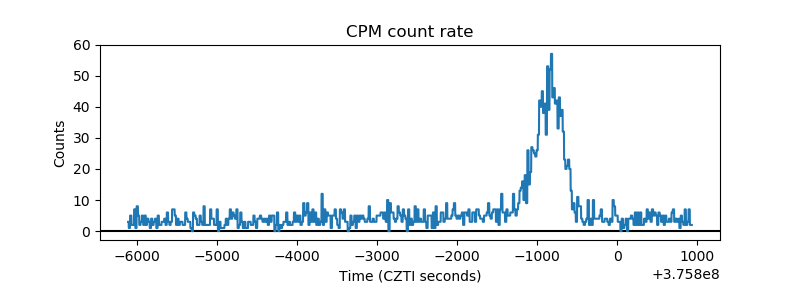 |
| CZT Counter | 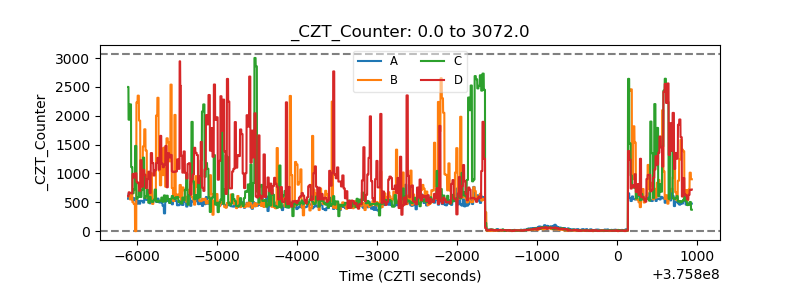 |
| +2.5 Volts monitor | 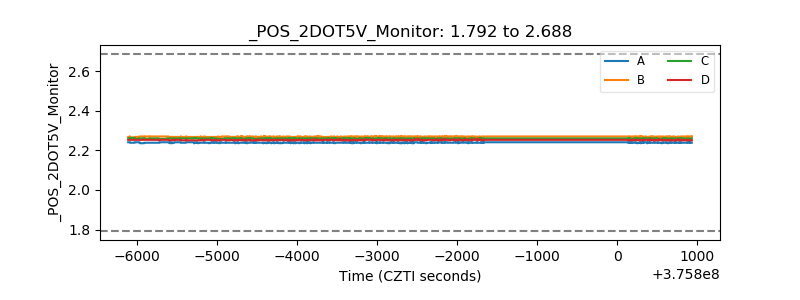 |
| +5 Volts monitor | 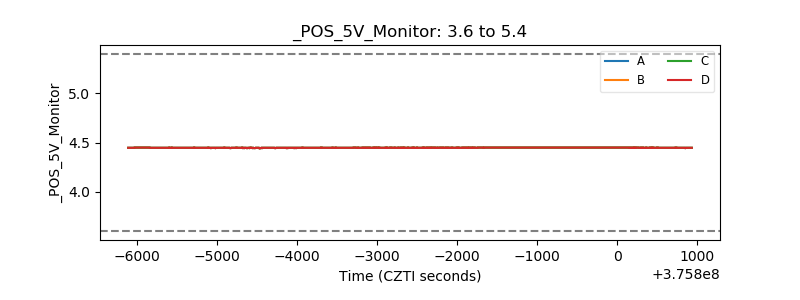 |
| _ROLL_ROT | 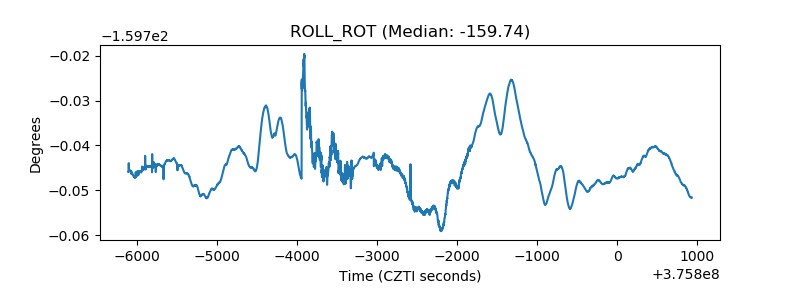 |
| _Roll_DEC | 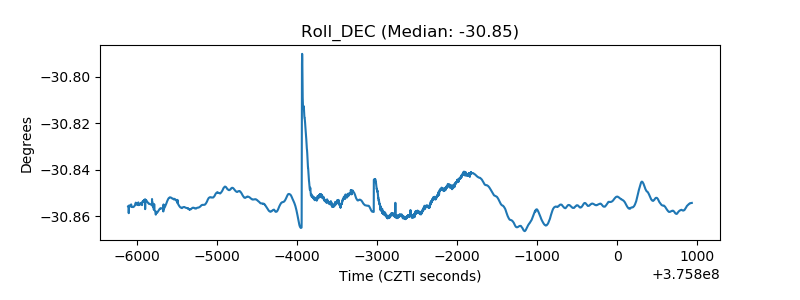 |
| _Roll_RA | 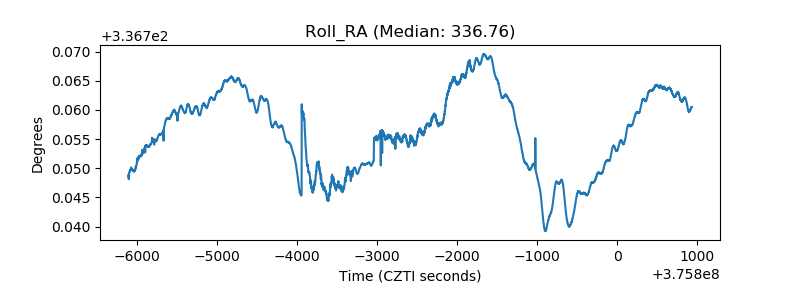 |
| Veto Counter | 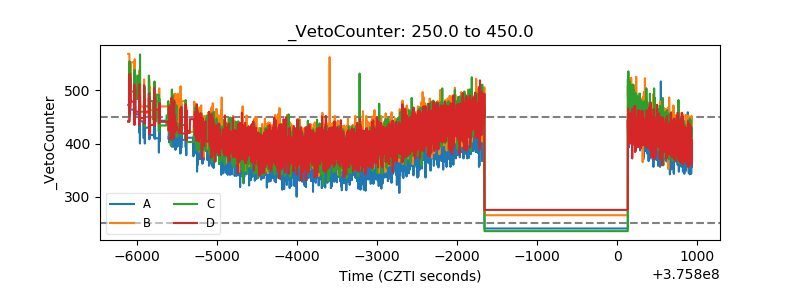 |