| Param | Original file | Final file |
|---|---|---|
| Filename | modeM0/AS1A10_064T02_9000004788_33377cztM0_level2.evt | modeM0/AS1A10_064T02_9000004788_33377cztM0_level2_quad_clean.evt |
| Size (bytes) | 677,419,200 | 121,357,440 |
| Size | 646.0 MB | 115.7 MB |
| Events in quadrant A | 3,686,607 | 794,758 |
| Events in quadrant B | 4,902,618 | 799,272 |
| Events in quadrant C | 4,290,475 | 791,098 |
| Events in quadrant D | 7,095,581 | 734,805 |
| Mode M9 | |||
|---|---|---|---|
| Quadrant | BADHDUFLAG | Total packets | Discarded packets |
| A | 0 | 25 | 0 |
| B | 0 | 25 | 0 |
| C | 0 | 25 | 0 |
| D | 0 | 25 | 0 |
| Mode M0 | |||
|---|---|---|---|
| Quadrant | BADHDUFLAG | Total packets | Discarded packets |
| A | 0 | 16291 | 4 |
| B | 0 | 19797 | 2 |
| C | 0 | 17488 | 2 |
| D | 0 | 26694 | 2 |
| Mode SS | |||
|---|---|---|---|
| Quadrant | BADHDUFLAG | Total packets | Discarded packets |
| A | 0 | 162 | 0 |
| B | 0 | 162 | 0 |
| C | 0 | 162 | 0 |
| D | 0 | 162 | 0 |
| Quadrant | Total seconds | Saturated seconds | Saturation percentage |
|---|---|---|---|
| A | 7990 | 6 | 0.075094% |
| B | 7990 | 292 | 3.654568% |
| C | 7990 | 51 | 0.638298% |
| D | 7990 | 443 | 5.544431% |
Noise dominated data is calculated using 1-second bins in cleaned event files. If a bin has >2000 counts, and if more than 50% of those come from <1% of pixels, then it is considered to be noise-dominated and hence unusable.
| Quadrant | # 1 sec bins | Bins with >0 counts | Bins with >2000 counts | High rate bins dominated by noise | Noise dominated (total time) | Noise dominated (detector-on time) | Marked lightcurve |
|---|---|---|---|---|---|---|---|
| A | 31543 | 7992 | 0 | 0 | 0.00% | 0.00% | 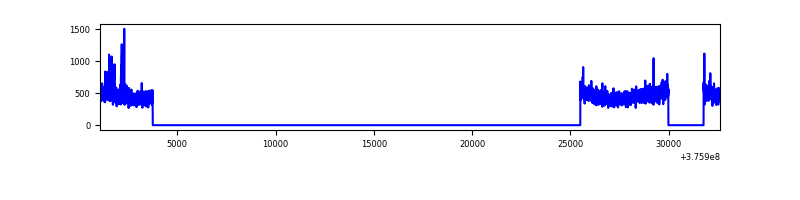 |
| B | 31543 | 7992 | 176 | 176 | 0.56% | 2.20% | 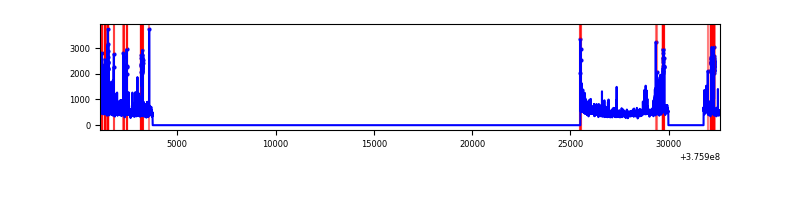 |
| C | 31543 | 7992 | 43 | 43 | 0.14% | 0.54% | 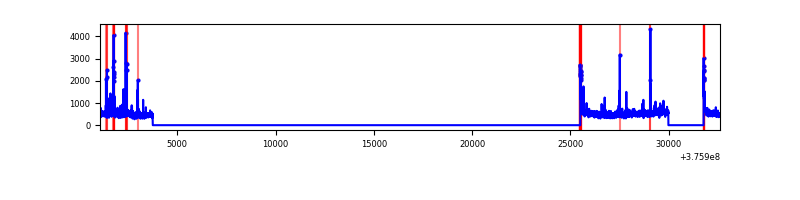 |
| D | 31543 | 7992 | 426 | 426 | 1.35% | 5.33% | 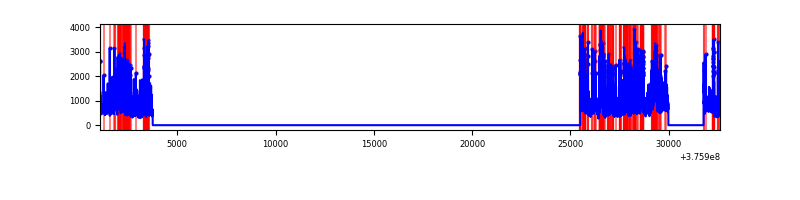 |
Top three noisy pixels from each quadrant. If the there are fewer than three noisy pixels in the level2.evt file, extra rows are filled as -1
| Pixel properties | Quadrant properties | ||||||
|---|---|---|---|---|---|---|---|
| Quadrant | DetID | PixID | Counts | Sigma | Mean | Median | Sigma |
| A | 15 | 174 | 54042 | 281.61 | 933 | 915 | 188.7 |
| A | 7 | 16 | 18652 | 94.02 | 933 | 915 | 188.7 |
| A | 13 | 254 | 12214 | 59.89 | 933 | 915 | 188.7 |
| B | 0 | 219 | 550793 | 3138.2 | 923 | 902 | 175.2 |
| B | 5 | 172 | 491348 | 2798.95 | 923 | 902 | 175.2 |
| B | 15 | 85 | 68368 | 385.03 | 923 | 902 | 175.2 |
| C | 15 | 214 | 342299 | 1639.43 | 906 | 915 | 208.2 |
| C | 0 | 10 | 149753 | 714.76 | 906 | 915 | 208.2 |
| C | 15 | 208 | 80381 | 381.62 | 906 | 915 | 208.2 |
| D | 8 | 195 | 1268678 | 5846.67 | 885 | 861 | 216.8 |
| D | 2 | 250 | 896622 | 4130.89 | 885 | 861 | 216.8 |
| D | 14 | 173 | 500953 | 2306.23 | 885 | 861 | 216.8 |
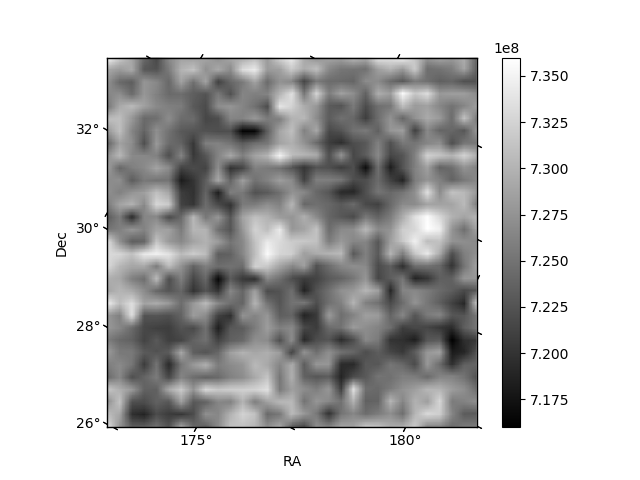
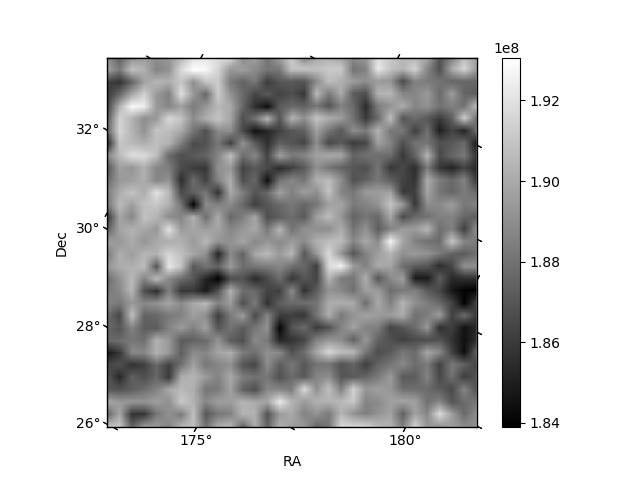
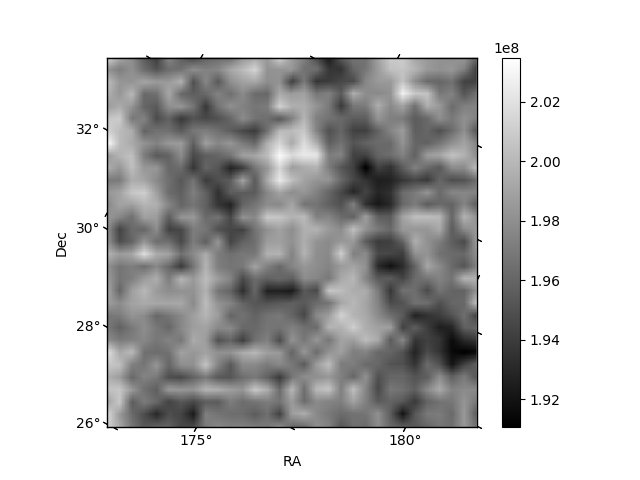
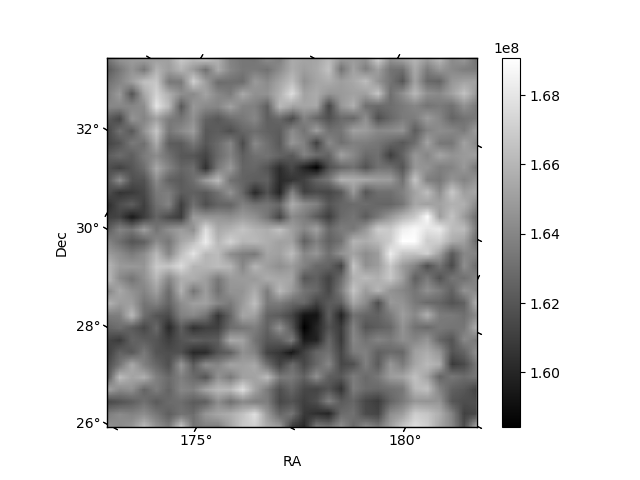
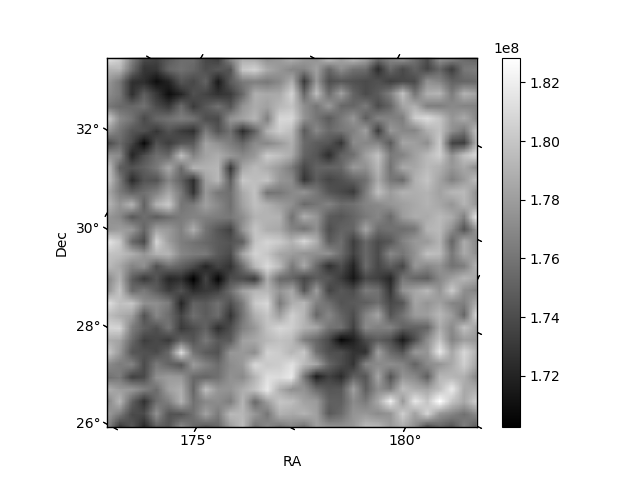
Histogram calculated using DETX and DETY for each event in the final _common_clean file
| Quadrant A | 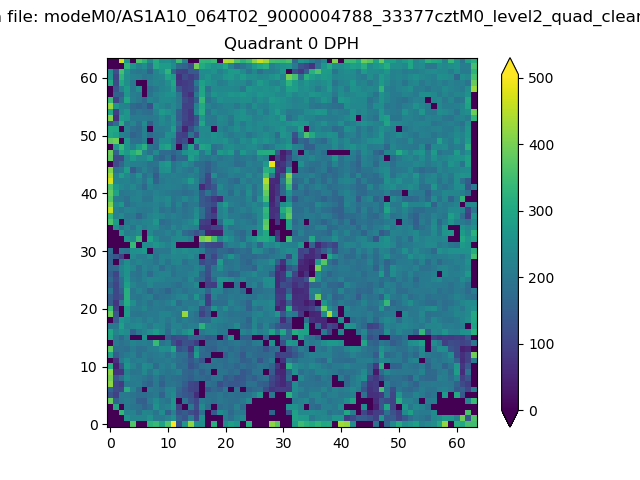 |
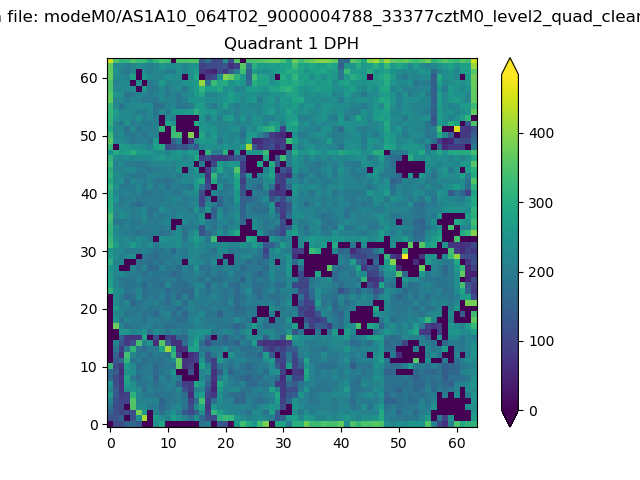 |
Quadrant B |
|---|---|---|---|
| Quadrant D | 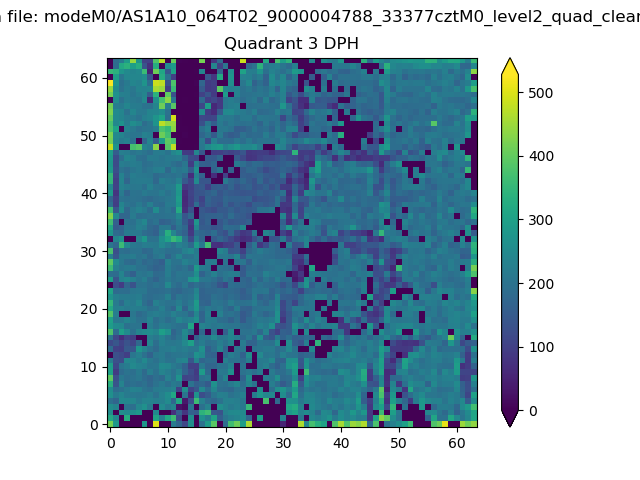 |
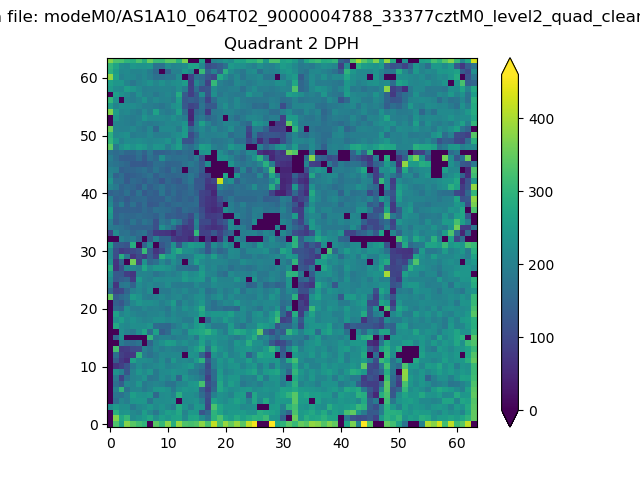 |
Quadrant C |
| Plot type | Count rate plots | Images |
|---|---|---|
| Comparison with Poisson distribution Blue bars denote a histogram of data divided into 1 sec bins. Red curve is a Poisson curve with rate = median count rate of data. |
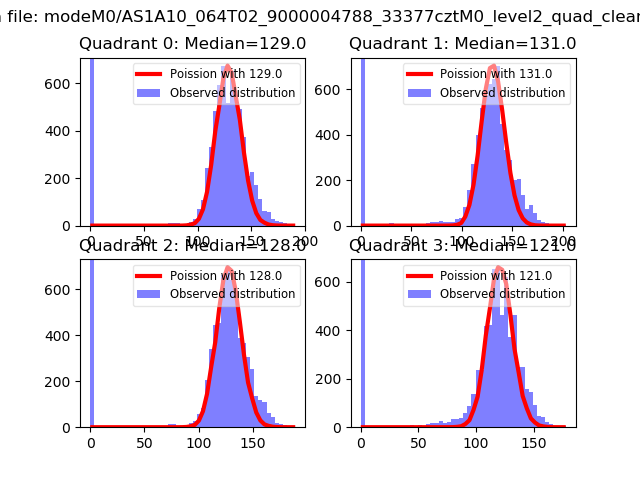 |
 |
| Quadrant-wise count rates Data is divided into 100 sec bins |
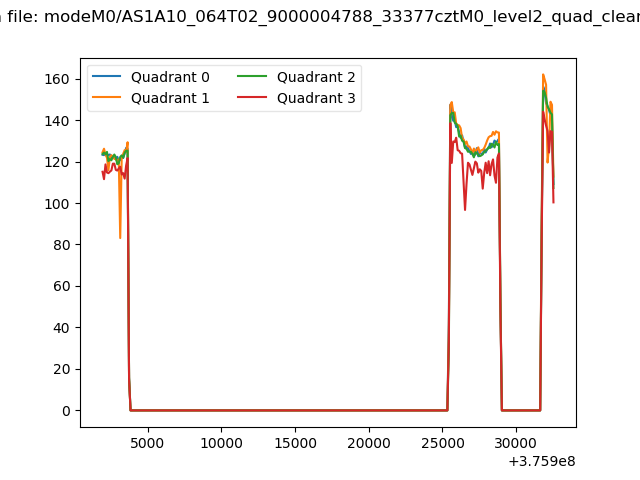 |
|
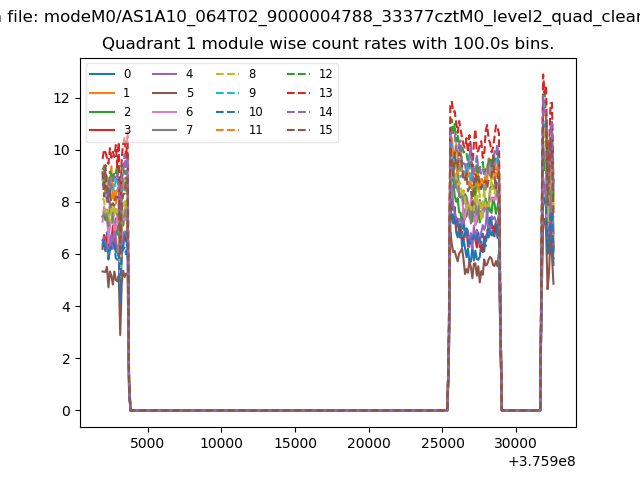
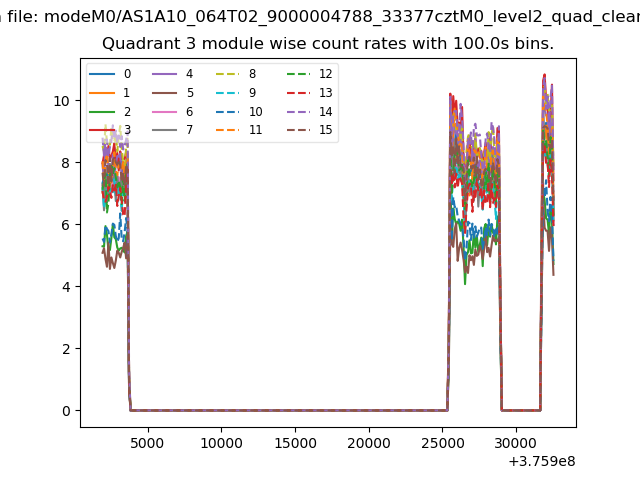
| Module-wise count rates for Quadrant A Data is divided into 100 sec bins |
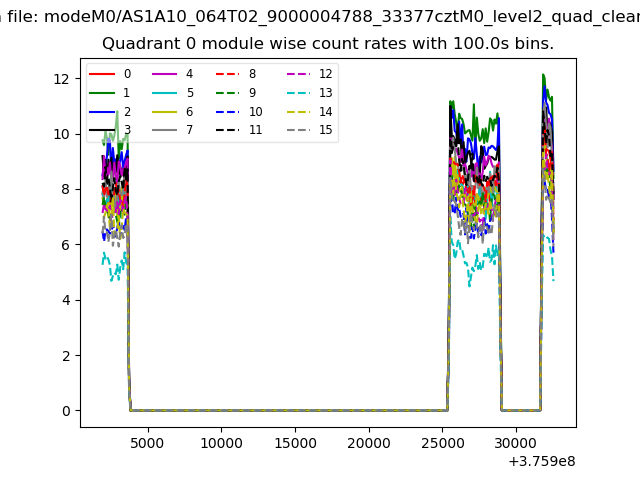 |
 |
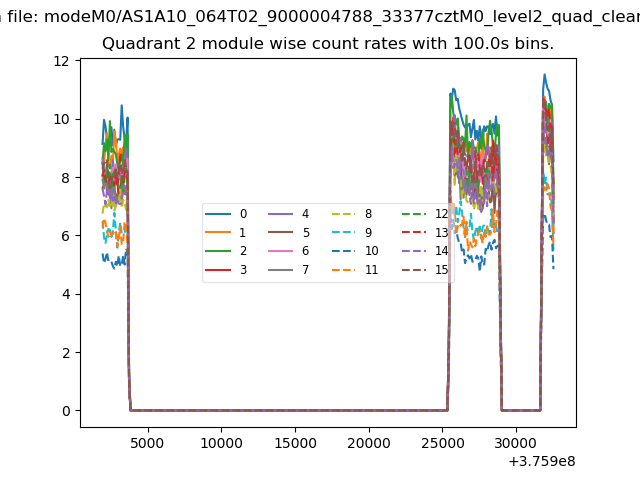
| Module-wise count rates for Quadrant B Data is divided into 100 sec bins |
 |
 |
| Module-wise count rates for Quadrant C Data is divided into 100 sec bins |
 |
 |
| Module-wise count rates for Quadrant D Data is divided into 100 sec bins |
 |
 |
| Parameter | Plot |
|---|---|
| CZT HV Monitor | 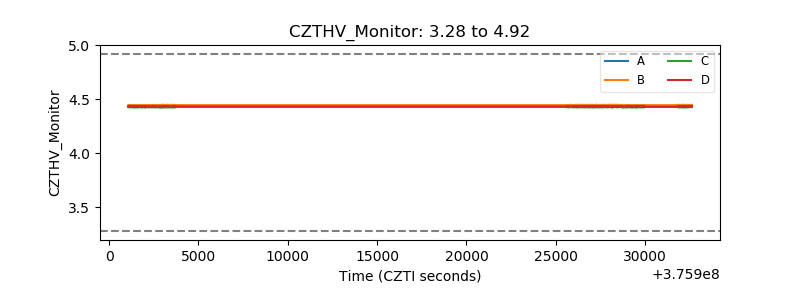 |
| D_VDD | 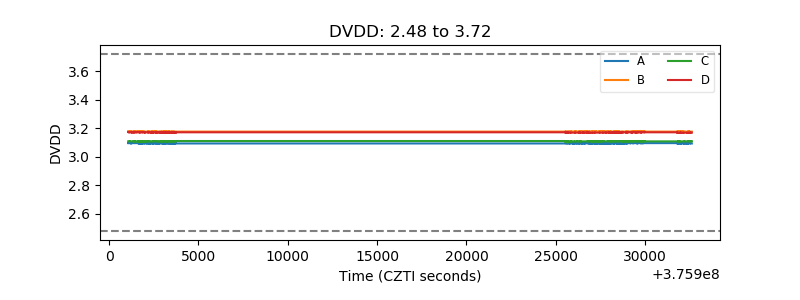 |
| Temperature 1 | 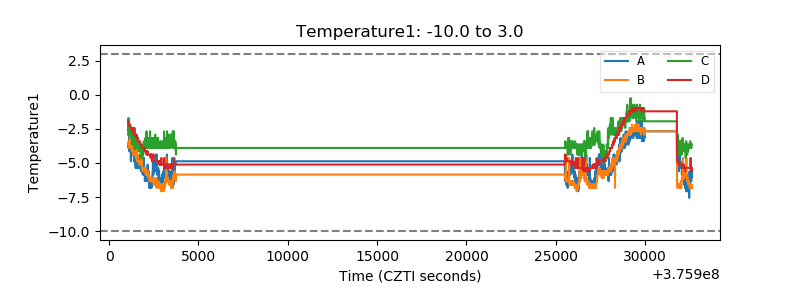 |
| Veto HV Monitor | 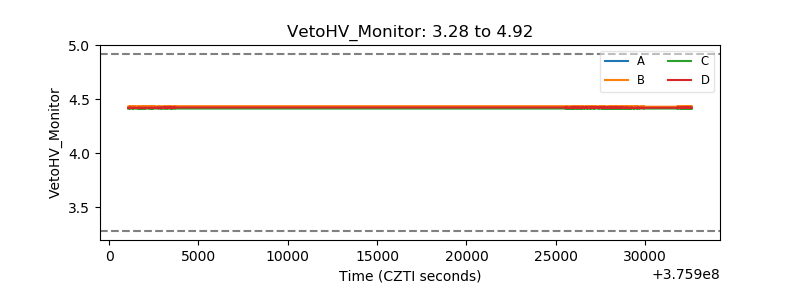 |
| Veto LLD | 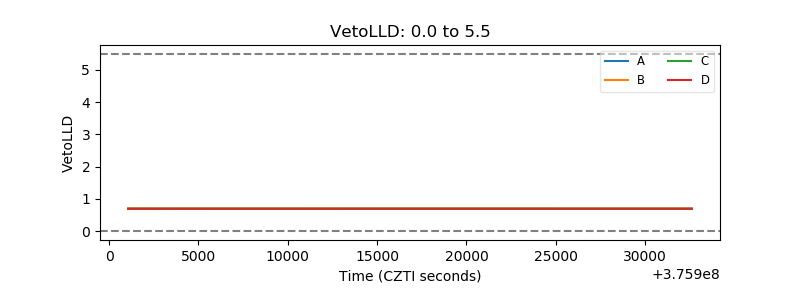 |
| Alpha Counter | 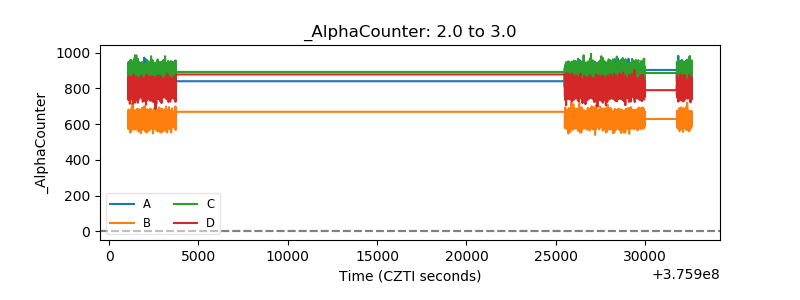 |
| _CPM_Rate | 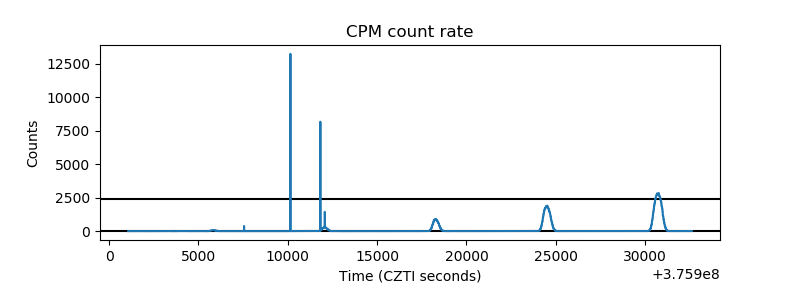 |
| CZT Counter | 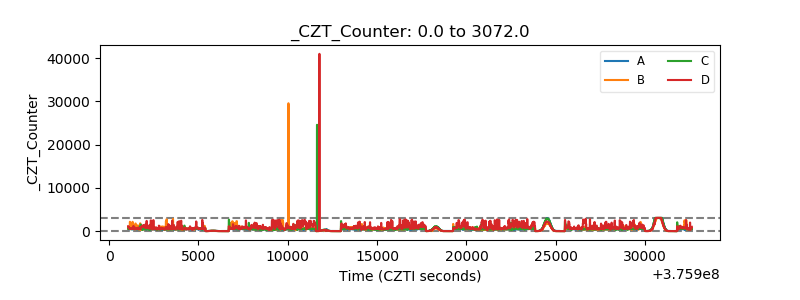 |
| +2.5 Volts monitor | 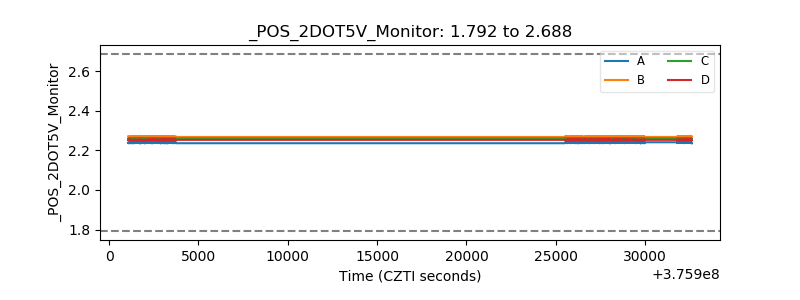 |
| +5 Volts monitor | 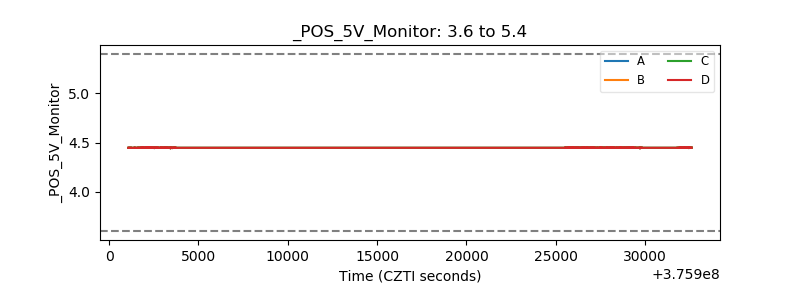 |
| _ROLL_ROT | 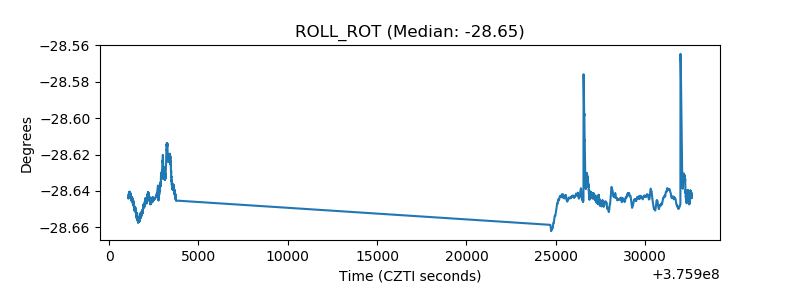 |
| _Roll_DEC | 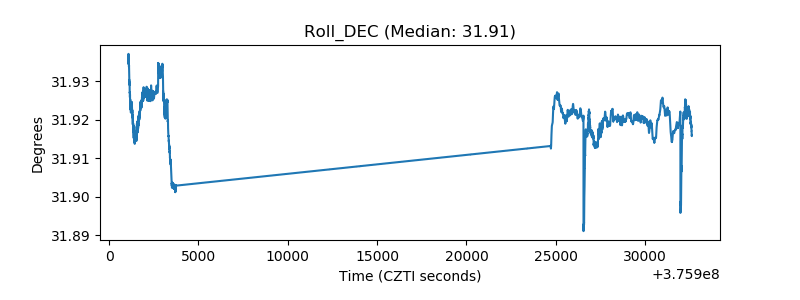 |
| _Roll_RA | 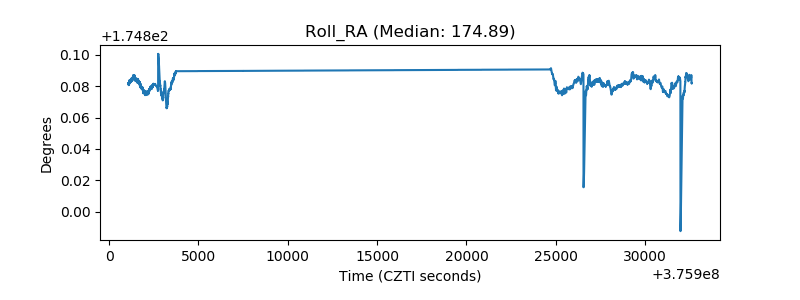 |
| Veto Counter | 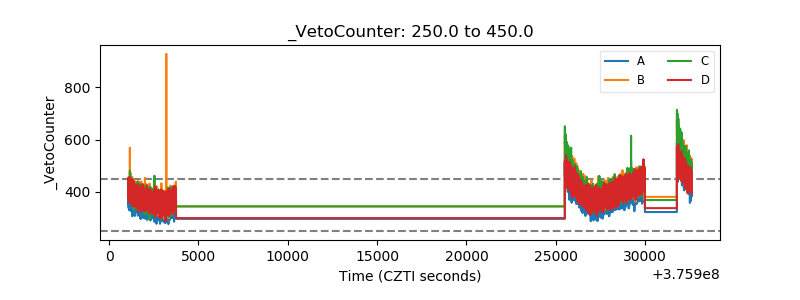 |