| Param | Original file | Final file |
|---|---|---|
| Filename | modeM0/AS1A11_047T10_9000004802_33461cztM0_level2.evt | modeM0/AS1A11_047T10_9000004802_33461cztM0_level2_quad_clean.evt |
| Size (bytes) | 283,596,480 | 53,449,920 |
| Size | 270.5 MB | 51.0 MB |
| Events in quadrant A | 1,534,892 | 355,153 |
| Events in quadrant B | 2,164,427 | 349,617 |
| Events in quadrant C | 1,719,876 | 350,400 |
| Events in quadrant D | 2,946,863 | 331,415 |
| Mode SS | |||
|---|---|---|---|
| Quadrant | BADHDUFLAG | Total packets | Discarded packets |
| A | 0 | 66 | 0 |
| B | 0 | 66 | 0 |
| C | 0 | 66 | 0 |
| D | 0 | 66 | 0 |
| Mode M9 | |||
|---|---|---|---|
| Quadrant | BADHDUFLAG | Total packets | Discarded packets |
| A | 0 | 16 | 0 |
| B | 0 | 16 | 0 |
| C | 0 | 16 | 0 |
| D | 0 | 16 | 0 |
| Mode M0 | |||
|---|---|---|---|
| Quadrant | BADHDUFLAG | Total packets | Discarded packets |
| A | 0 | 6665 | 2 |
| B | 0 | 8521 | 1 |
| C | 0 | 7075 | 1 |
| D | 0 | 10991 | 1 |
| Quadrant | Total seconds | Saturated seconds | Saturation percentage |
|---|---|---|---|
| A | 3267 | 4 | 0.122436% |
| B | 3267 | 132 | 4.040404% |
| C | 3267 | 30 | 0.918274% |
| D | 3267 | 70 | 2.142639% |
Noise dominated data is calculated using 1-second bins in cleaned event files. If a bin has >2000 counts, and if more than 50% of those come from <1% of pixels, then it is considered to be noise-dominated and hence unusable.
| Quadrant | # 1 sec bins | Bins with >0 counts | Bins with >2000 counts | High rate bins dominated by noise | Noise dominated (total time) | Noise dominated (detector-on time) | Marked lightcurve |
|---|---|---|---|---|---|---|---|
| A | 4819 | 3268 | 0 | 0 | 0.00% | 0.00% | 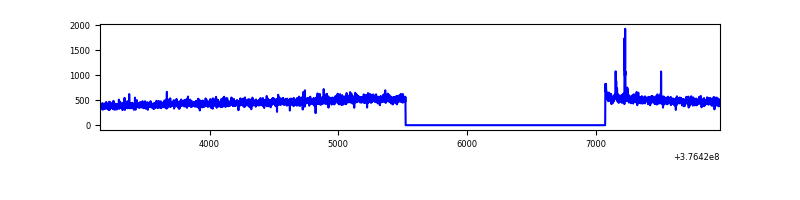 |
| B | 4819 | 3268 | 83 | 83 | 1.72% | 2.54% | 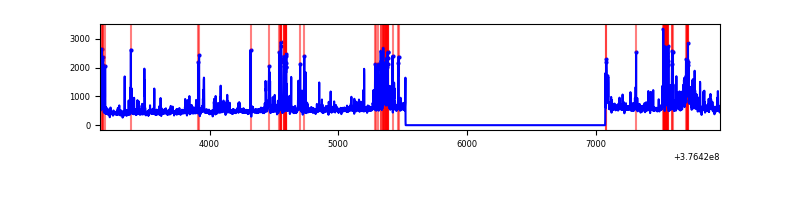 |
| C | 4819 | 3268 | 25 | 25 | 0.52% | 0.76% | 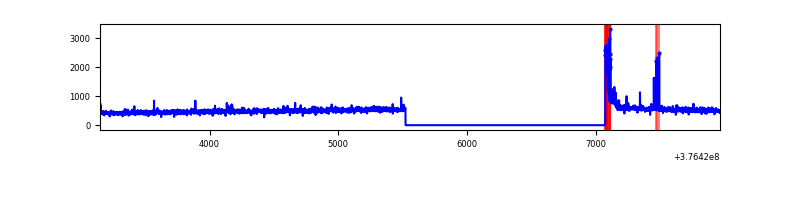 |
| D | 4819 | 3268 | 45 | 45 | 0.93% | 1.38% | 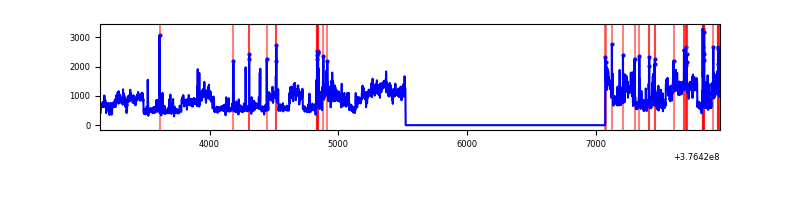 |
Top three noisy pixels from each quadrant. If the there are fewer than three noisy pixels in the level2.evt file, extra rows are filled as -1
| Pixel properties | Quadrant properties | ||||||
|---|---|---|---|---|---|---|---|
| Quadrant | DetID | PixID | Counts | Sigma | Mean | Median | Sigma |
| A | 15 | 169 | 10161 | 122.99 | 391 | 383 | 79.5 |
| A | 13 | 6 | 6850 | 81.34 | 391 | 383 | 79.5 |
| A | 13 | 254 | 6434 | 76.11 | 391 | 383 | 79.5 |
| B | 5 | 172 | 280287 | 3662.13 | 383 | 372 | 76.4 |
| B | 5 | 255 | 204300 | 2667.99 | 383 | 372 | 76.4 |
| B | 0 | 230 | 67644 | 880.12 | 383 | 372 | 76.4 |
| C | 15 | 214 | 140653 | 1601.18 | 373 | 376 | 87.6 |
| C | 0 | 10 | 84008 | 954.61 | 373 | 376 | 87.6 |
| C | 14 | 254 | 22310 | 250.36 | 373 | 376 | 87.6 |
| D | 8 | 195 | 1215264 | 12090.93 | 373 | 364 | 100.5 |
| D | 2 | 250 | 94458 | 936.44 | 373 | 364 | 100.5 |
| D | 13 | 249 | 51655 | 510.46 | 373 | 364 | 100.5 |
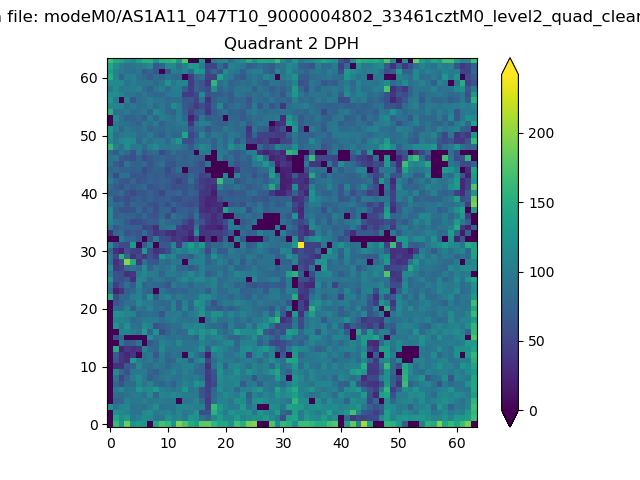
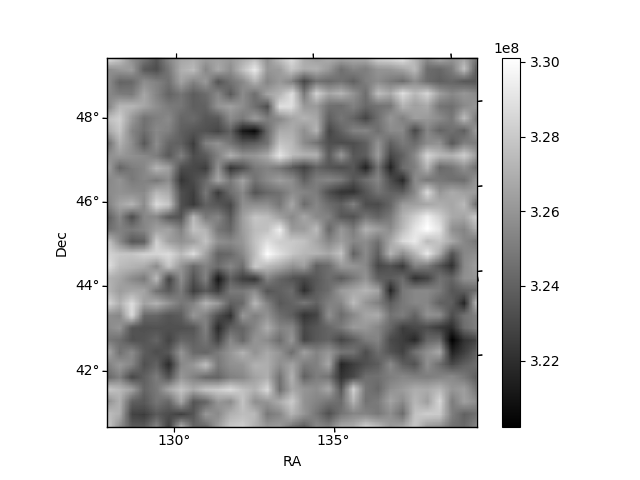
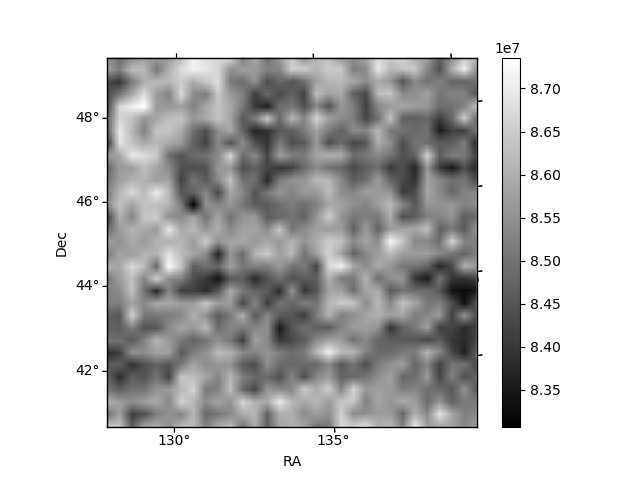
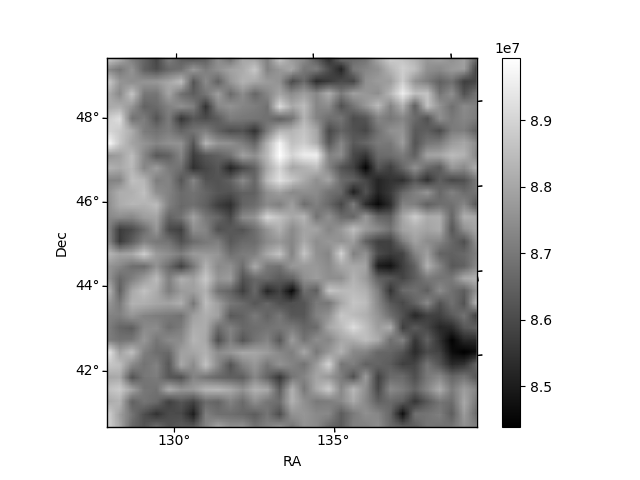
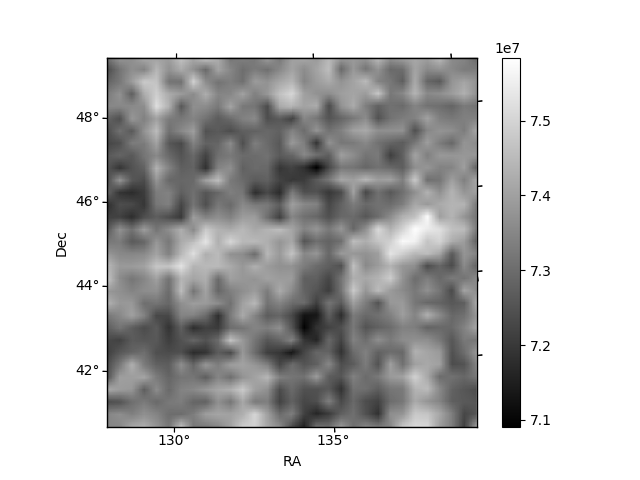
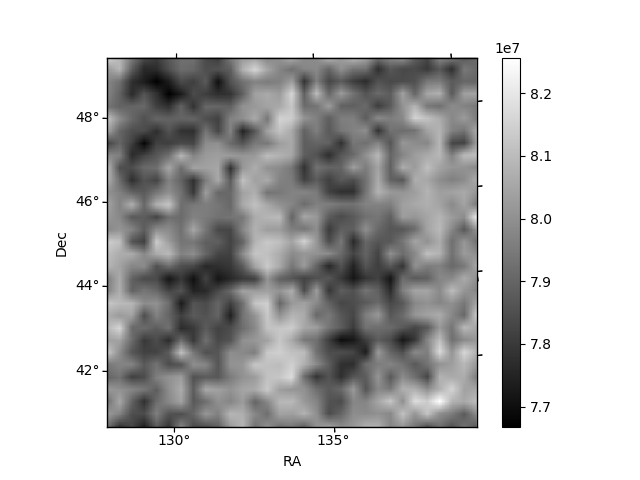
Histogram calculated using DETX and DETY for each event in the final _common_clean file
| Quadrant A | 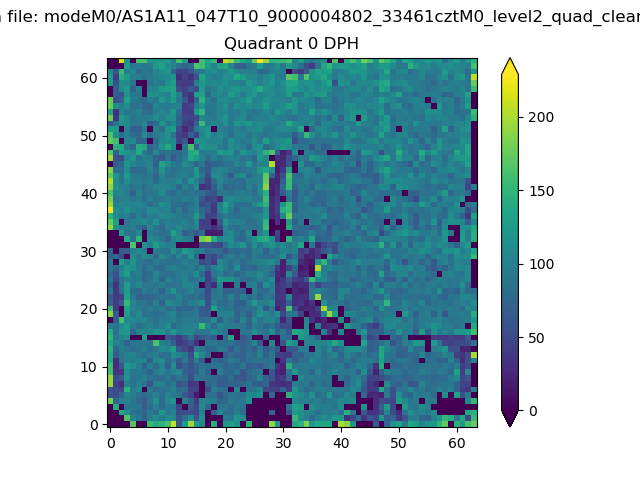 |
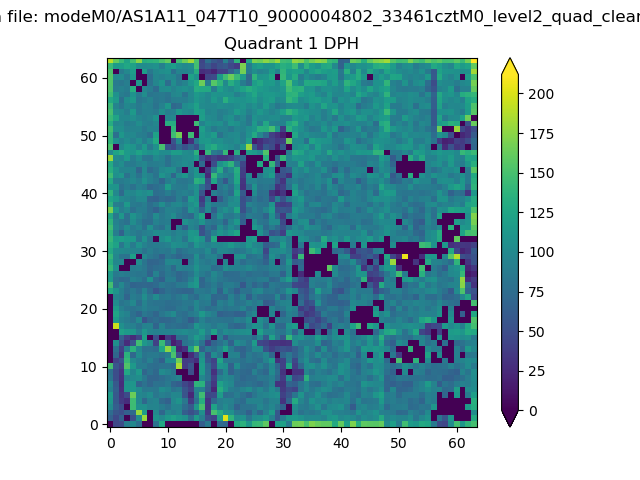 |
Quadrant B |
|---|---|---|---|
| Quadrant D | 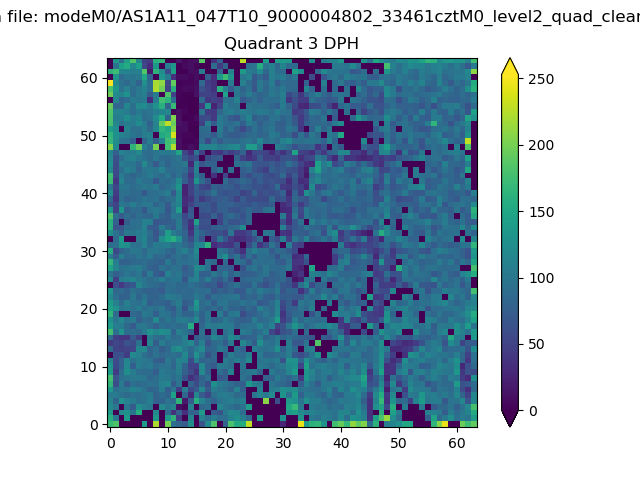 |
 |
Quadrant C |
| Plot type | Count rate plots | Images |
|---|---|---|
| Comparison with Poisson distribution Blue bars denote a histogram of data divided into 1 sec bins. Red curve is a Poisson curve with rate = median count rate of data. |
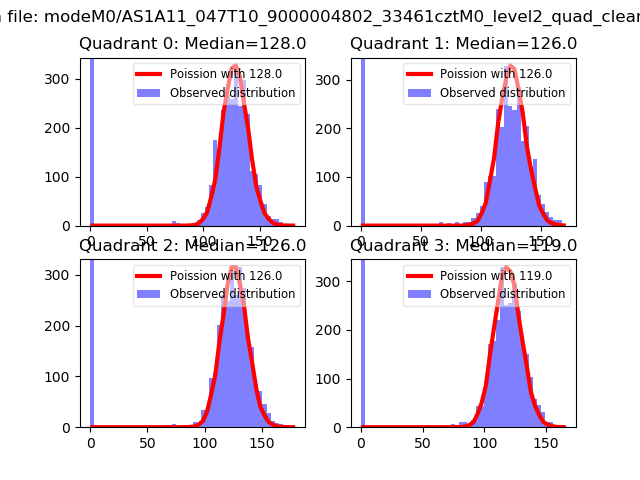 |
 |
| Quadrant-wise count rates Data is divided into 100 sec bins |
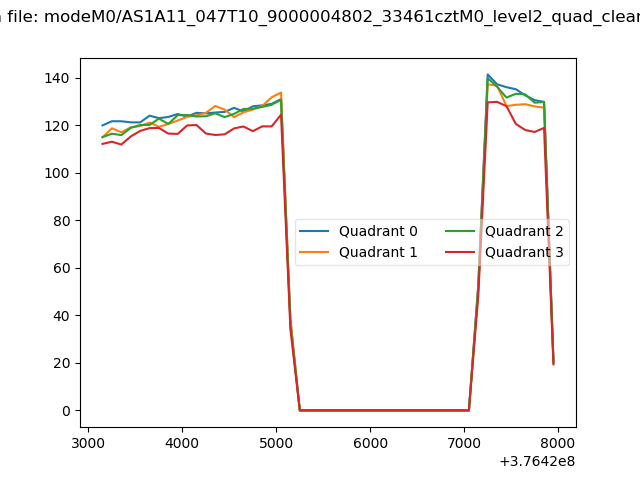 |
|
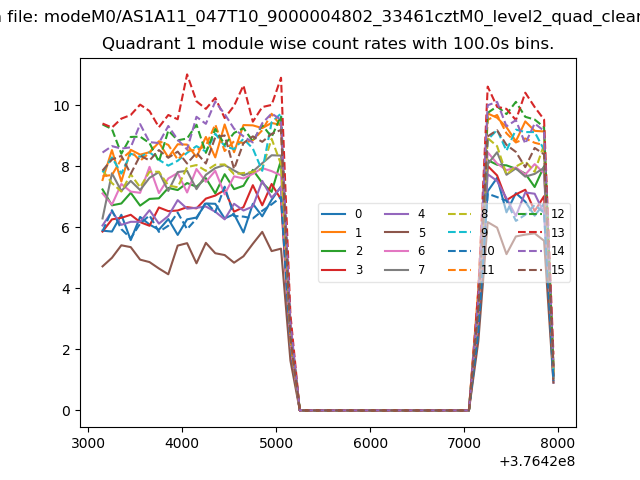
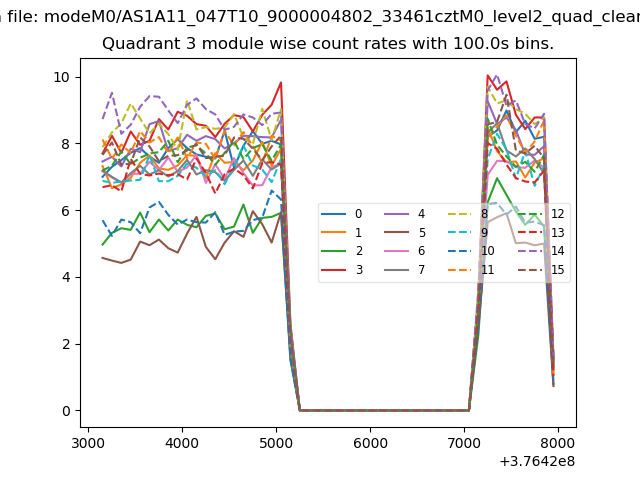
| Module-wise count rates for Quadrant A Data is divided into 100 sec bins |
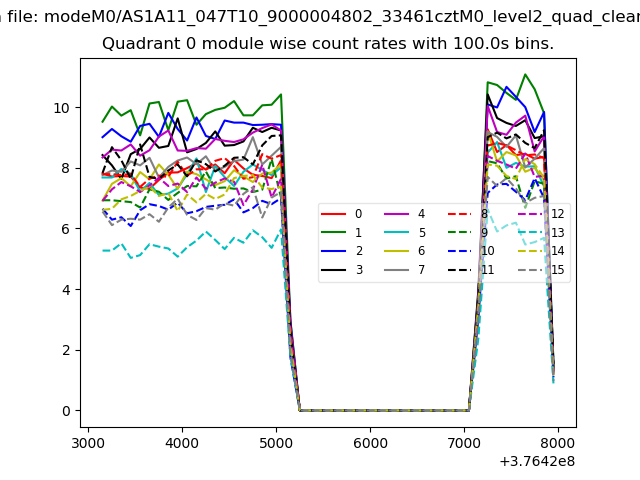 |
 |
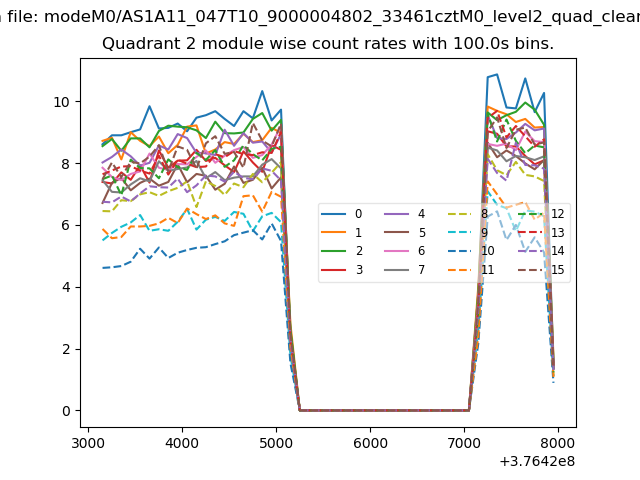
| Module-wise count rates for Quadrant B Data is divided into 100 sec bins |
 |
 |
| Module-wise count rates for Quadrant C Data is divided into 100 sec bins |
 |
 |
| Module-wise count rates for Quadrant D Data is divided into 100 sec bins |
 |
 |
| Parameter | Plot |
|---|---|
| CZT HV Monitor | 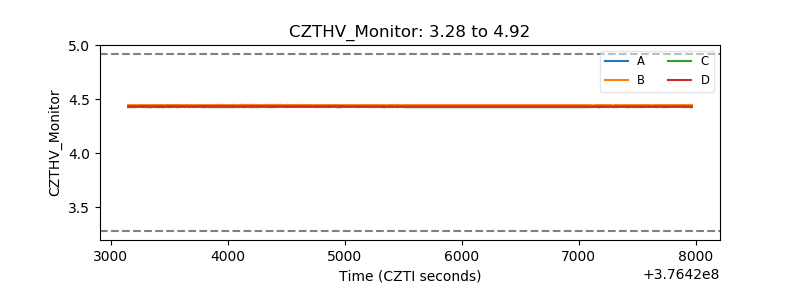 |
| D_VDD | 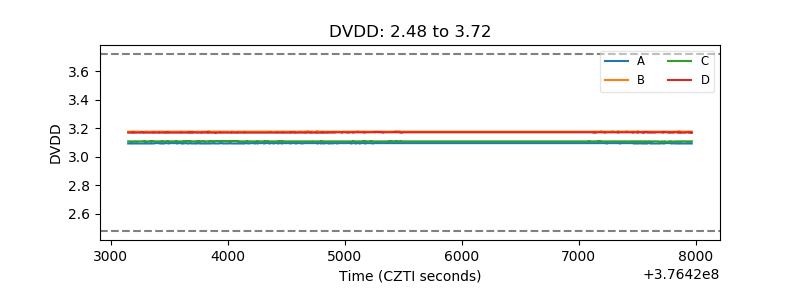 |
| Temperature 1 | 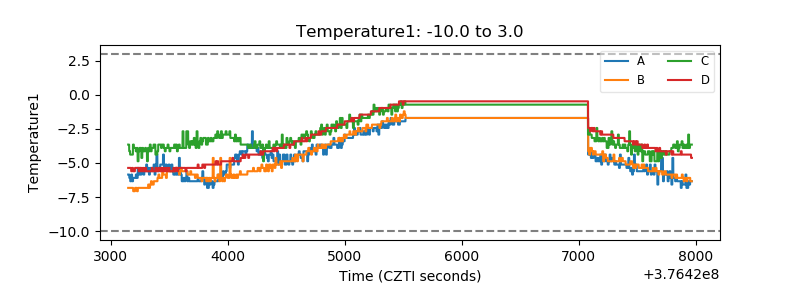 |
| Veto HV Monitor | 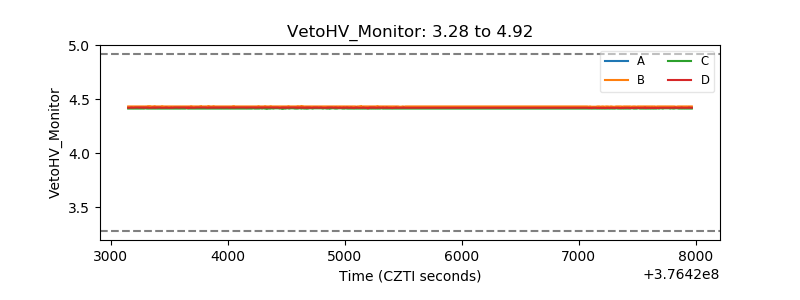 |
| Veto LLD | 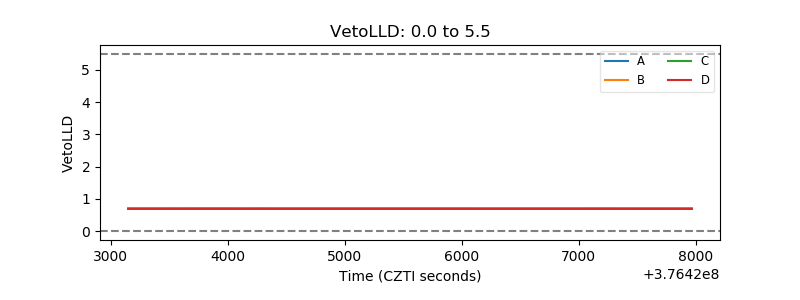 |
| Alpha Counter | 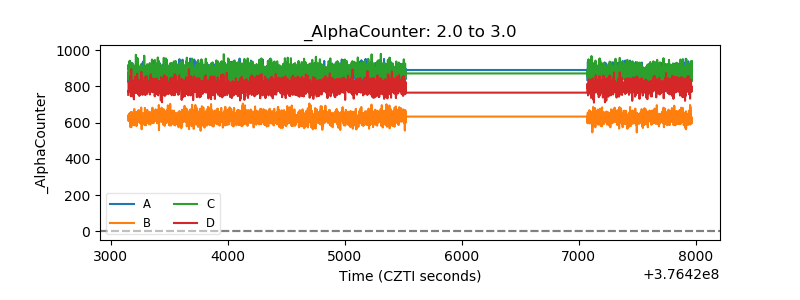 |
| _CPM_Rate | 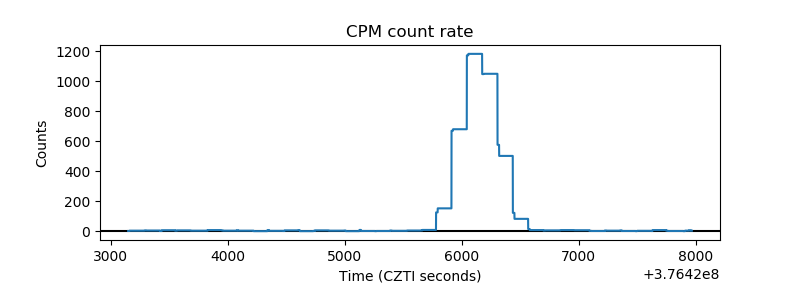 |
| CZT Counter | 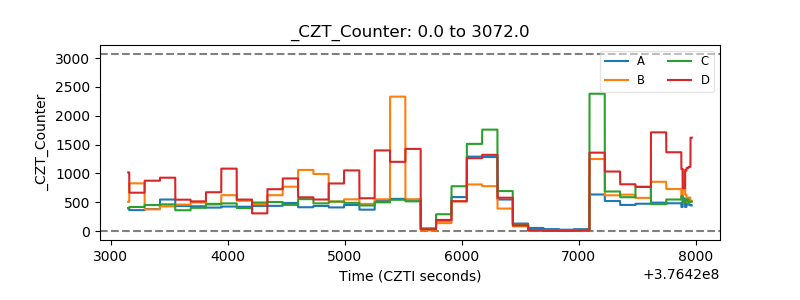 |
| +2.5 Volts monitor | 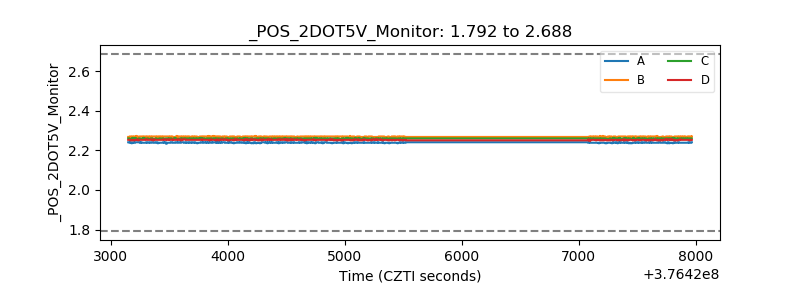 |
| +5 Volts monitor | 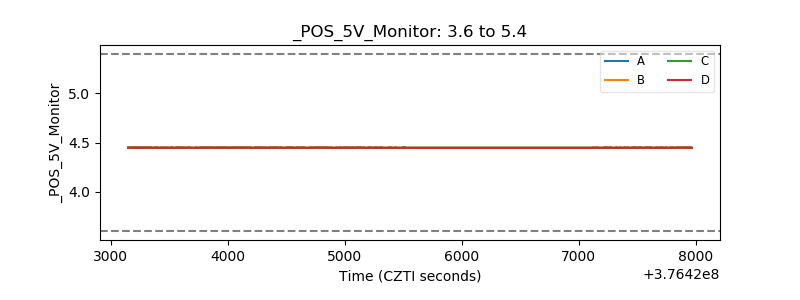 |
| _ROLL_ROT | 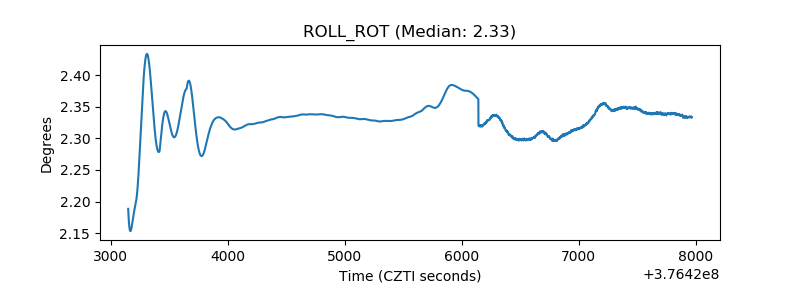 |
| _Roll_DEC | 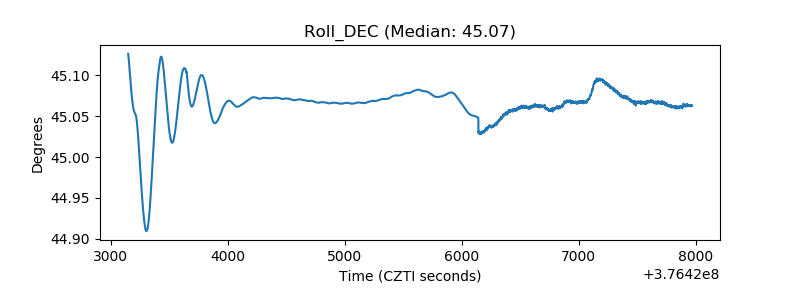 |
| _Roll_RA | 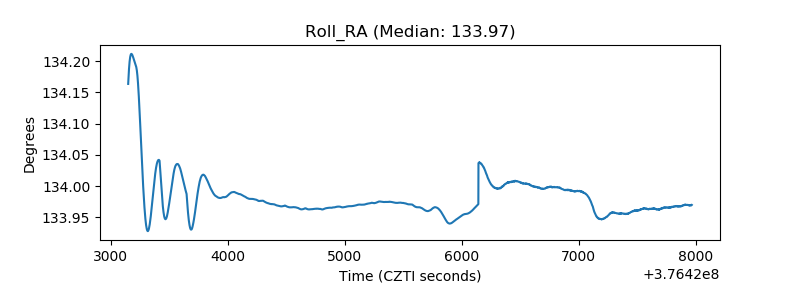 |
| Veto Counter | 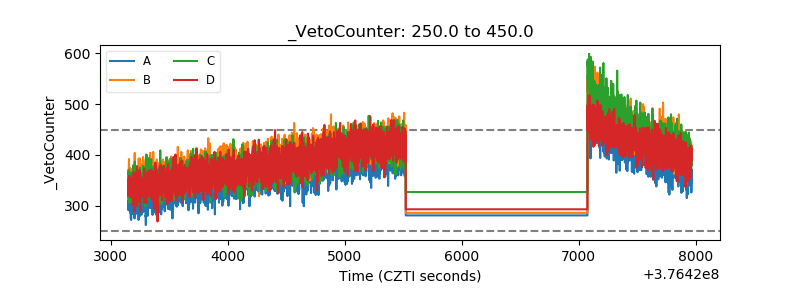 |