| Param | Original file | Final file |
|---|---|---|
| Filename | modeM0/AS1A11_060T01_9000004808_33537cztM0_level2.evt | modeM0/AS1A11_060T01_9000004808_33537cztM0_level2_quad_clean.evt |
| Size (bytes) | 452,586,240 | 71,156,160 |
| Size | 431.6 MB | 67.9 MB |
| Events in quadrant A | 2,528,576 | 461,184 |
| Events in quadrant B | 3,112,723 | 463,132 |
| Events in quadrant C | 3,126,326 | 441,168 |
| Events in quadrant D | 4,582,175 | 420,695 |
| Mode M0 | |||
|---|---|---|---|
| Quadrant | BADHDUFLAG | Total packets | Discarded packets |
| A | 0 | 10705 | 3 |
| B | 0 | 12422 | 2 |
| C | 0 | 12355 | 2 |
| D | 0 | 17300 | 2 |
| Mode M9 | |||
|---|---|---|---|
| Quadrant | BADHDUFLAG | Total packets | Discarded packets |
| A | 0 | 30 | 0 |
| B | 0 | 30 | 0 |
| C | 0 | 30 | 0 |
| D | 0 | 31 | 0 |
| Mode SS | |||
|---|---|---|---|
| Quadrant | BADHDUFLAG | Total packets | Discarded packets |
| A | 0 | 108 | 0 |
| B | 0 | 108 | 0 |
| C | 0 | 108 | 0 |
| D | 0 | 108 | 0 |
| Quadrant | Total seconds | Saturated seconds | Saturation percentage |
|---|---|---|---|
| A | 5257 | 6 | 0.114134% |
| B | 5257 | 150 | 2.853338% |
| C | 5257 | 97 | 1.845159% |
| D | 5257 | 122 | 2.320715% |
Noise dominated data is calculated using 1-second bins in cleaned event files. If a bin has >2000 counts, and if more than 50% of those come from <1% of pixels, then it is considered to be noise-dominated and hence unusable.
| Quadrant | # 1 sec bins | Bins with >0 counts | Bins with >2000 counts | High rate bins dominated by noise | Noise dominated (total time) | Noise dominated (detector-on time) | Marked lightcurve |
|---|---|---|---|---|---|---|---|
| A | 7169 | 5258 | 1 | 1 | 0.01% | 0.02% | 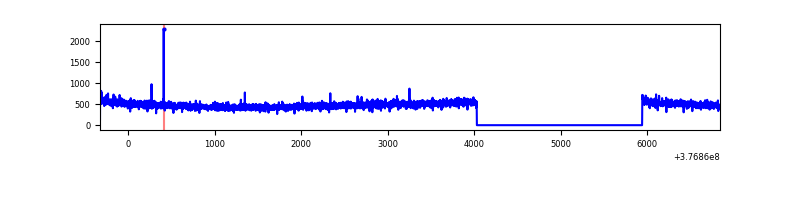 |
| B | 7169 | 5258 | 116 | 116 | 1.62% | 2.21% | 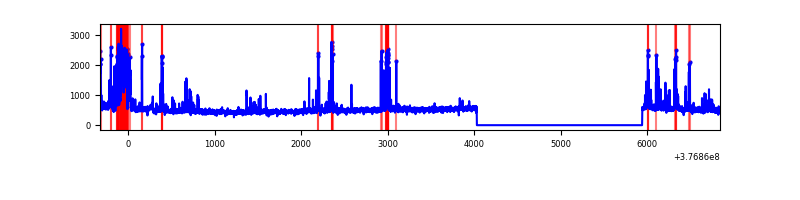 |
| C | 7169 | 5258 | 91 | 91 | 1.27% | 1.73% | 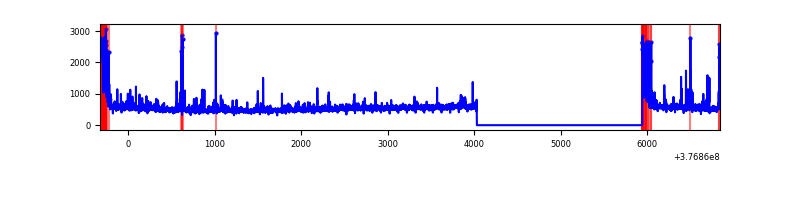 |
| D | 7169 | 5258 | 102 | 102 | 1.42% | 1.94% | 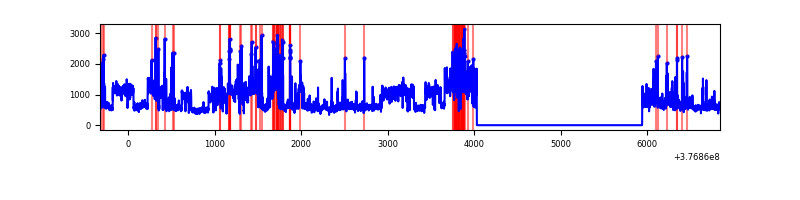 |
Top three noisy pixels from each quadrant. If the there are fewer than three noisy pixels in the level2.evt file, extra rows are filled as -1
| Pixel properties | Quadrant properties | ||||||
|---|---|---|---|---|---|---|---|
| Quadrant | DetID | PixID | Counts | Sigma | Mean | Median | Sigma |
| A | 15 | 169 | 22812 | 171.74 | 646 | 634 | 129.1 |
| A | 13 | 254 | 8839 | 63.54 | 646 | 634 | 129.1 |
| A | 3 | 137 | 6274 | 43.67 | 646 | 634 | 129.1 |
| B | 5 | 172 | 465166 | 3779.57 | 643 | 627 | 122.9 |
| B | 5 | 255 | 70528 | 568.72 | 643 | 627 | 122.9 |
| B | 12 | 111 | 14699 | 114.49 | 643 | 627 | 122.9 |
| C | 0 | 10 | 338563 | 2337.34 | 626 | 632 | 144.6 |
| C | 15 | 214 | 227173 | 1566.9 | 626 | 632 | 144.6 |
| C | 14 | 254 | 54927 | 375.54 | 626 | 632 | 144.6 |
| D | 8 | 195 | 1597077 | 10607.23 | 618 | 602 | 150.5 |
| D | 2 | 250 | 285432 | 1892.46 | 618 | 602 | 150.5 |
| D | 13 | 249 | 101353 | 669.41 | 618 | 602 | 150.5 |
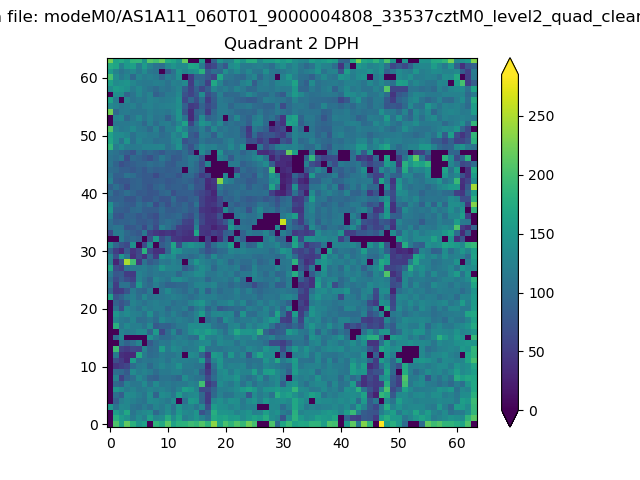
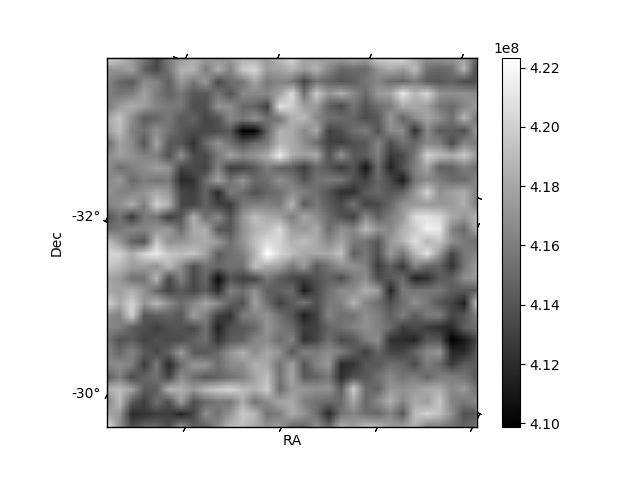
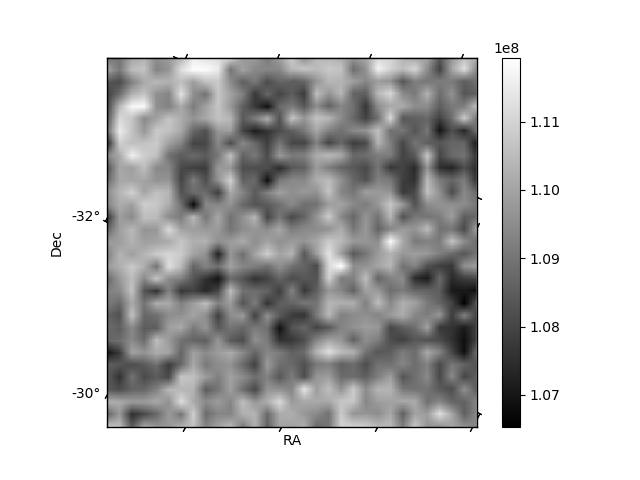
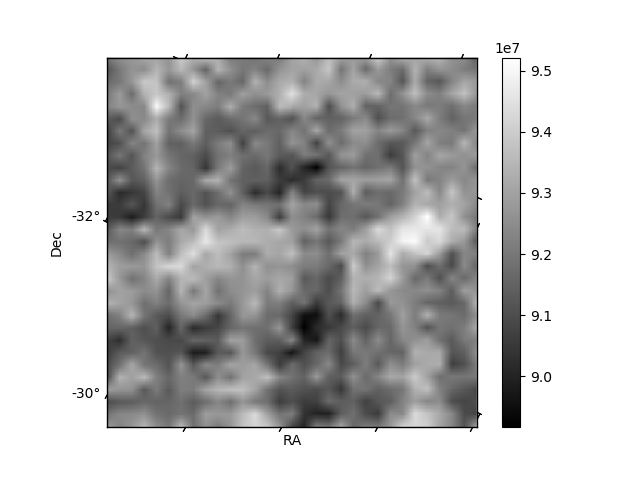
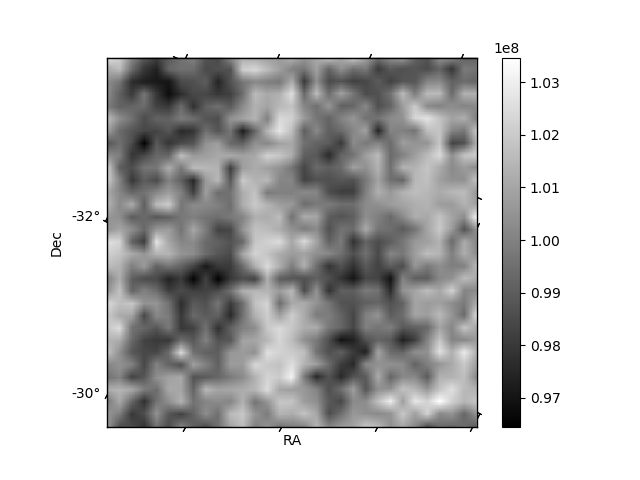
Histogram calculated using DETX and DETY for each event in the final _common_clean file
| Quadrant A | 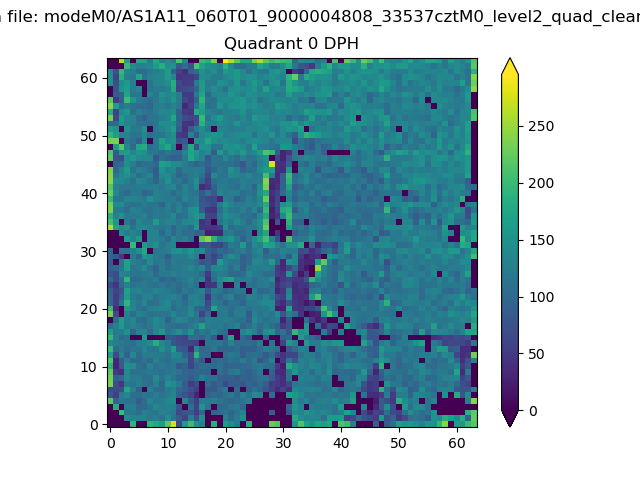 |
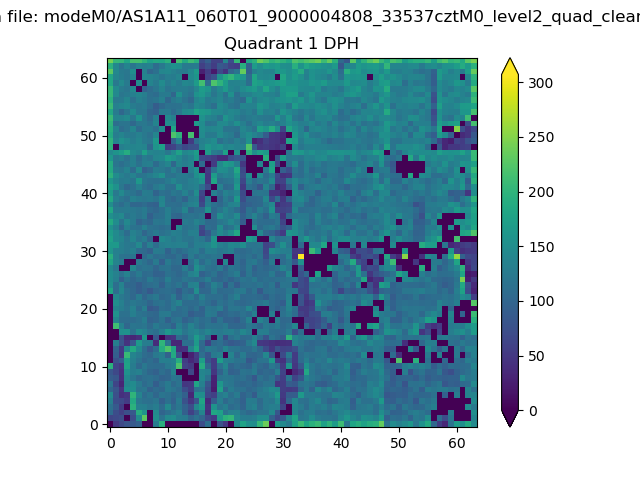 |
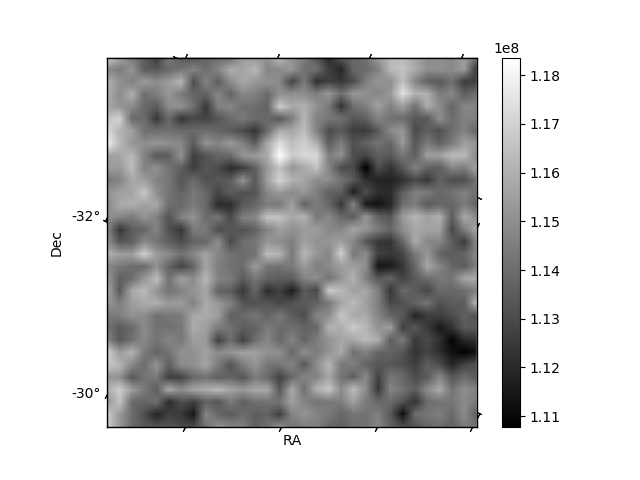
Quadrant B |
|---|---|---|---|
| Quadrant D | 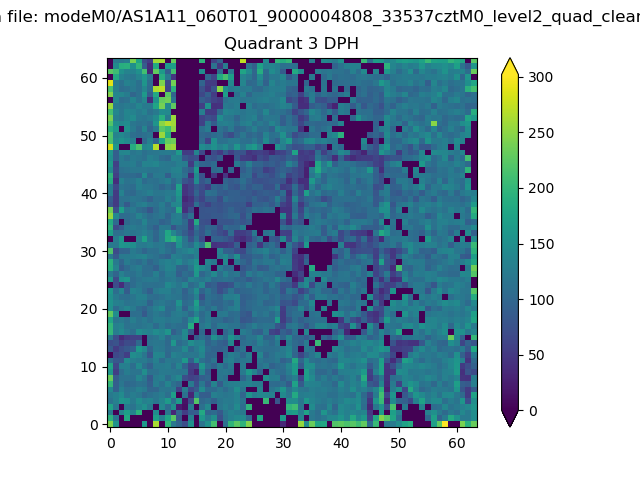 |
 |
Quadrant C |
| Plot type | Count rate plots | Images |
|---|---|---|
| Comparison with Poisson distribution Blue bars denote a histogram of data divided into 1 sec bins. Red curve is a Poisson curve with rate = median count rate of data. |
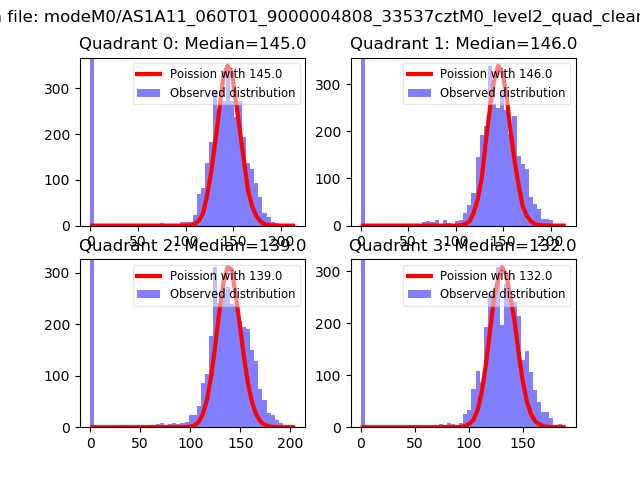 |
 |
| Quadrant-wise count rates Data is divided into 100 sec bins |
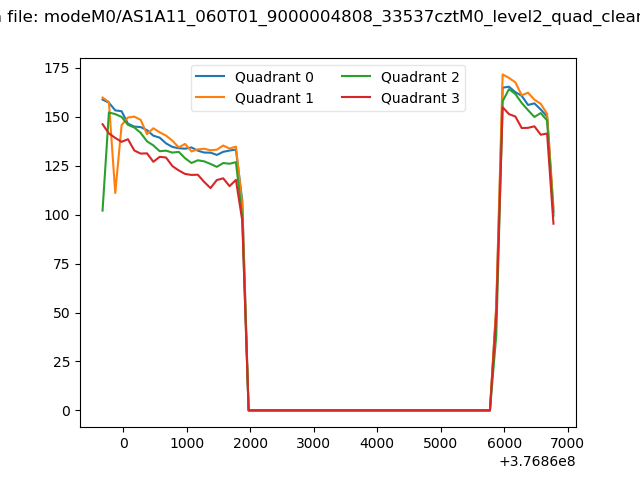 |
|
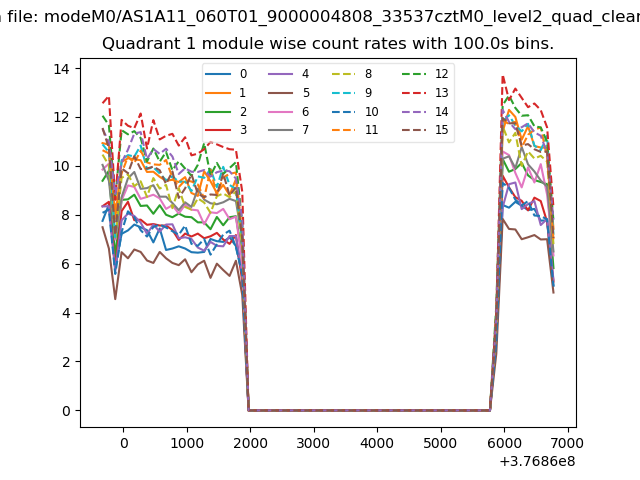
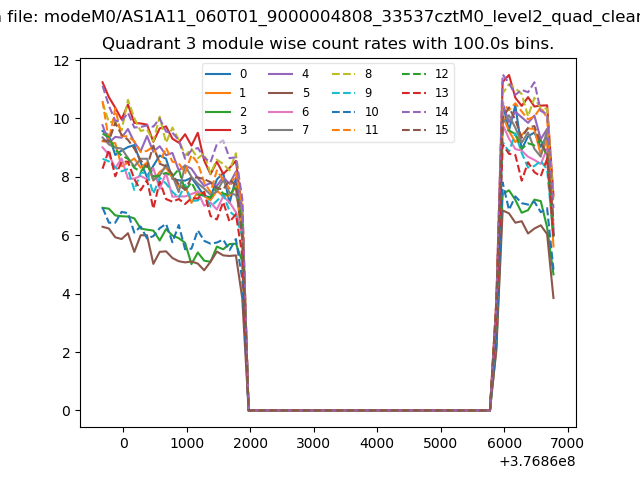
| Module-wise count rates for Quadrant A Data is divided into 100 sec bins |
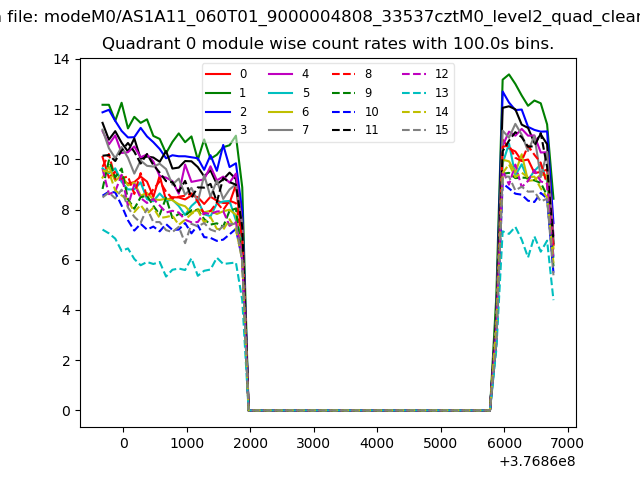 |
 |
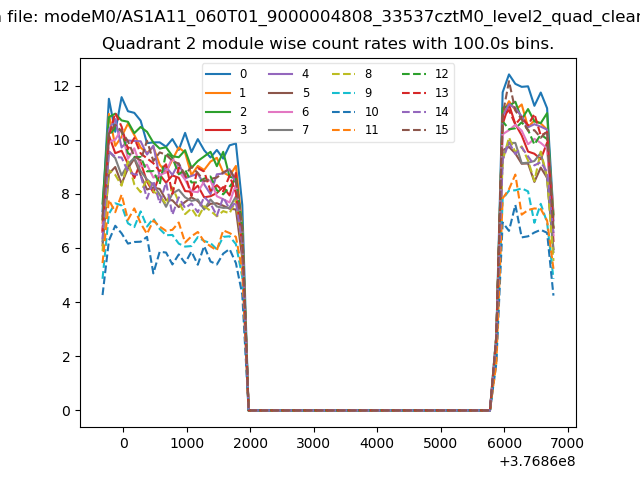
| Module-wise count rates for Quadrant B Data is divided into 100 sec bins |
 |
 |
| Module-wise count rates for Quadrant C Data is divided into 100 sec bins |
 |
 |
| Module-wise count rates for Quadrant D Data is divided into 100 sec bins |
 |
 |
| Parameter | Plot |
|---|---|
| CZT HV Monitor | 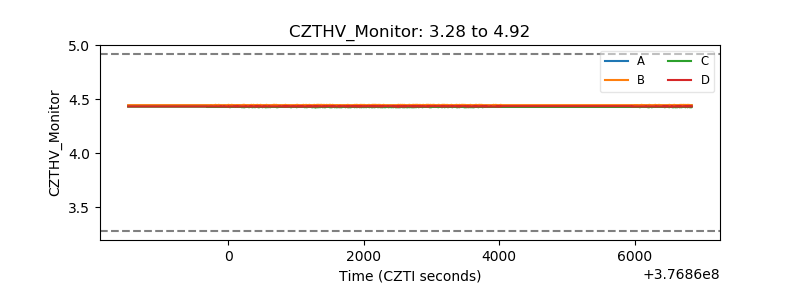 |
| D_VDD | 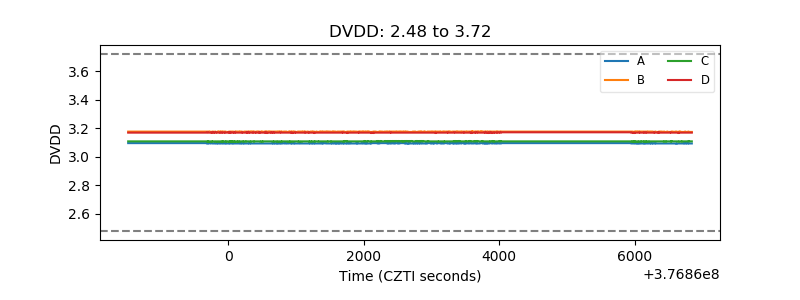 |
| Temperature 1 | 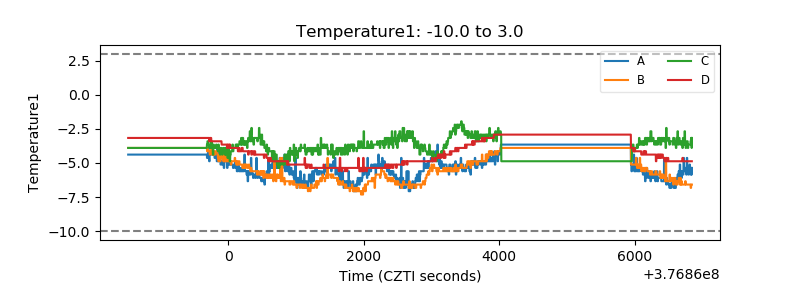 |
| Veto HV Monitor | 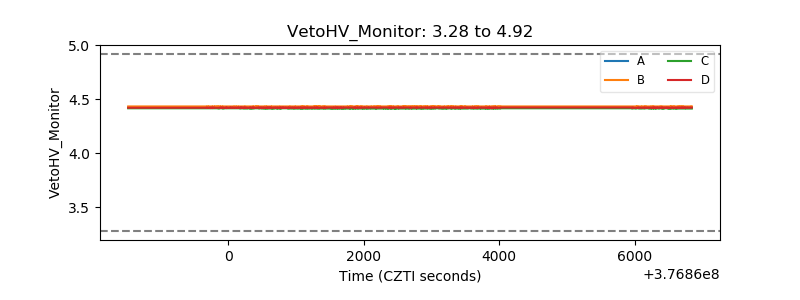 |
| Veto LLD | 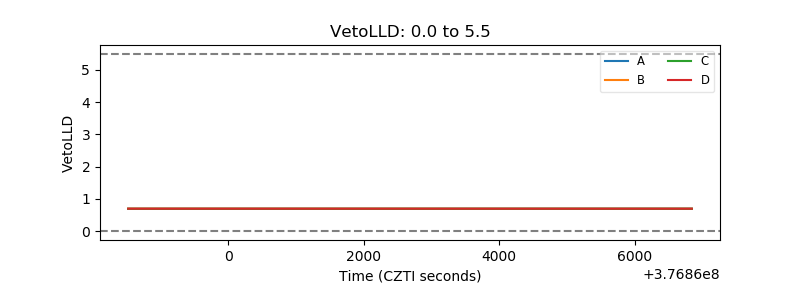 |
| Alpha Counter | 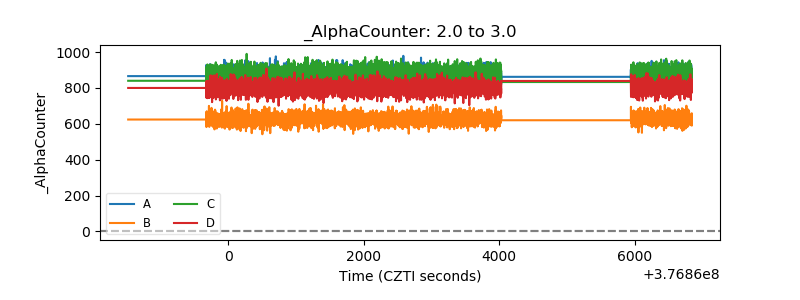 |
| _CPM_Rate | 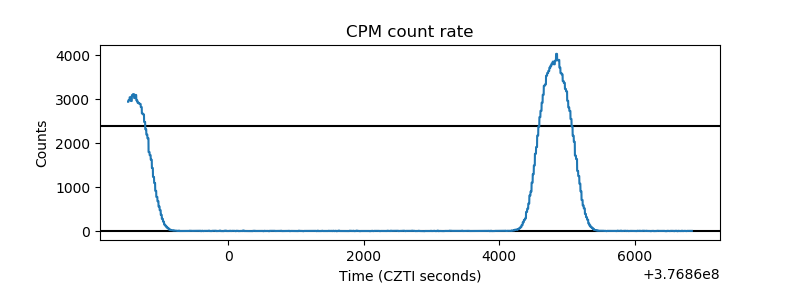 |
| CZT Counter | 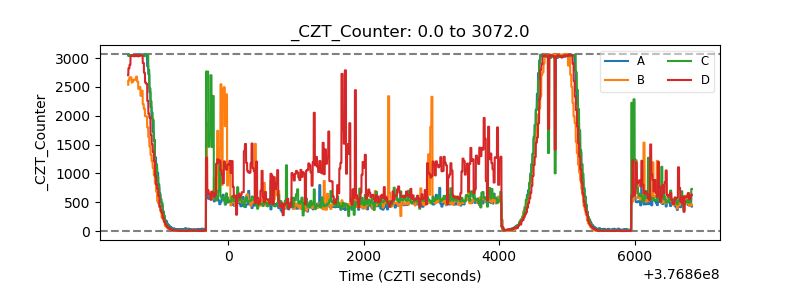 |
| +2.5 Volts monitor | 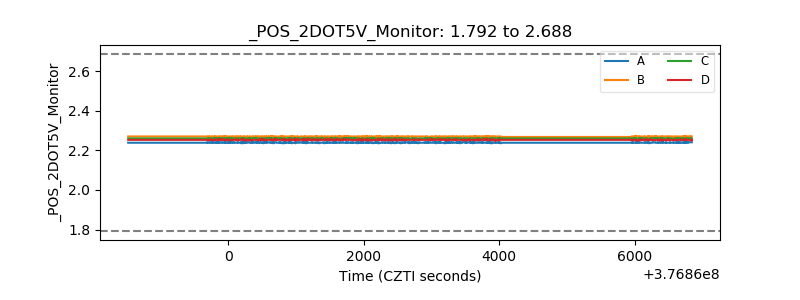 |
| +5 Volts monitor | 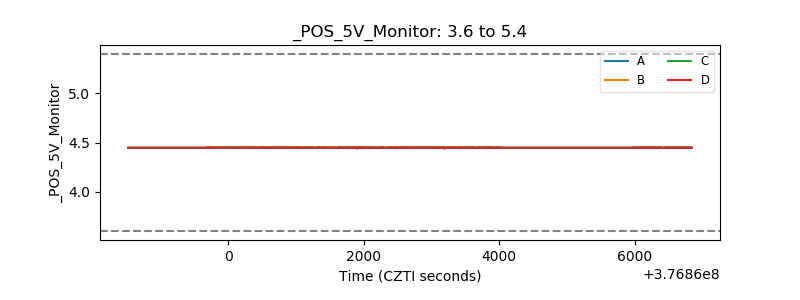 |
| _ROLL_ROT | 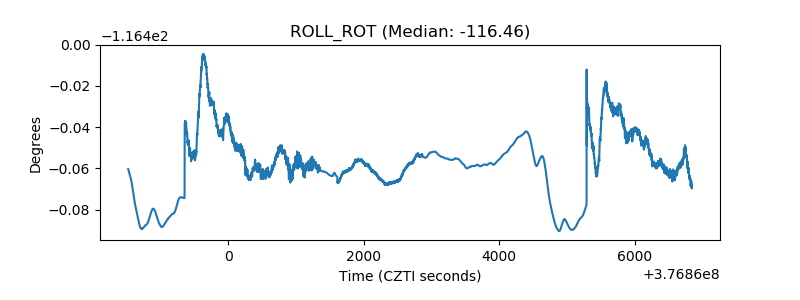 |
| _Roll_DEC | 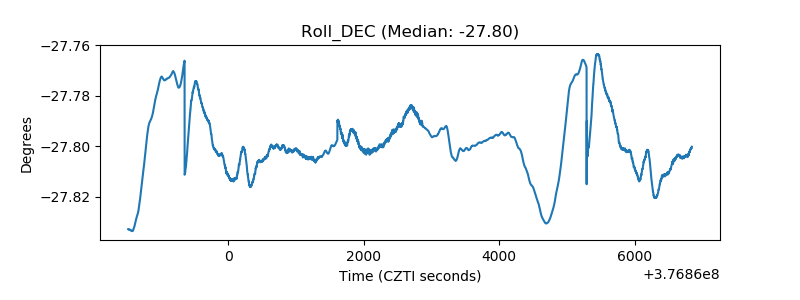 |
| _Roll_RA | 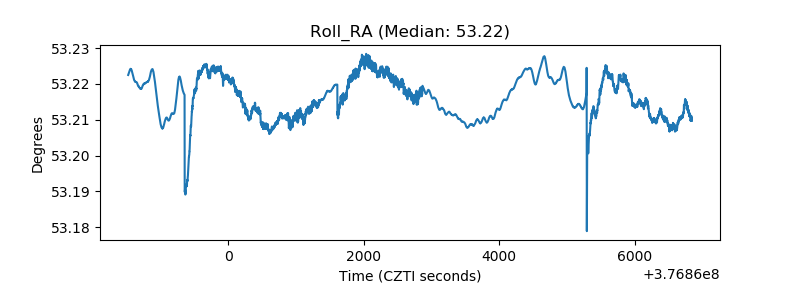 |
| Veto Counter | 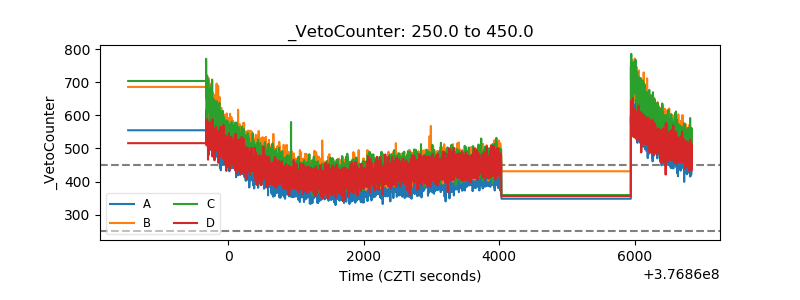 |