| Param | Original file | Final file |
|---|---|---|
| Filename | modeM0/AS1A11_037T01_9000004818_33745cztM0_level2.evt | modeM0/AS1A11_037T01_9000004818_33745cztM0_level2_quad_clean.evt |
| Size (bytes) | 133,292,160 | 15,223,680 |
| Size | 127.1 MB | 14.5 MB |
| Events in quadrant A | 934,147 | 90,382 |
| Events in quadrant B | 909,044 | 95,859 |
| Events in quadrant C | 752,191 | 93,602 |
| Events in quadrant D | 1,355,551 | 87,920 |
| Mode M9 | |||
|---|---|---|---|
| Quadrant | BADHDUFLAG | Total packets | Discarded packets |
| A | 0 | 17 | 0 |
| B | 0 | 17 | 0 |
| C | 0 | 17 | 0 |
| D | 0 | 17 | 0 |
| Mode M0 | |||
|---|---|---|---|
| Quadrant | BADHDUFLAG | Total packets | Discarded packets |
| A | 0 | 3559 | 2 |
| B | 0 | 3519 | 1 |
| C | 0 | 3003 | 1 |
| D | 0 | 4916 | 1 |
| Mode SS | |||
|---|---|---|---|
| Quadrant | BADHDUFLAG | Total packets | Discarded packets |
| A | 0 | 28 | 0 |
| B | 0 | 28 | 0 |
| C | 0 | 28 | 0 |
| D | 0 | 28 | 0 |
| Quadrant | Total seconds | Saturated seconds | Saturation percentage |
|---|---|---|---|
| A | 1223 | 82 | 6.704824% |
| B | 1223 | 92 | 7.522486% |
| C | 1223 | 36 | 2.943581% |
| D | 1223 | 54 | 4.415372% |
Noise dominated data is calculated using 1-second bins in cleaned event files. If a bin has >2000 counts, and if more than 50% of those come from <1% of pixels, then it is considered to be noise-dominated and hence unusable.
| Quadrant | # 1 sec bins | Bins with >0 counts | Bins with >2000 counts | High rate bins dominated by noise | Noise dominated (total time) | Noise dominated (detector-on time) | Marked lightcurve |
|---|---|---|---|---|---|---|---|
| A | 2954 | 1224 | 84 | 84 | 2.84% | 6.86% | 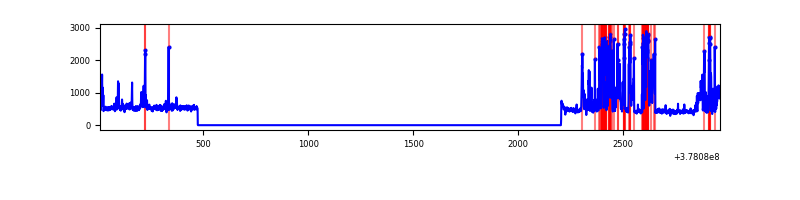 |
| B | 2953 | 1222 | 46 | 46 | 1.56% | 3.76% | 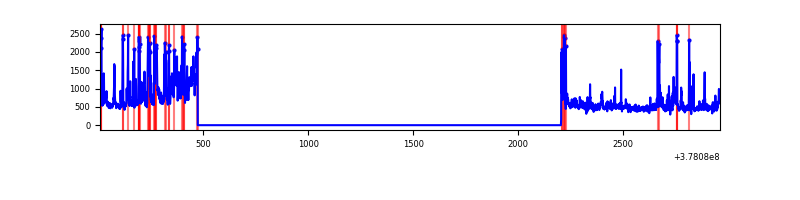 |
| C | 2954 | 1224 | 31 | 31 | 1.05% | 2.53% | 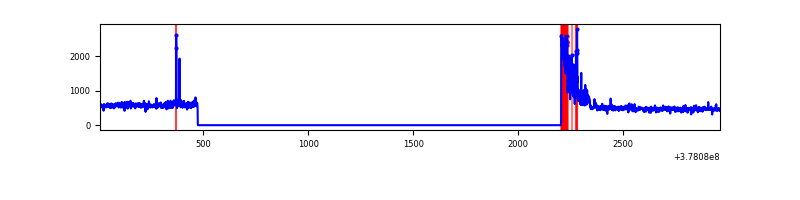 |
| D | 2954 | 1224 | 41 | 41 | 1.39% | 3.35% | 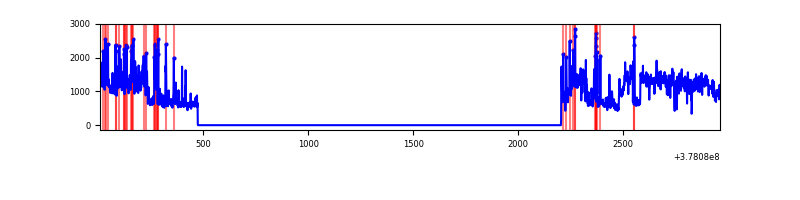 |
Top three noisy pixels from each quadrant. If the there are fewer than three noisy pixels in the level2.evt file, extra rows are filled as -1
| Pixel properties | Quadrant properties | ||||||
|---|---|---|---|---|---|---|---|
| Quadrant | DetID | PixID | Counts | Sigma | Mean | Median | Sigma |
| A | 14 | 4 | 331119 | 10822.69 | 142 | 139 | 30.6 |
| A | 15 | 237 | 47932 | 1562.78 | 142 | 139 | 30.6 |
| A | 10 | 83 | 4101 | 129.55 | 142 | 139 | 30.6 |
| B | 5 | 172 | 148195 | 5104.0 | 142 | 139 | 29.0 |
| B | 0 | 189 | 55228 | 1899.11 | 142 | 139 | 29.0 |
| B | 0 | 229 | 51661 | 1776.14 | 142 | 139 | 29.0 |
| C | 0 | 10 | 103933 | 3066.23 | 140 | 141 | 33.9 |
| C | 15 | 214 | 56437 | 1663.1 | 140 | 141 | 33.9 |
| C | 9 | 187 | 23364 | 686.06 | 140 | 141 | 33.9 |
| D | 8 | 195 | 601557 | 15677.7 | 137 | 133 | 38.4 |
| D | 12 | 233 | 69036 | 1796.14 | 137 | 133 | 38.4 |
| D | 12 | 6 | 36440 | 946.44 | 137 | 133 | 38.4 |
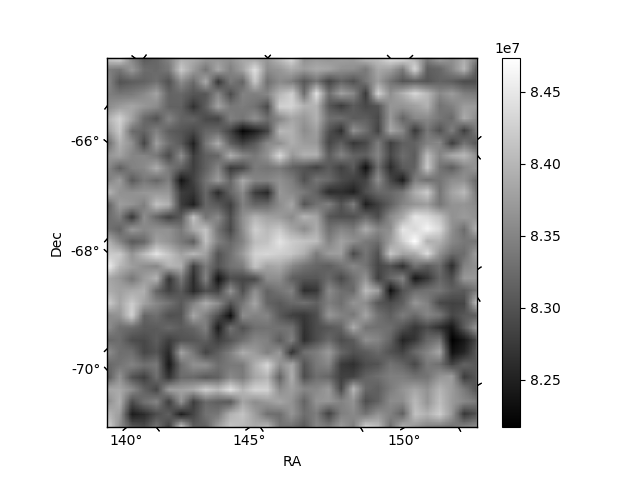
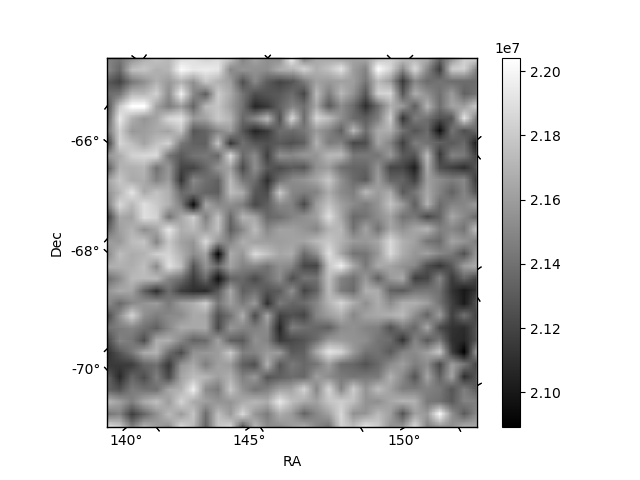
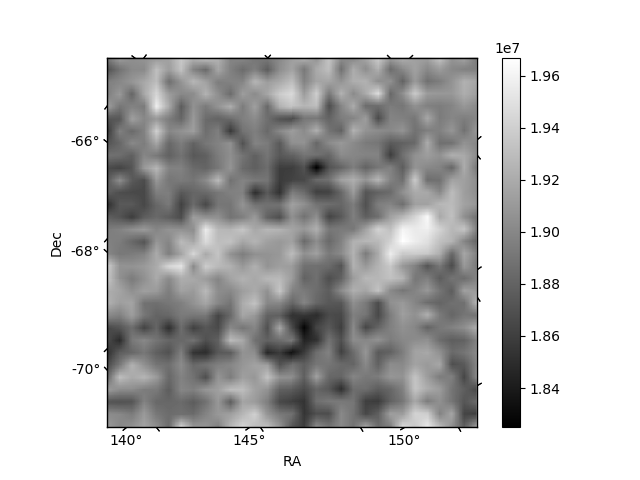
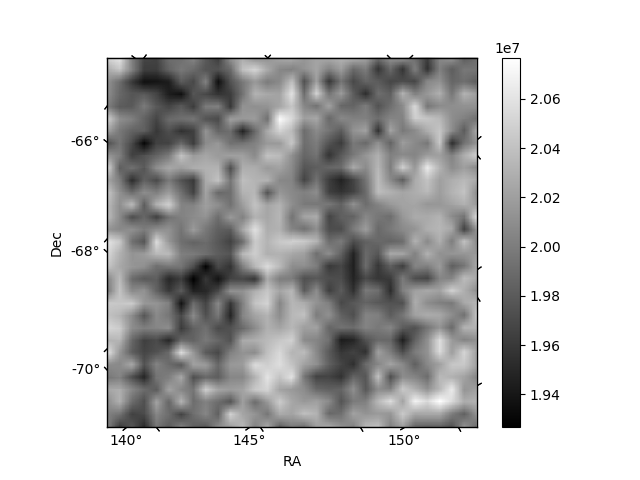
Histogram calculated using DETX and DETY for each event in the final _common_clean file
| Quadrant A | 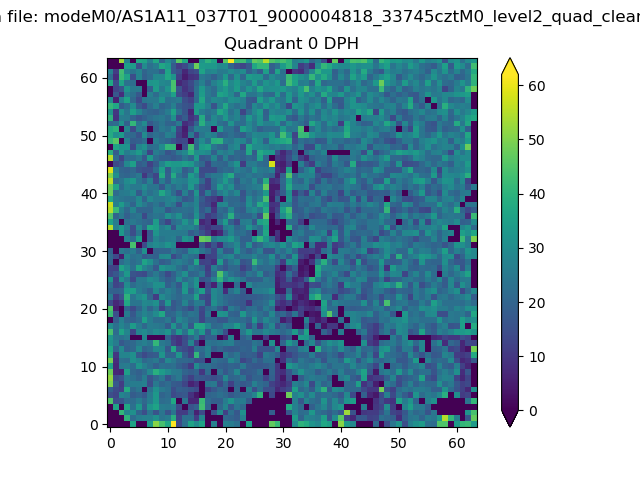 |
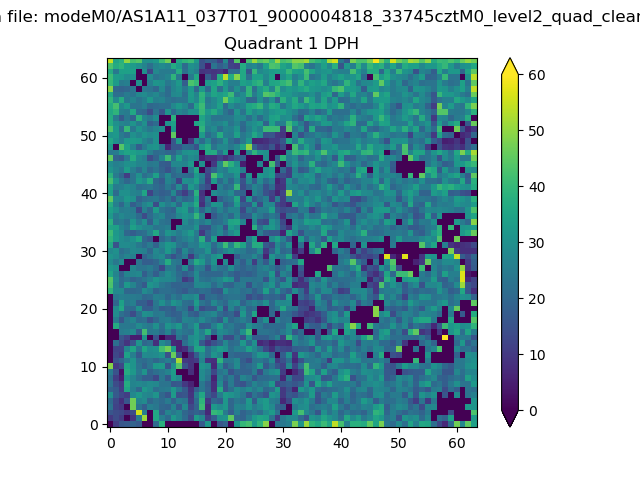 |
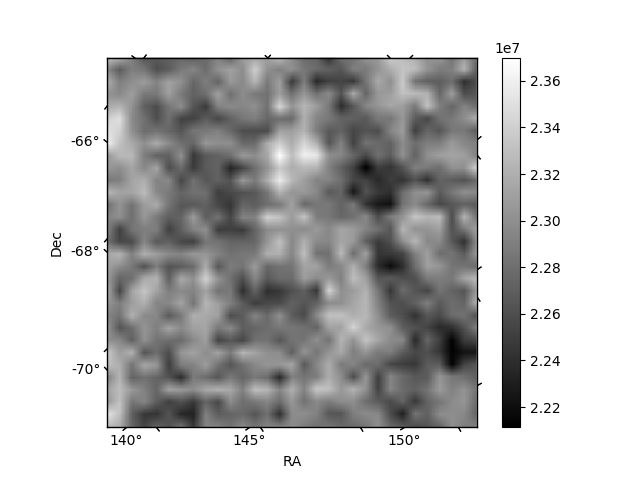
Quadrant B |
|---|---|---|---|
| Quadrant D | 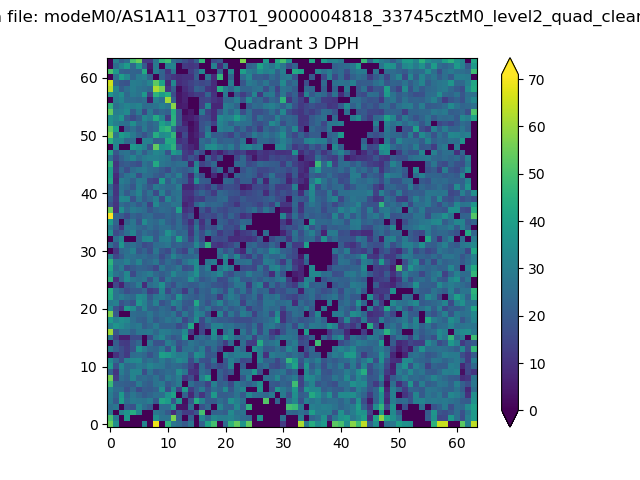 |
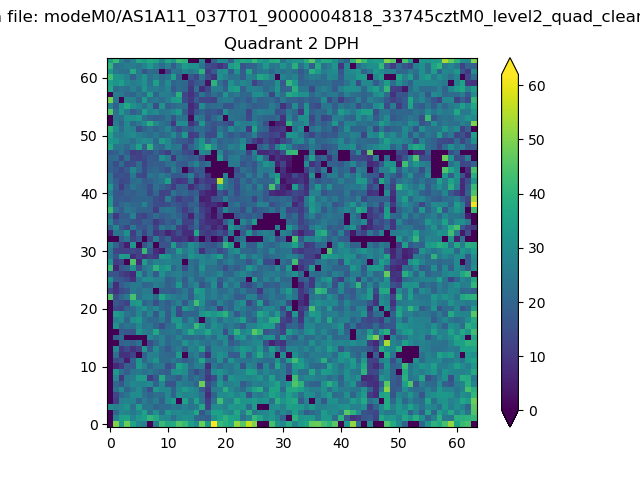 |
Quadrant C |
| Plot type | Count rate plots | Images |
|---|---|---|
| Comparison with Poisson distribution Blue bars denote a histogram of data divided into 1 sec bins. Red curve is a Poisson curve with rate = median count rate of data. |
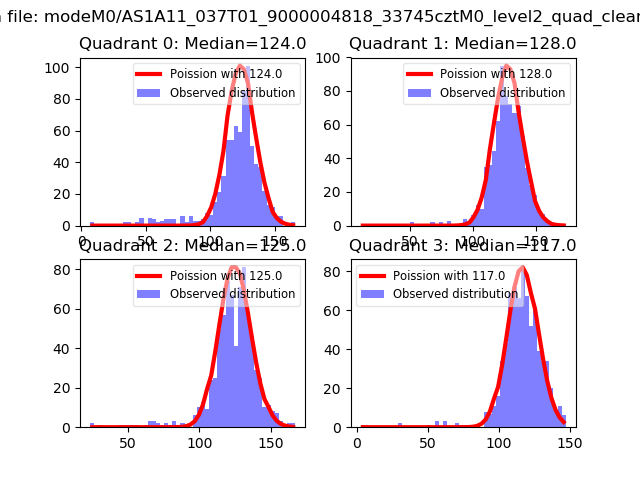 |
 |
| Quadrant-wise count rates Data is divided into 100 sec bins |
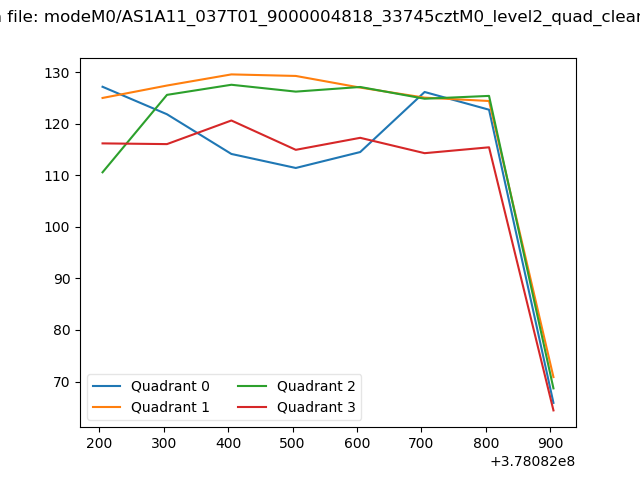 |
|
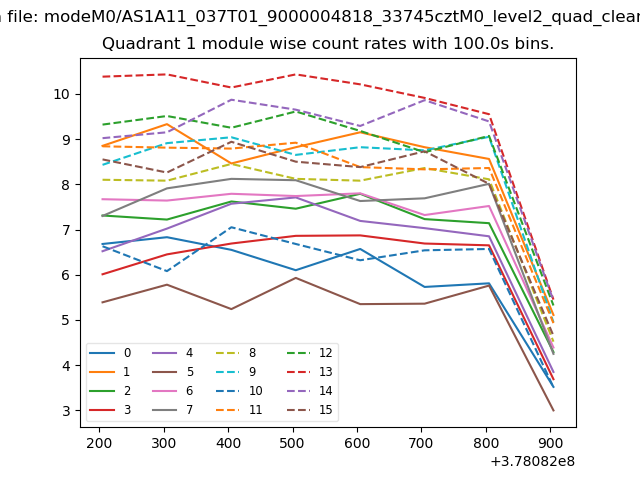
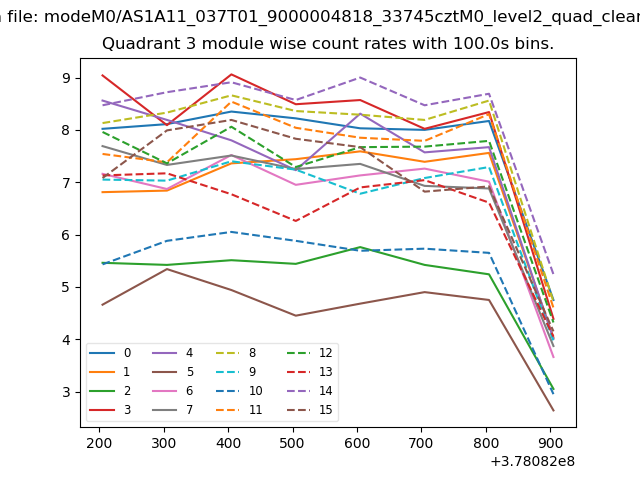
| Module-wise count rates for Quadrant A Data is divided into 100 sec bins |
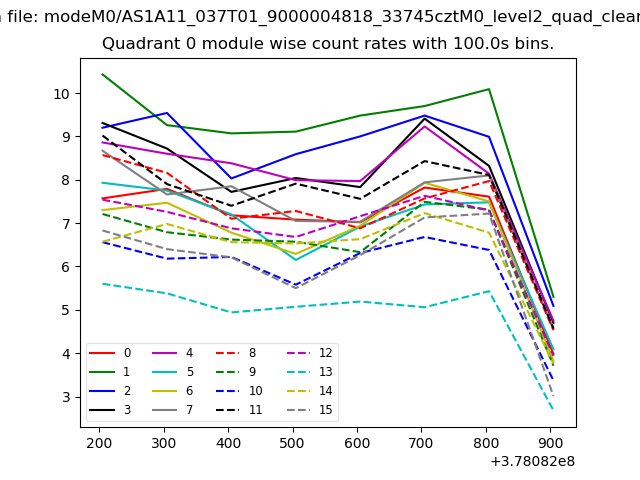 |
 |
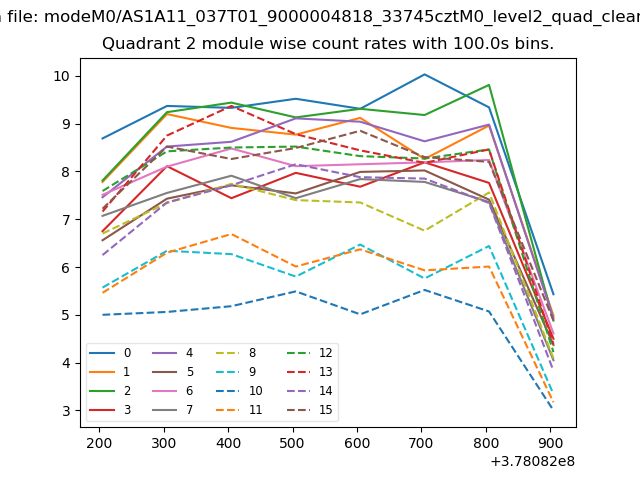
| Module-wise count rates for Quadrant B Data is divided into 100 sec bins |
 |
 |
| Module-wise count rates for Quadrant C Data is divided into 100 sec bins |
 |
 |
| Module-wise count rates for Quadrant D Data is divided into 100 sec bins |
 |
 |
| Parameter | Plot |
|---|---|
| CZT HV Monitor | 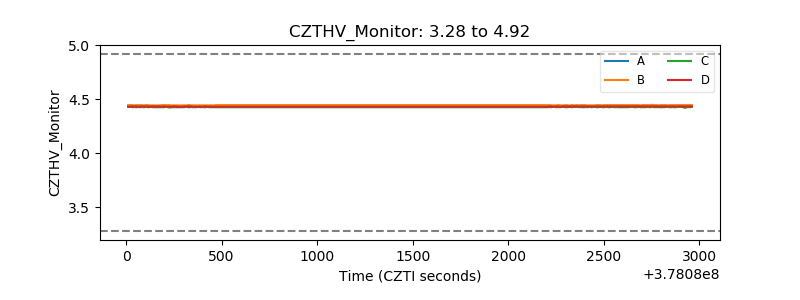 |
| D_VDD | 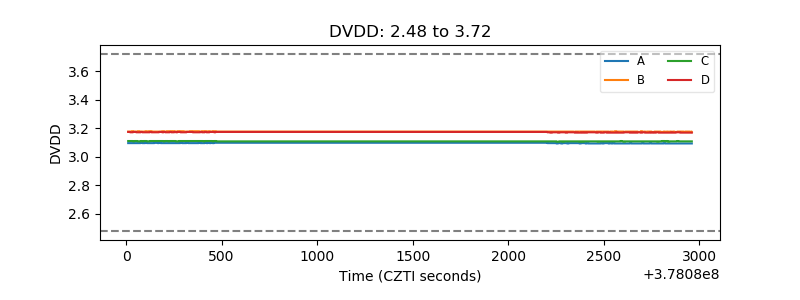 |
| Temperature 1 | 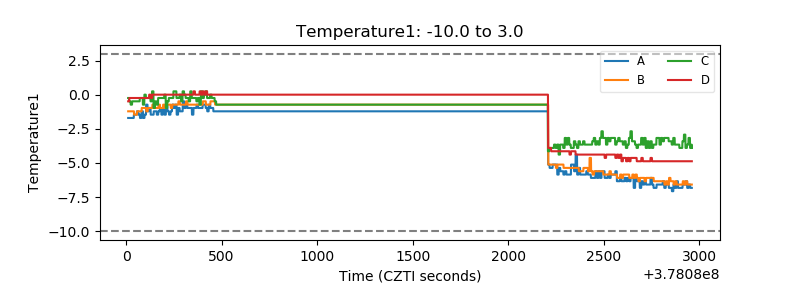 |
| Veto HV Monitor | 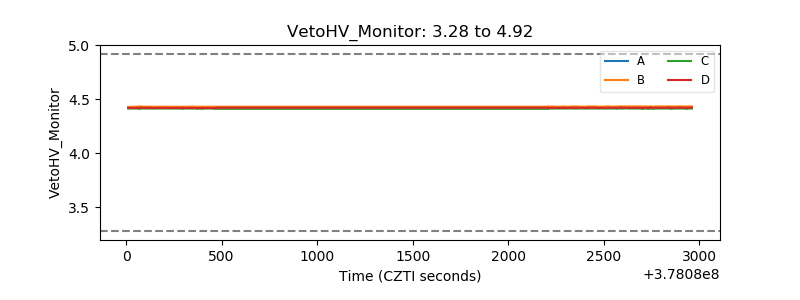 |
| Veto LLD | 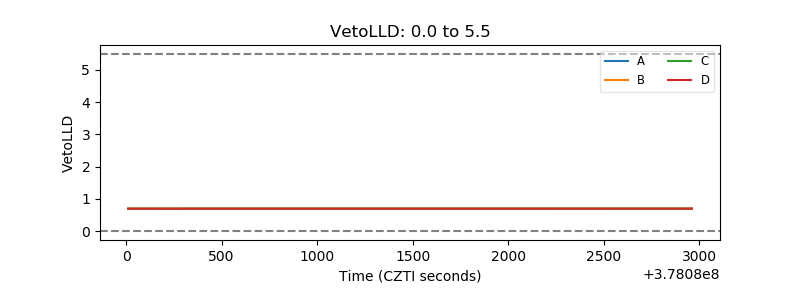 |
| Alpha Counter | 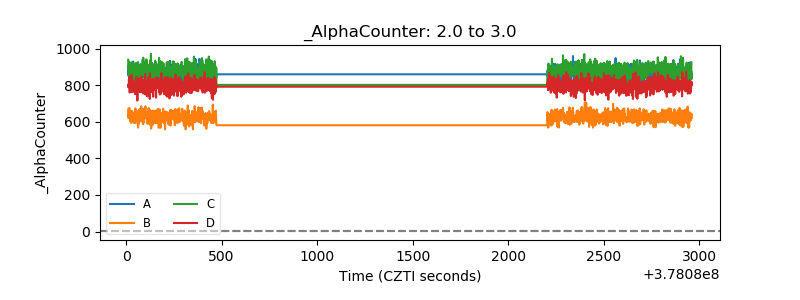 |
| _CPM_Rate | 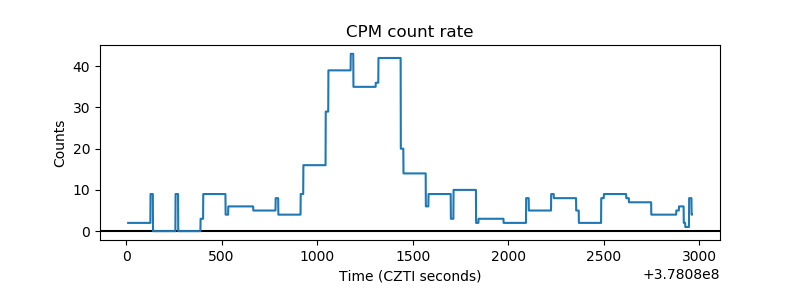 |
| CZT Counter | 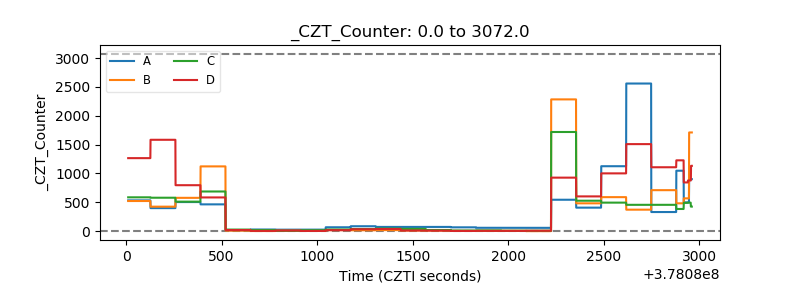 |
| +2.5 Volts monitor | 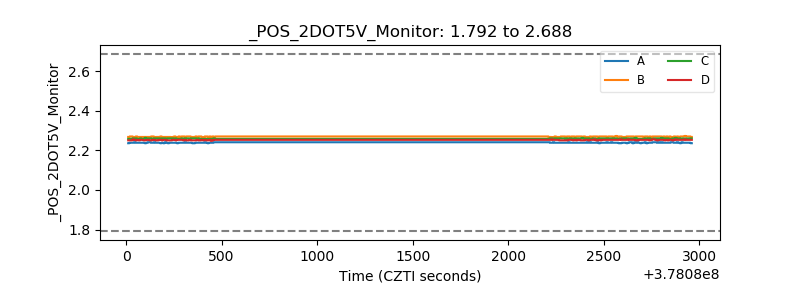 |
| +5 Volts monitor | 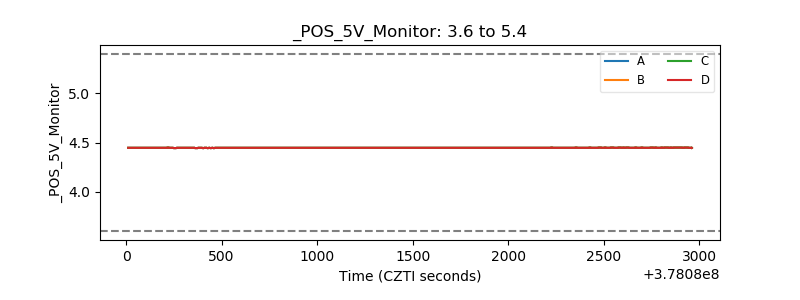 |
| _ROLL_ROT | 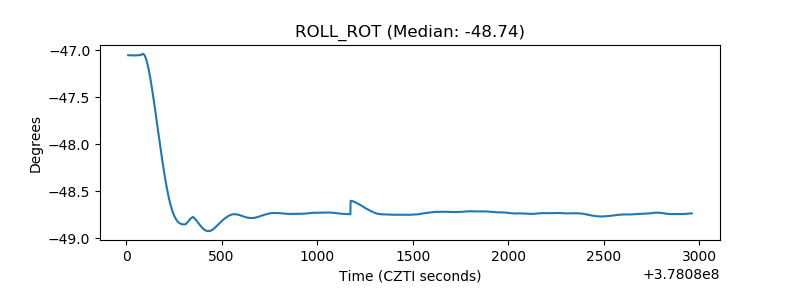 |
| _Roll_DEC | 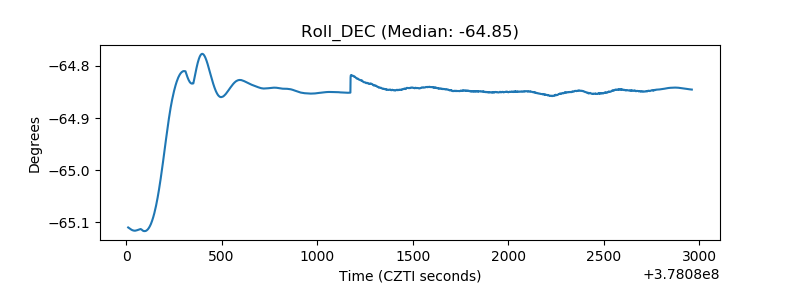 |
| _Roll_RA | 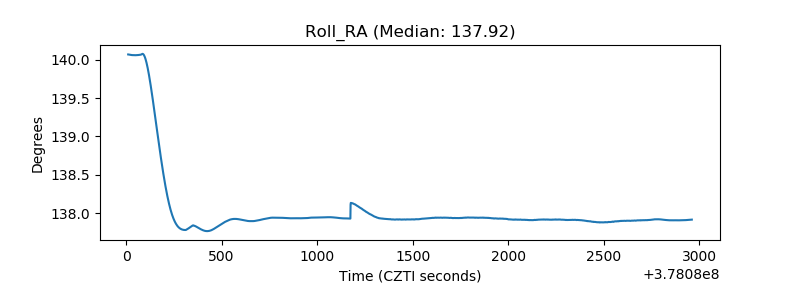 |
| Veto Counter | 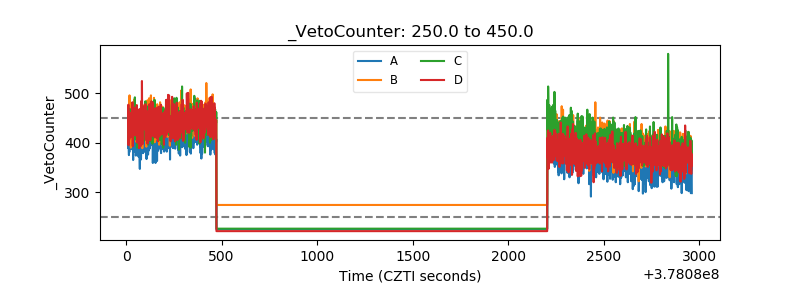 |