| Param | Original file | Final file |
|---|---|---|
| Filename | modeM0/AS1A11_097T08_9000004874_34115cztM0_level2.evt | modeM0/AS1A11_097T08_9000004874_34115cztM0_level2_quad_clean.evt |
| Size (bytes) | 627,200,640 | 114,937,920 |
| Size | 598.1 MB | 109.6 MB |
| Events in quadrant A | 3,411,125 | 762,772 |
| Events in quadrant B | 4,043,601 | 777,837 |
| Events in quadrant C | 4,561,290 | 748,556 |
| Events in quadrant D | 6,498,974 | 697,653 |
| Mode M9 | |||
|---|---|---|---|
| Quadrant | BADHDUFLAG | Total packets | Discarded packets |
| A | 0 | 34 | 0 |
| B | 0 | 34 | 0 |
| C | 0 | 34 | 0 |
| D | 0 | 34 | 0 |
| Mode M0 | |||
|---|---|---|---|
| Quadrant | BADHDUFLAG | Total packets | Discarded packets |
| A | 0 | 14703 | 4 |
| B | 0 | 16670 | 2 |
| C | 0 | 17888 | 2 |
| D | 0 | 24148 | 2 |
| Mode SS | |||
|---|---|---|---|
| Quadrant | BADHDUFLAG | Total packets | Discarded packets |
| A | 0 | 146 | 0 |
| B | 0 | 146 | 0 |
| C | 0 | 146 | 0 |
| D | 0 | 146 | 0 |
| Quadrant | Total seconds | Saturated seconds | Saturation percentage |
|---|---|---|---|
| A | 7094 | 23 | 0.324218% |
| B | 7094 | 66 | 0.930364% |
| C | 7094 | 241 | 3.397237% |
| D | 7094 | 504 | 7.104595% |
Noise dominated data is calculated using 1-second bins in cleaned event files. If a bin has >2000 counts, and if more than 50% of those come from <1% of pixels, then it is considered to be noise-dominated and hence unusable.
| Quadrant | # 1 sec bins | Bins with >0 counts | Bins with >2000 counts | High rate bins dominated by noise | Noise dominated (total time) | Noise dominated (detector-on time) | Marked lightcurve |
|---|---|---|---|---|---|---|---|
| A | 23090 | 7097 | 5 | 5 | 0.02% | 0.07% | 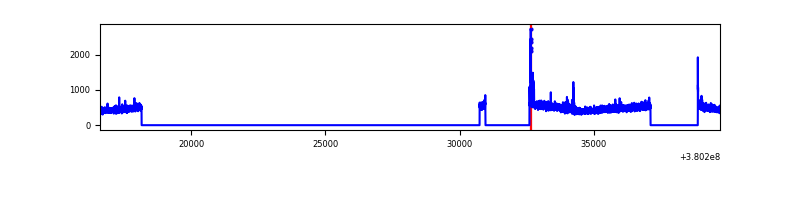 |
| B | 23090 | 7097 | 29 | 29 | 0.13% | 0.41% | 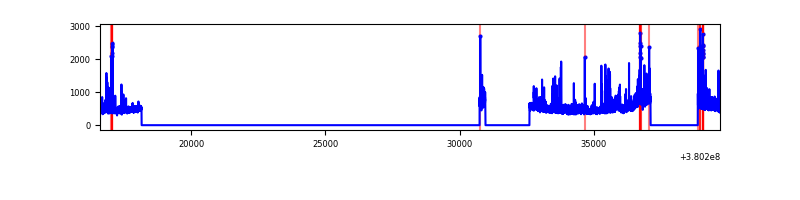 |
| C | 23090 | 7097 | 191 | 191 | 0.83% | 2.69% | 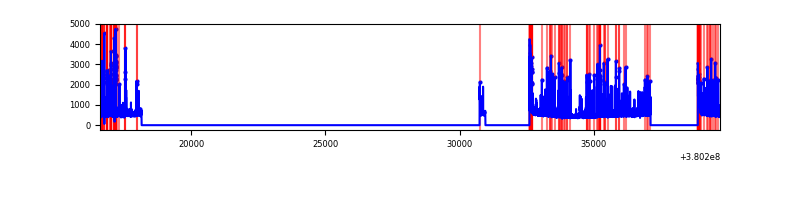 |
| D | 23090 | 7097 | 478 | 478 | 2.07% | 6.74% | 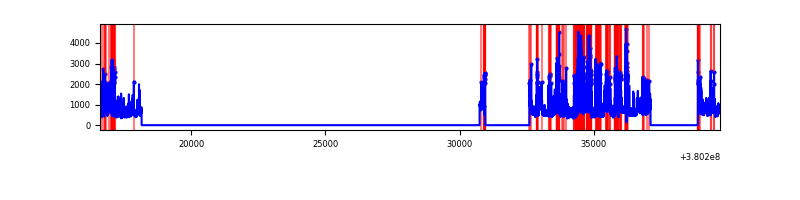 |
Top three noisy pixels from each quadrant. If the there are fewer than three noisy pixels in the level2.evt file, extra rows are filled as -1
| Pixel properties | Quadrant properties | ||||||
|---|---|---|---|---|---|---|---|
| Quadrant | DetID | PixID | Counts | Sigma | Mean | Median | Sigma |
| A | 15 | 169 | 154380 | 918.69 | 832 | 815 | 167.2 |
| A | 10 | 83 | 21375 | 123.0 | 832 | 815 | 167.2 |
| A | 13 | 254 | 11890 | 66.26 | 832 | 815 | 167.2 |
| B | 5 | 172 | 266952 | 1673.53 | 830 | 808 | 159.0 |
| B | 0 | 189 | 142368 | 890.14 | 830 | 808 | 159.0 |
| B | 0 | 219 | 101968 | 636.1 | 830 | 808 | 159.0 |
| C | 0 | 10 | 735511 | 3956.25 | 799 | 806 | 185.7 |
| C | 14 | 254 | 329567 | 1770.32 | 799 | 806 | 185.7 |
| C | 15 | 214 | 303734 | 1631.21 | 799 | 806 | 185.7 |
| D | 8 | 195 | 1198812 | 6299.65 | 782 | 761 | 190.2 |
| D | 2 | 250 | 1005403 | 5282.66 | 782 | 761 | 190.2 |
| D | 10 | 118 | 361378 | 1896.21 | 782 | 761 | 190.2 |
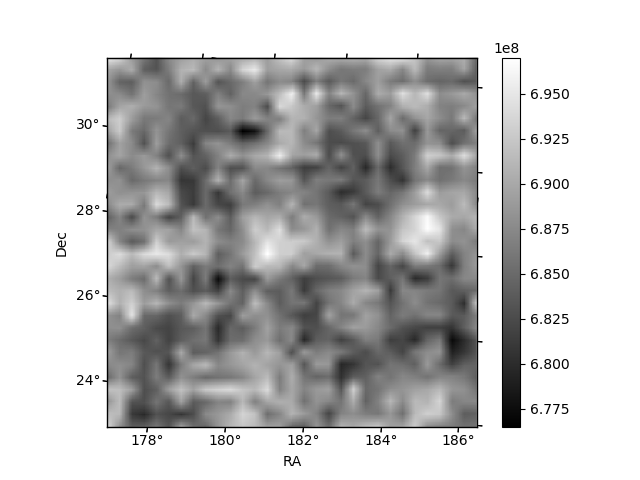
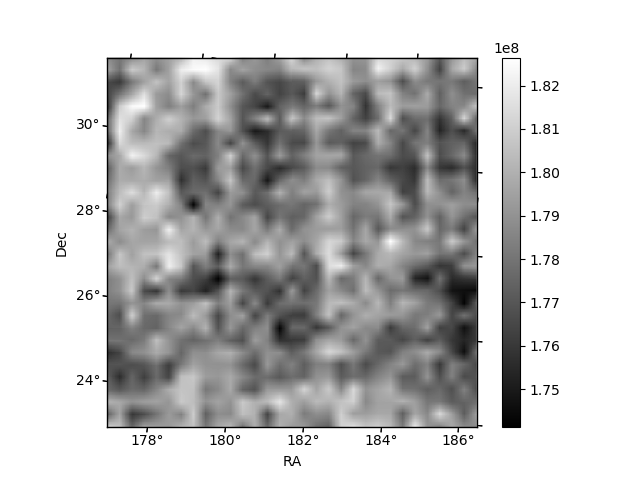
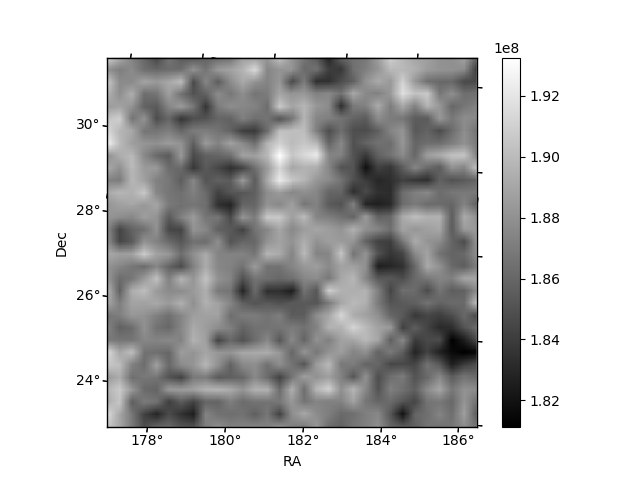
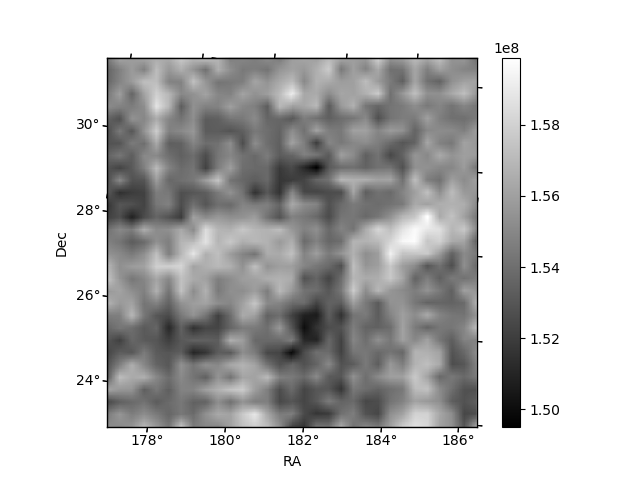
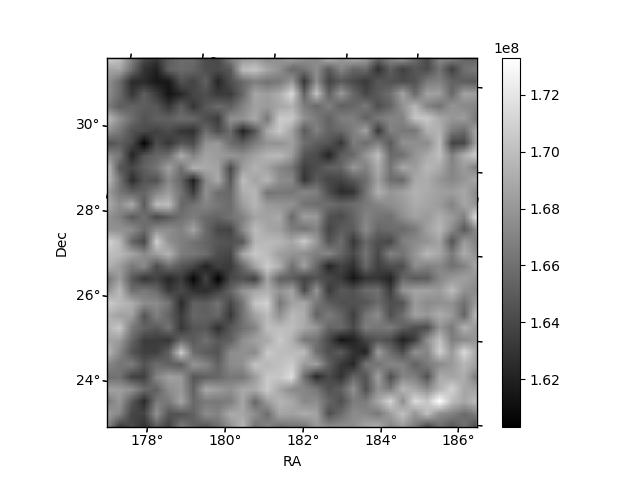
Histogram calculated using DETX and DETY for each event in the final _common_clean file
| Quadrant A | 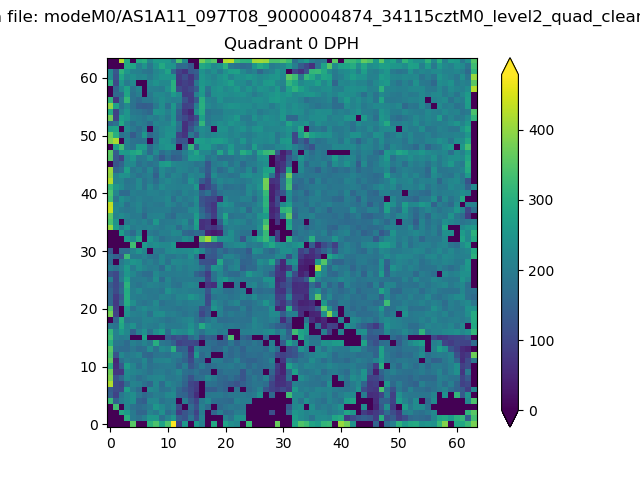 |
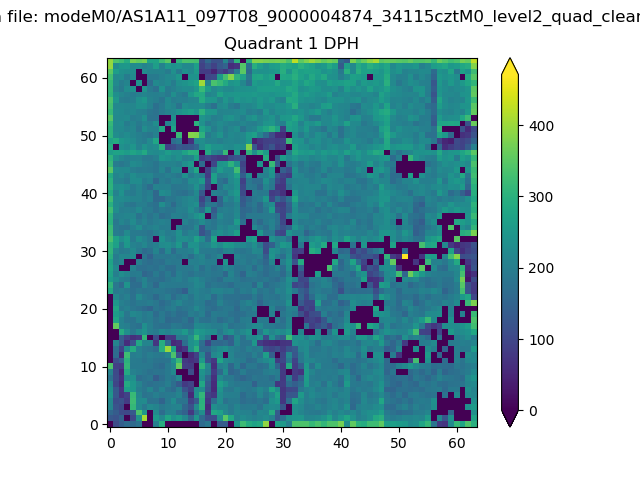 |
Quadrant B |
|---|---|---|---|
| Quadrant D | 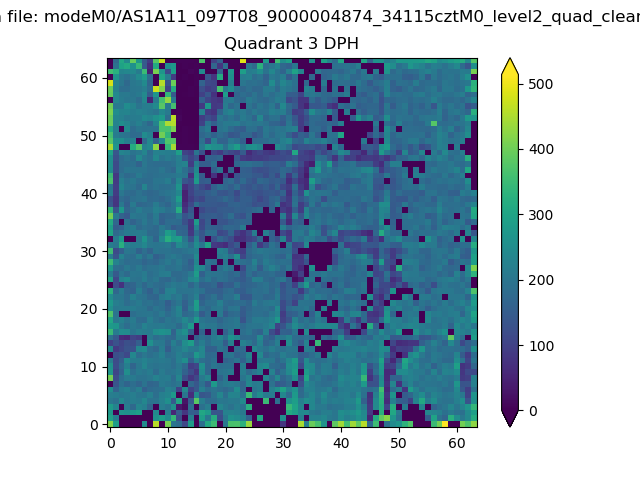 |
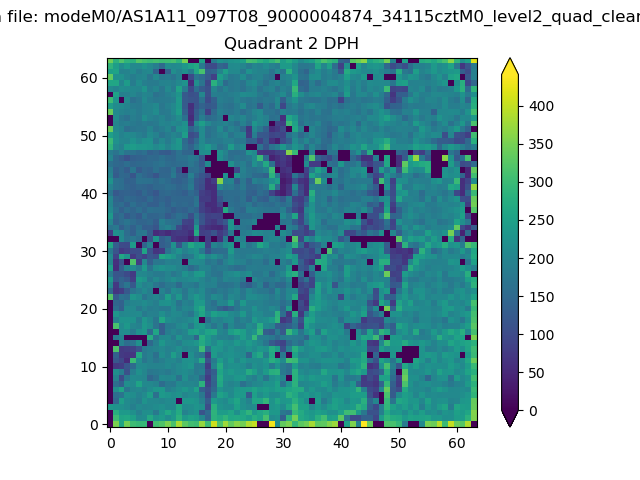 |
Quadrant C |
| Plot type | Count rate plots | Images |
|---|---|---|
| Comparison with Poisson distribution Blue bars denote a histogram of data divided into 1 sec bins. Red curve is a Poisson curve with rate = median count rate of data. |
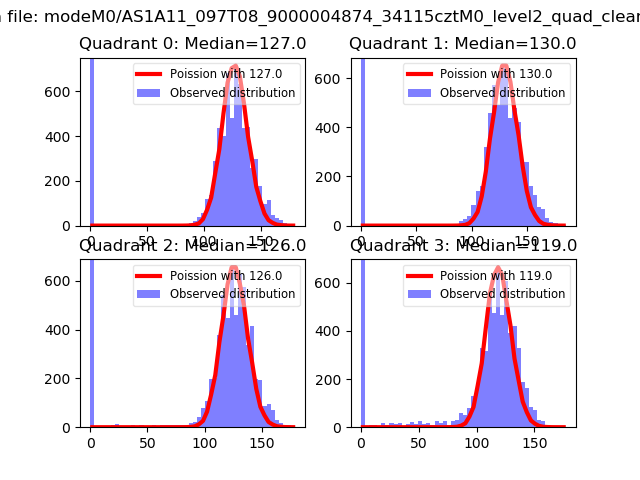 |
 |
| Quadrant-wise count rates Data is divided into 100 sec bins |
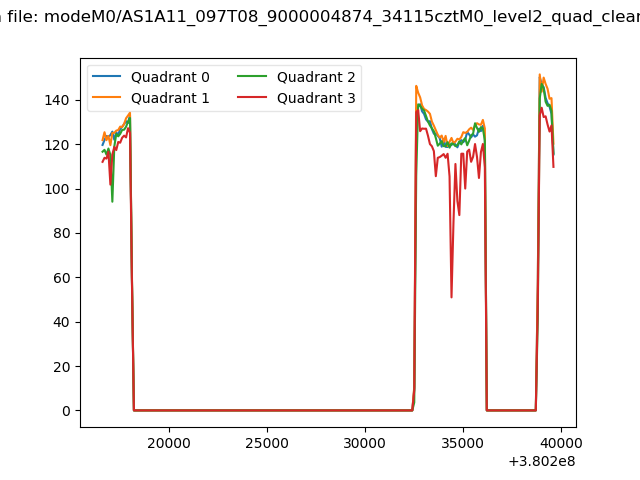 |
|
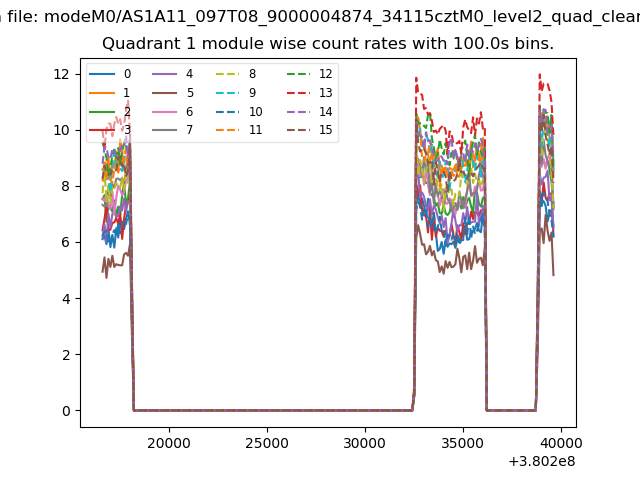
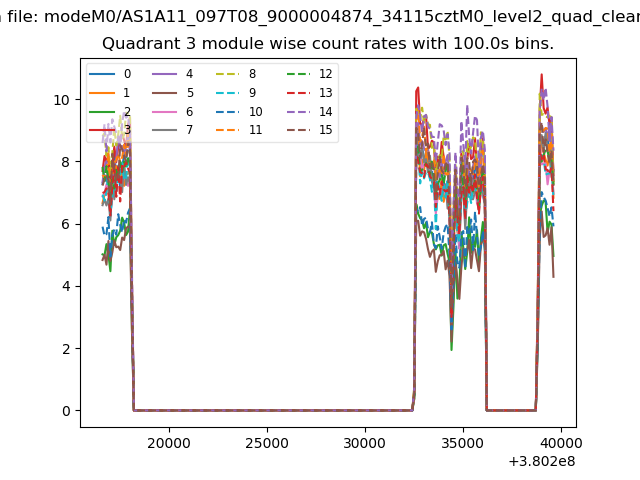
| Module-wise count rates for Quadrant A Data is divided into 100 sec bins |
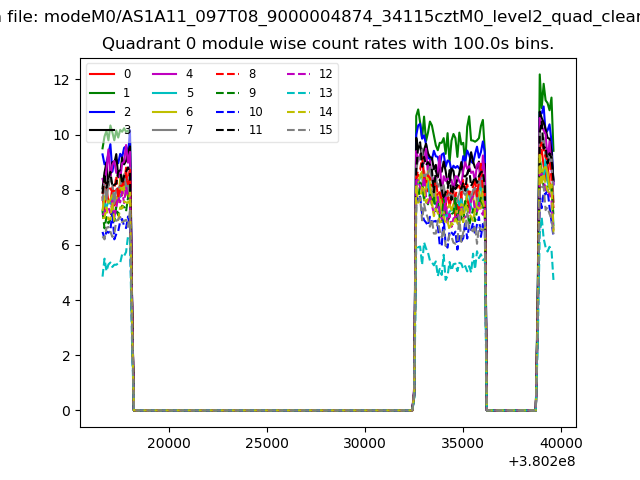 |
 |
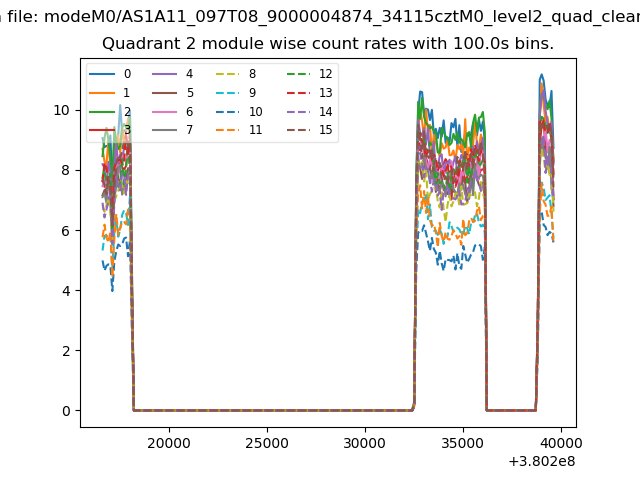
| Module-wise count rates for Quadrant B Data is divided into 100 sec bins |
 |
 |
| Module-wise count rates for Quadrant C Data is divided into 100 sec bins |
 |
 |
| Module-wise count rates for Quadrant D Data is divided into 100 sec bins |
 |
 |
| Parameter | Plot |
|---|---|
| CZT HV Monitor | 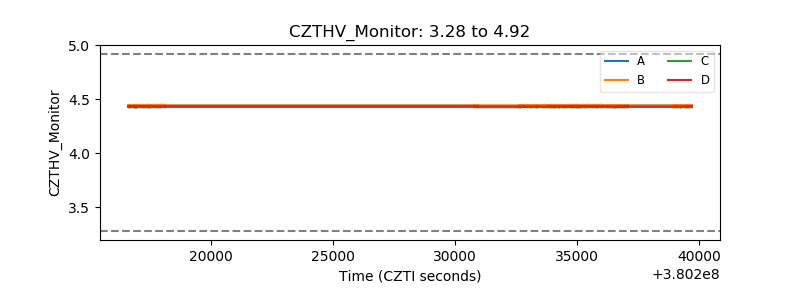 |
| D_VDD | 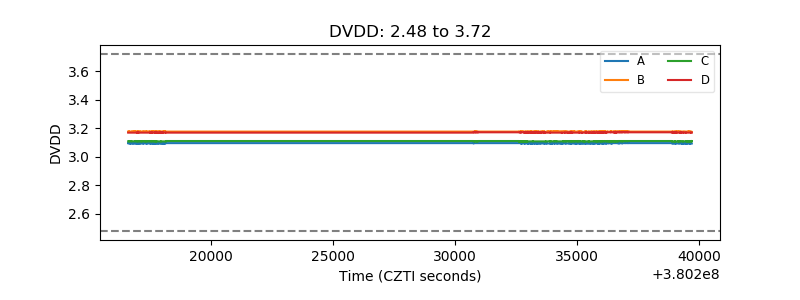 |
| Temperature 1 | 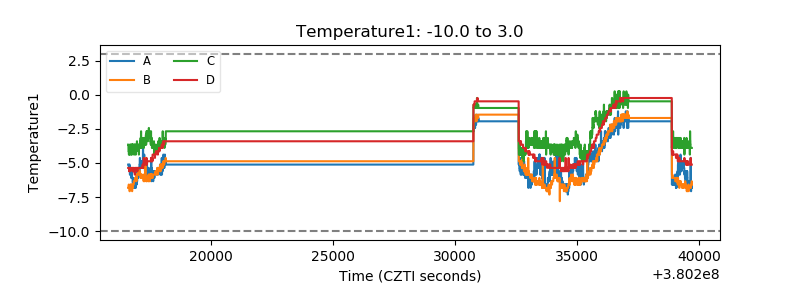 |
| Veto HV Monitor | 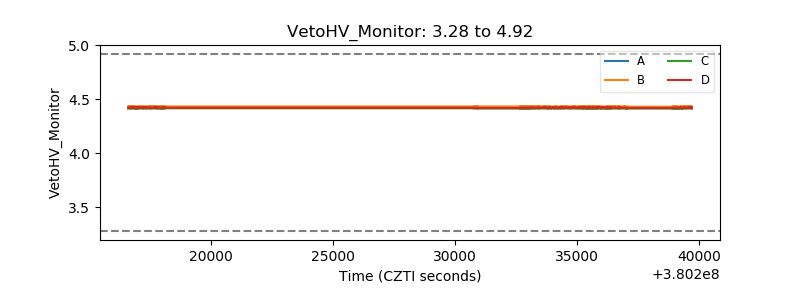 |
| Veto LLD | 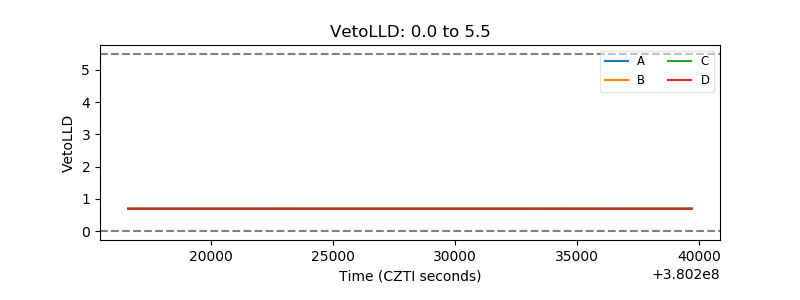 |
| Alpha Counter | 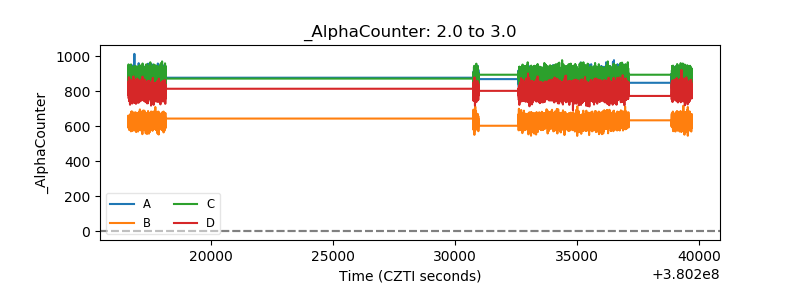 |
| _CPM_Rate | 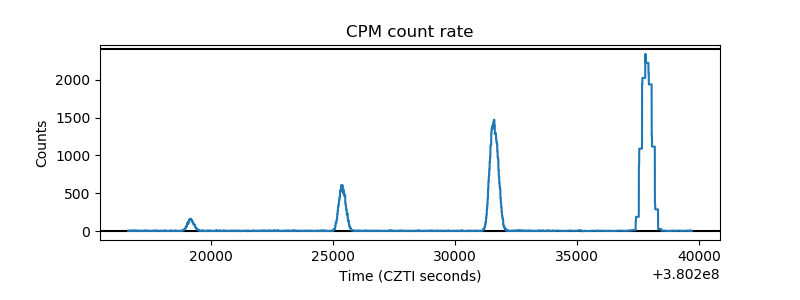 |
| CZT Counter | 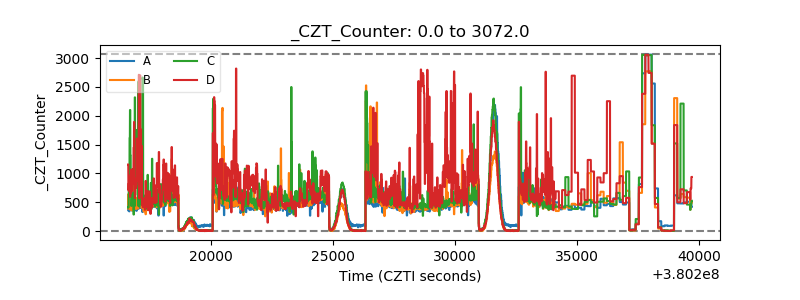 |
| +2.5 Volts monitor | 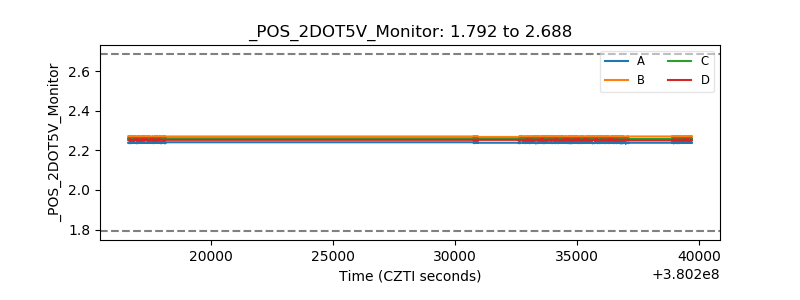 |
| +5 Volts monitor | 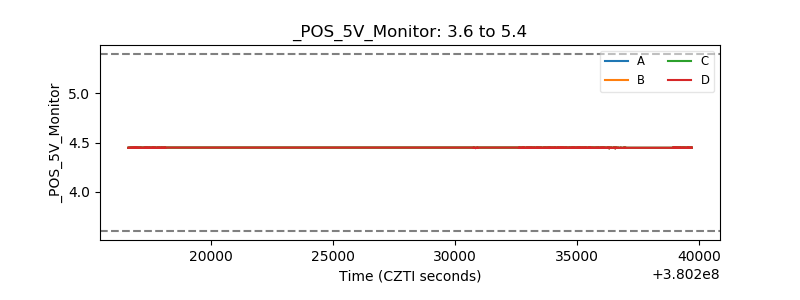 |
| _ROLL_ROT | 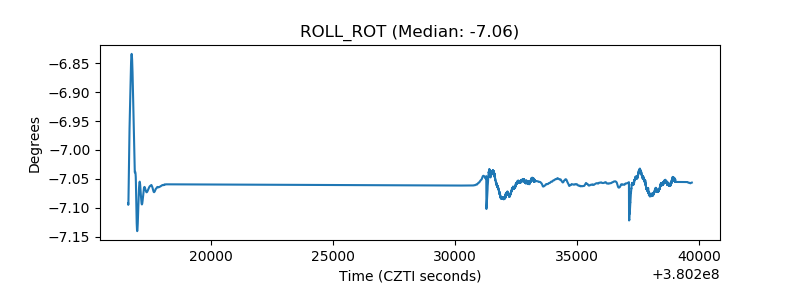 |
| _Roll_DEC | 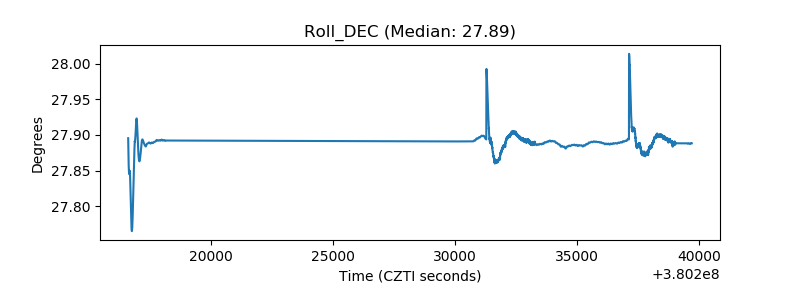 |
| _Roll_RA | 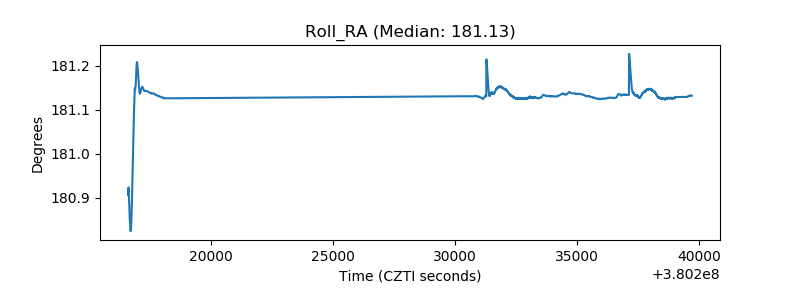 |
| Veto Counter | 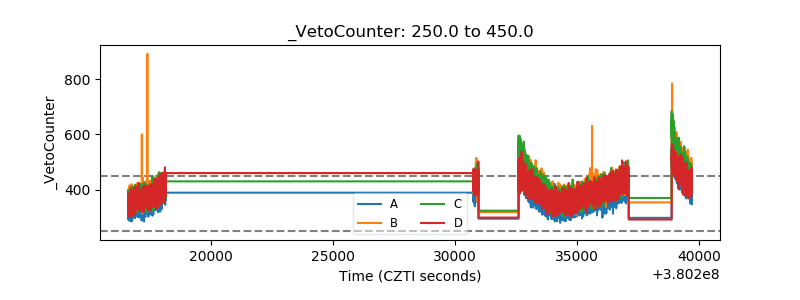 |