| Param | Original file | Final file |
|---|---|---|
| Filename | modeM0/AS1C07_005T01_9000004992_34829cztM0_level2.evt | modeM0/AS1C07_005T01_9000004992_34829cztM0_level2_quad_clean.evt |
| Size (bytes) | 795,954,240 | 84,283,200 |
| Size | 759.1 MB | 80.4 MB |
| Events in quadrant A | 2,566,697 | 671,460 |
| Events in quadrant B | 11,131,446 | 342,162 |
| Events in quadrant C | 2,789,222 | 673,568 |
| Events in quadrant D | 7,284,132 | 515,635 |
| Mode M9 | |||
|---|---|---|---|
| Quadrant | BADHDUFLAG | Total packets | Discarded packets |
| A | 0 | 23 | 0 |
| B | 0 | 23 | 0 |
| C | 0 | 23 | 0 |
| D | 0 | 24 | 0 |
| Mode M0 | |||
|---|---|---|---|
| Quadrant | BADHDUFLAG | Total packets | Discarded packets |
| A | 0 | 10583 | 3 |
| B | 0 | 36371 | 2 |
| C | 0 | 10884 | 2 |
| D | 0 | 25067 | 2 |
| Mode SS | |||
|---|---|---|---|
| Quadrant | BADHDUFLAG | Total packets | Discarded packets |
| A | 0 | 100 | 0 |
| B | 0 | 100 | 0 |
| C | 0 | 100 | 0 |
| D | 0 | 100 | 0 |
| Quadrant | Total seconds | Saturated seconds | Saturation percentage |
|---|---|---|---|
| A | 4951 | 10 | 0.201979% |
| B | 4951 | 4151 | 83.841648% |
| C | 4951 | 59 | 1.191678% |
| D | 4951 | 1773 | 35.810947% |
Noise dominated data is calculated using 1-second bins in cleaned event files. If a bin has >2000 counts, and if more than 50% of those come from <1% of pixels, then it is considered to be noise-dominated and hence unusable.
| Quadrant | # 1 sec bins | Bins with >0 counts | Bins with >2000 counts | High rate bins dominated by noise | Noise dominated (total time) | Noise dominated (detector-on time) | Marked lightcurve |
|---|---|---|---|---|---|---|---|
| A | 7074 | 4952 | 0 | 0 | 0.00% | 0.00% |  |
| B | 7073 | 4951 | 4069 | 4069 | 57.53% | 82.19% | 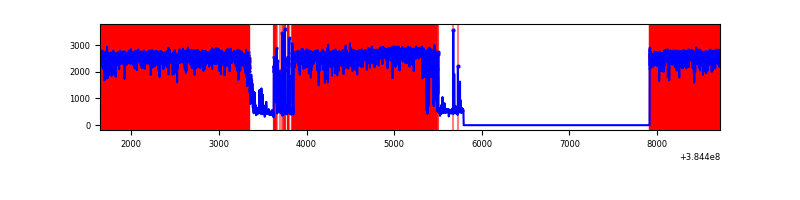 |
| C | 7074 | 4952 | 42 | 42 | 0.59% | 0.85% | 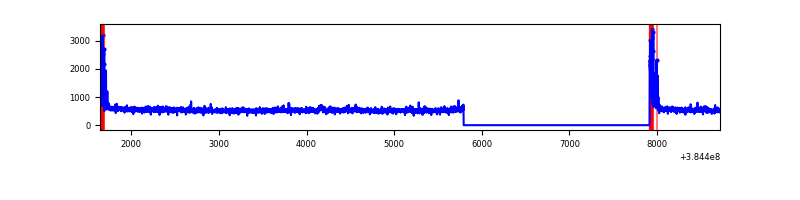 |
| D | 7074 | 4952 | 1645 | 1645 | 23.25% | 33.22% | 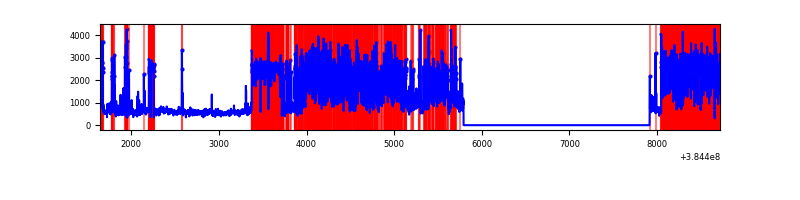 |
Top three noisy pixels from each quadrant. If the there are fewer than three noisy pixels in the level2.evt file, extra rows are filled as -1
| Pixel properties | Quadrant properties | ||||||
|---|---|---|---|---|---|---|---|
| Quadrant | DetID | PixID | Counts | Sigma | Mean | Median | Sigma |
| A | 15 | 169 | 120429 | 981.18 | 611 | 601 | 122.1 |
| A | 10 | 83 | 49893 | 403.61 | 611 | 601 | 122.1 |
| A | 7 | 3 | 15217 | 119.68 | 611 | 601 | 122.1 |
| B | 5 | 14 | 3130901 | 51332.93 | 324 | 316 | 61.0 |
| B | 5 | 31 | 3098346 | 50799.12 | 324 | 316 | 61.0 |
| B | 5 | 15 | 3091947 | 50694.19 | 324 | 316 | 61.0 |
| C | 15 | 214 | 232023 | 1691.86 | 600 | 605 | 136.8 |
| C | 0 | 10 | 172544 | 1257.02 | 600 | 605 | 136.8 |
| C | 14 | 67 | 33835 | 242.94 | 600 | 605 | 136.8 |
| D | 14 | 52 | 4006180 | 31788.04 | 512 | 497 | 126.0 |
| D | 8 | 195 | 319963 | 2535.2 | 512 | 497 | 126.0 |
| D | 14 | 226 | 296681 | 2350.44 | 512 | 497 | 126.0 |
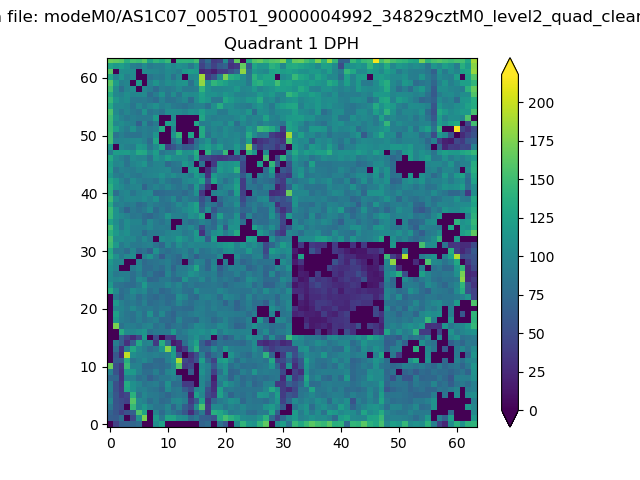
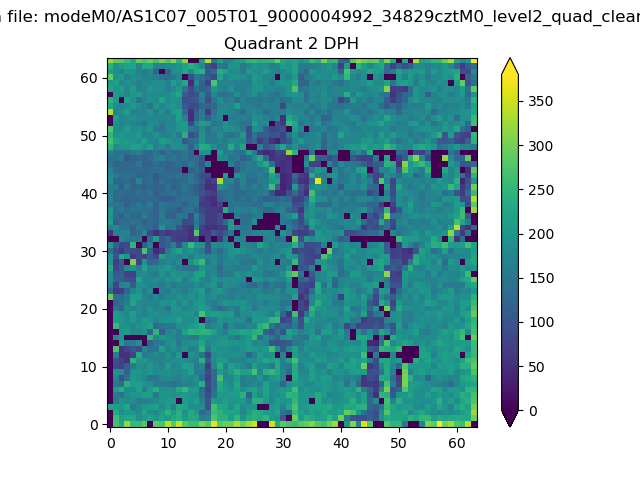
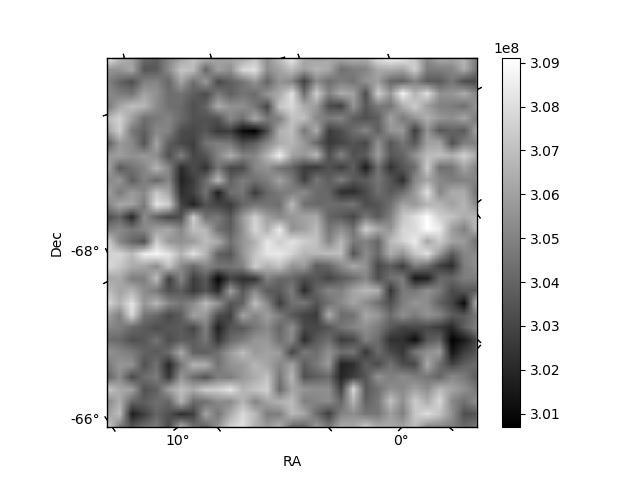
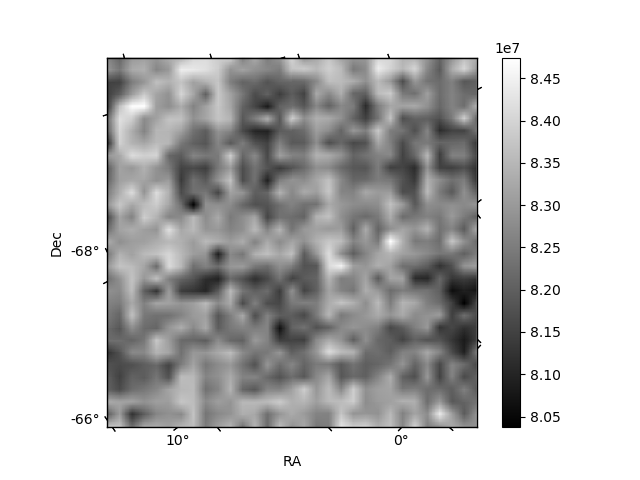
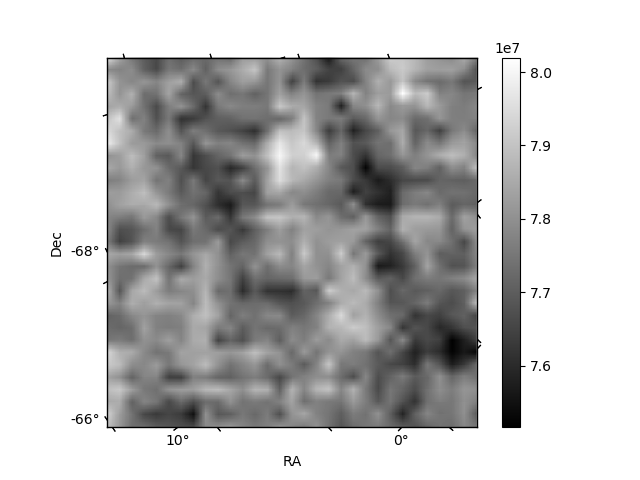
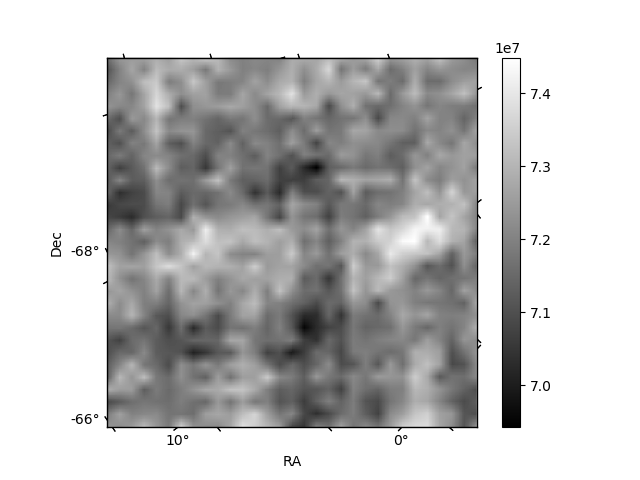
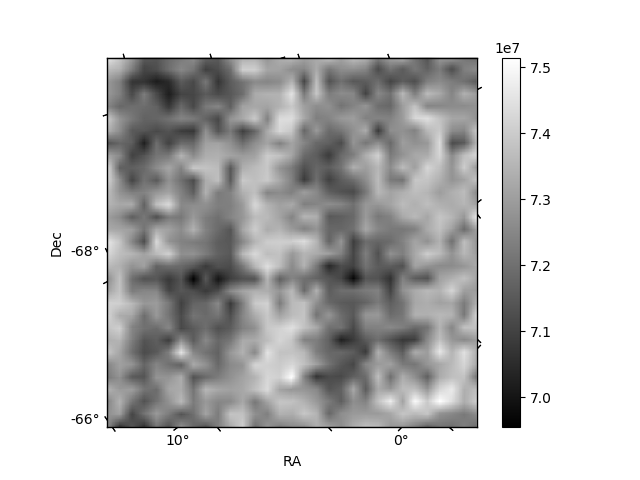
Histogram calculated using DETX and DETY for each event in the final _common_clean file
| Quadrant A | 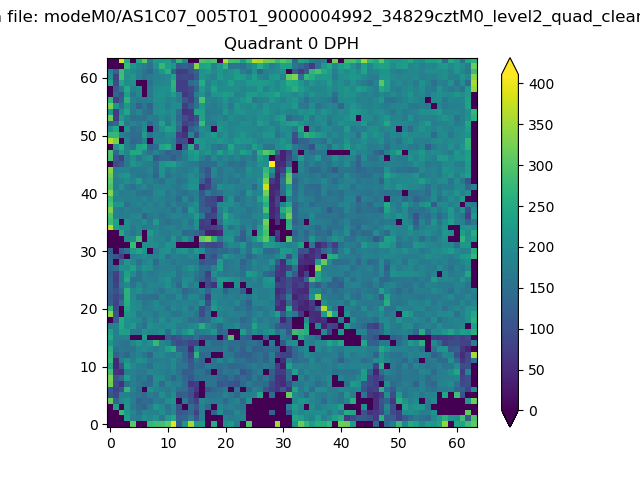 |
 |
Quadrant B |
|---|---|---|---|
| Quadrant D | 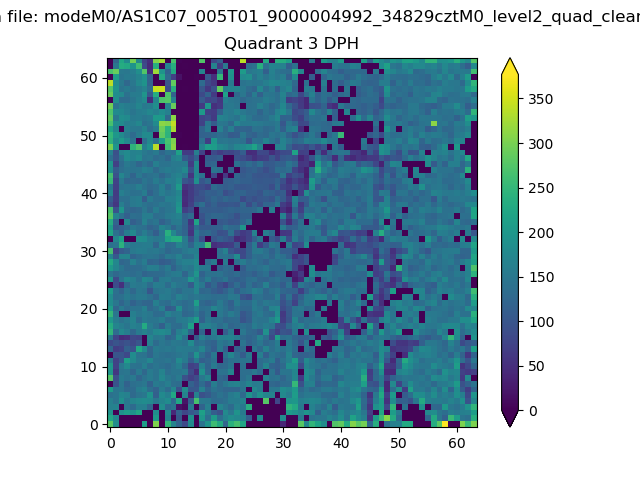 |
 |
Quadrant C |
| Plot type | Count rate plots | Images |
|---|---|---|
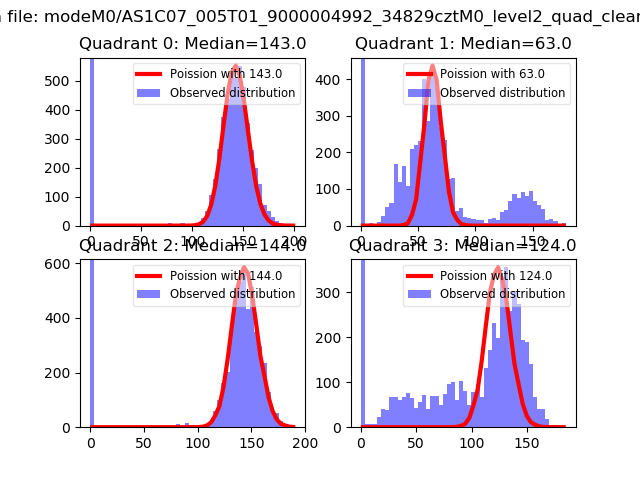
| Comparison with Poisson distribution Blue bars denote a histogram of data divided into 1 sec bins. Red curve is a Poisson curve with rate = median count rate of data. |
 |
 |
| Quadrant-wise count rates Data is divided into 100 sec bins |
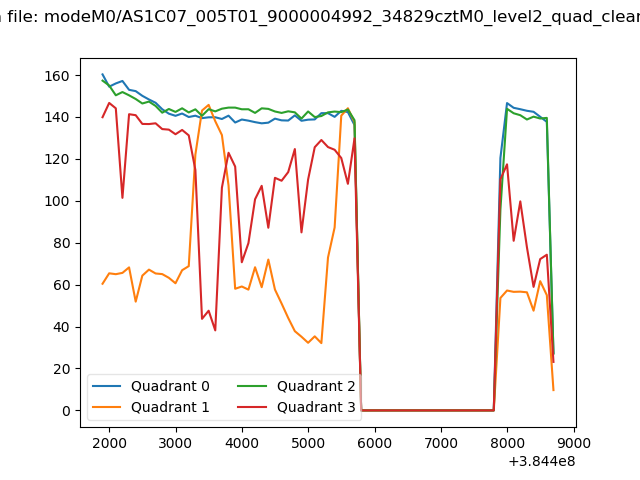 |
|
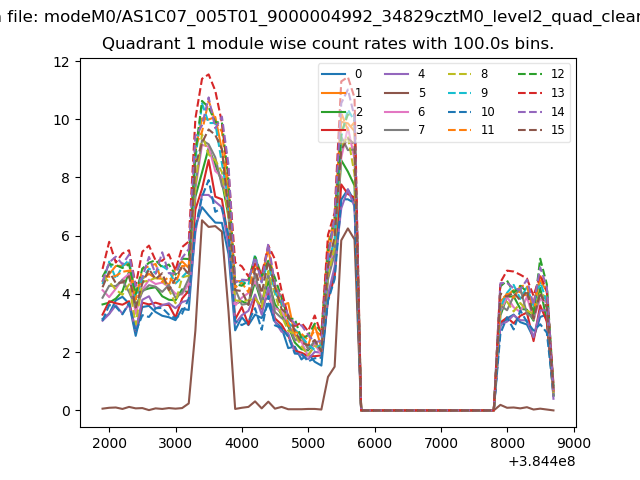
| Module-wise count rates for Quadrant A Data is divided into 100 sec bins |
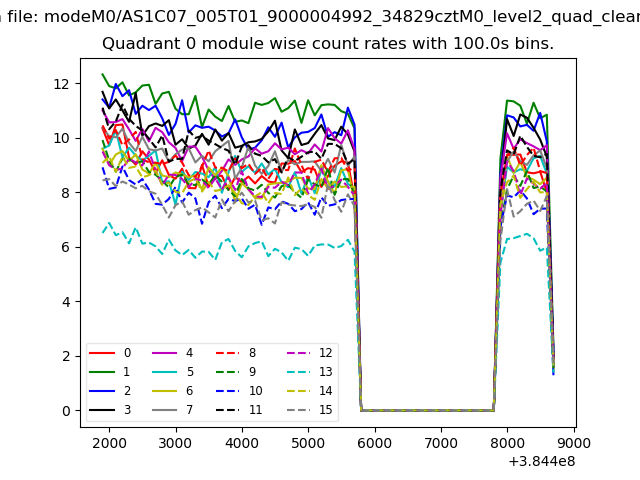 |
 |
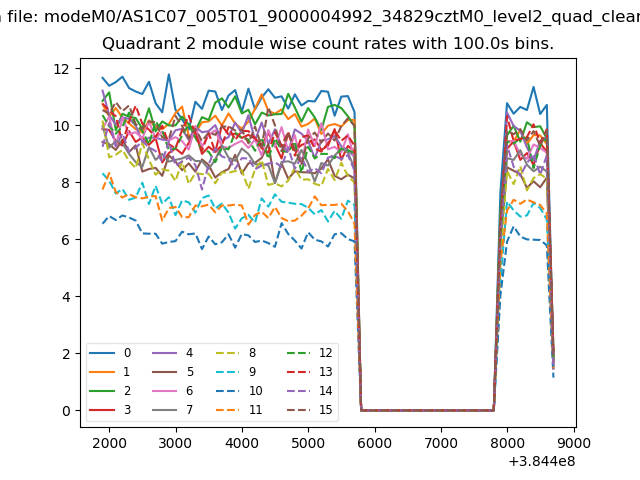
| Module-wise count rates for Quadrant B Data is divided into 100 sec bins |
 |
 |
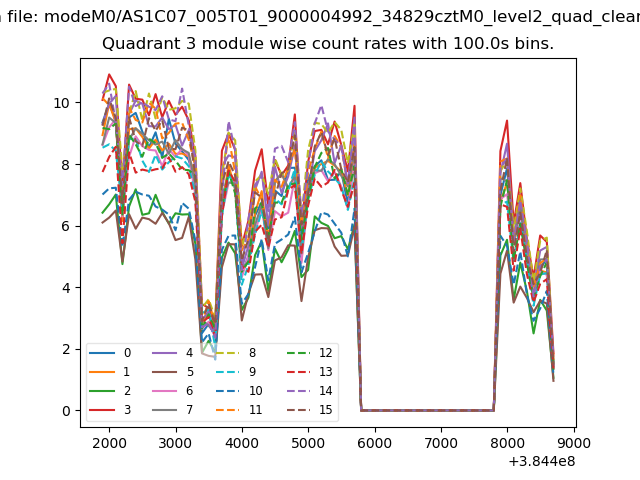
| Module-wise count rates for Quadrant C Data is divided into 100 sec bins |
 |
 |
| Module-wise count rates for Quadrant D Data is divided into 100 sec bins |
 |
 |
| Parameter | Plot |
|---|---|
| CZT HV Monitor | 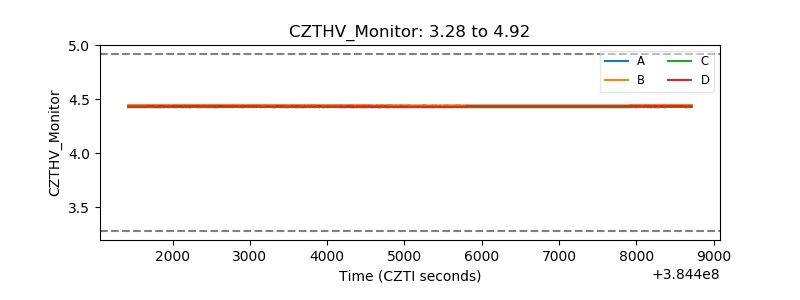 |
| D_VDD | 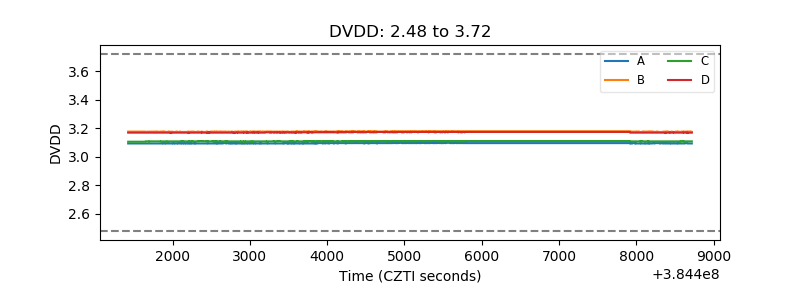 |
| Temperature 1 | 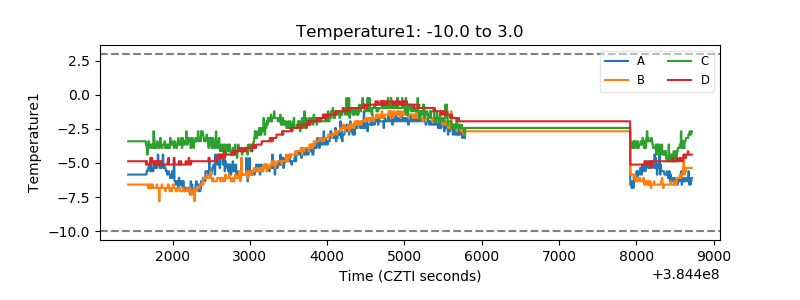 |
| Veto HV Monitor | 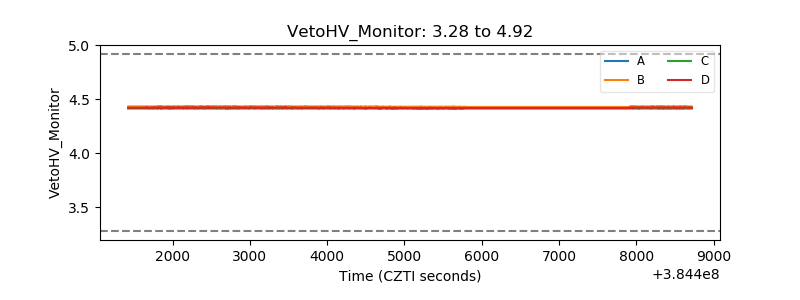 |
| Veto LLD | 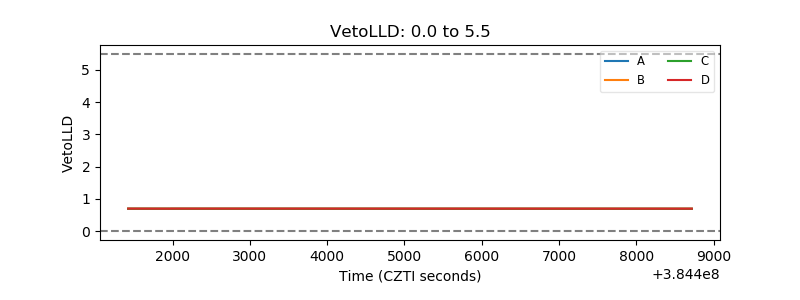 |
| Alpha Counter | 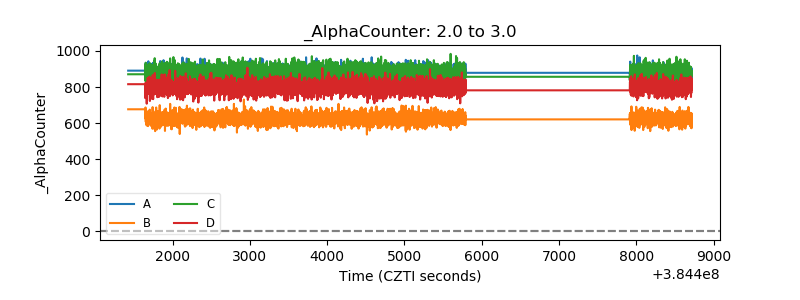 |
| _CPM_Rate | 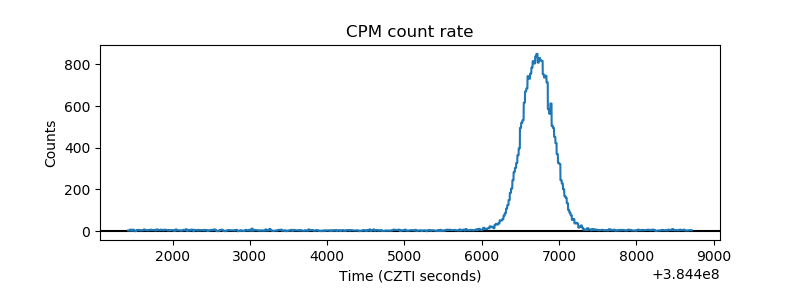 |
| CZT Counter | 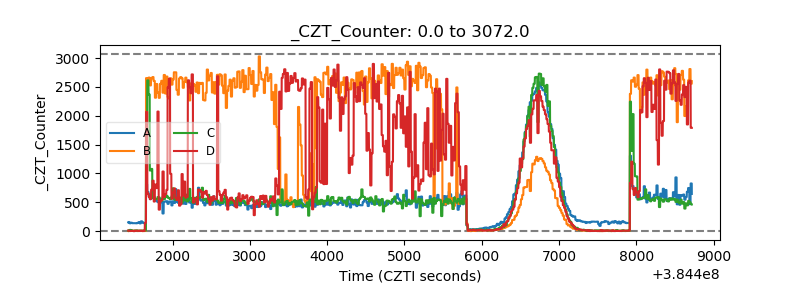 |
| +2.5 Volts monitor | 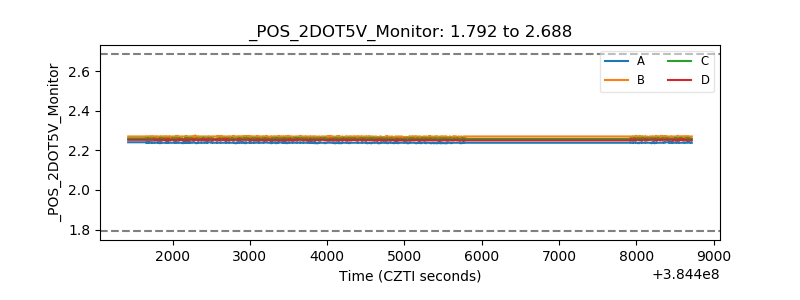 |
| +5 Volts monitor | 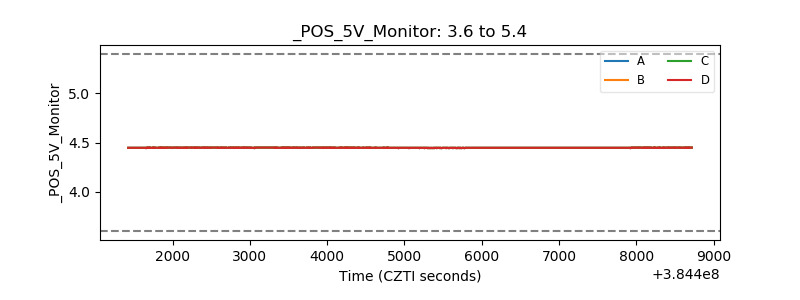 |
| _ROLL_ROT | 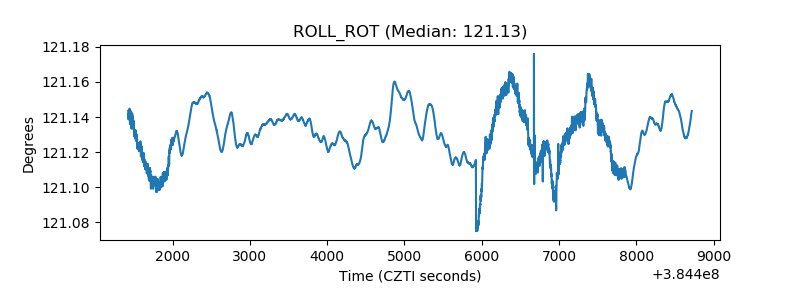 |
| _Roll_DEC | 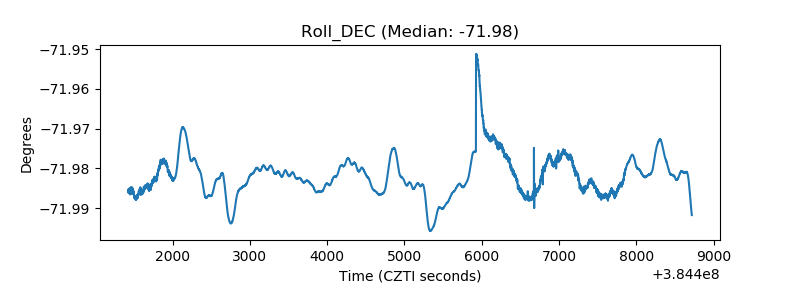 |
| _Roll_RA | 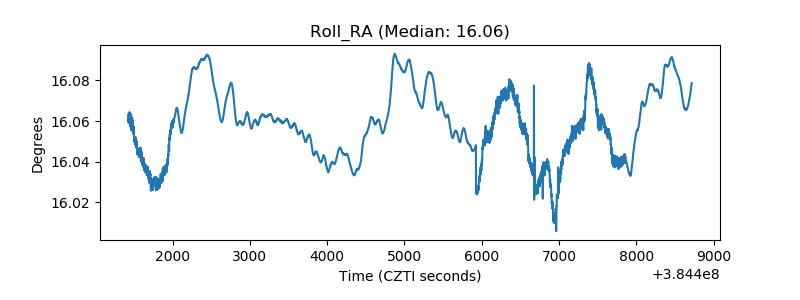 |
| Veto Counter | 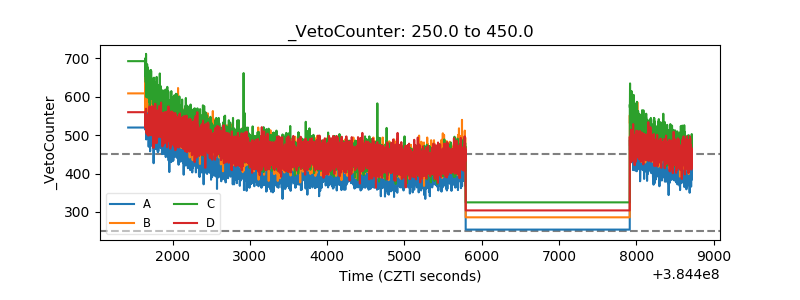 |