| Param | Original file | Final file |
|---|---|---|
| Filename | modeM0/AS1A11_080T01_9000005146_35898cztM0_level2.evt | modeM0/AS1A11_080T01_9000005146_35898cztM0_level2_quad_clean.evt |
| Size (bytes) | 507,839,040 | 75,761,280 |
| Size | 484.3 MB | 72.3 MB |
| Events in quadrant A | 3,083,355 | 495,667 |
| Events in quadrant B | 3,210,653 | 498,298 |
| Events in quadrant C | 3,055,284 | 475,680 |
| Events in quadrant D | 5,666,422 | 447,761 |
| Mode M9 | |||
|---|---|---|---|
| Quadrant | BADHDUFLAG | Total packets | Discarded packets |
| A | 0 | 22 | 0 |
| B | 0 | 22 | 0 |
| C | 0 | 22 | 0 |
| D | 0 | 23 | 0 |
| Mode SS | |||
|---|---|---|---|
| Quadrant | BADHDUFLAG | Total packets | Discarded packets |
| A | 0 | 110 | 0 |
| B | 0 | 110 | 0 |
| C | 0 | 110 | 0 |
| D | 0 | 110 | 0 |
| Mode M0 | |||
|---|---|---|---|
| Quadrant | BADHDUFLAG | Total packets | Discarded packets |
| A | 0 | 12233 | 3 |
| B | 0 | 12706 | 2 |
| C | 0 | 12029 | 2 |
| D | 0 | 20587 | 2 |
| Quadrant | Total seconds | Saturated seconds | Saturation percentage |
|---|---|---|---|
| A | 5378 | 41 | 0.762365% |
| B | 5378 | 54 | 1.004091% |
| C | 5378 | 72 | 1.338788% |
| D | 5378 | 431 | 8.014132% |
Noise dominated data is calculated using 1-second bins in cleaned event files. If a bin has >2000 counts, and if more than 50% of those come from <1% of pixels, then it is considered to be noise-dominated and hence unusable.
| Quadrant | # 1 sec bins | Bins with >0 counts | Bins with >2000 counts | High rate bins dominated by noise | Noise dominated (total time) | Noise dominated (detector-on time) | Marked lightcurve |
|---|---|---|---|---|---|---|---|
| A | 7380 | 5379 | 30 | 30 | 0.41% | 0.56% | 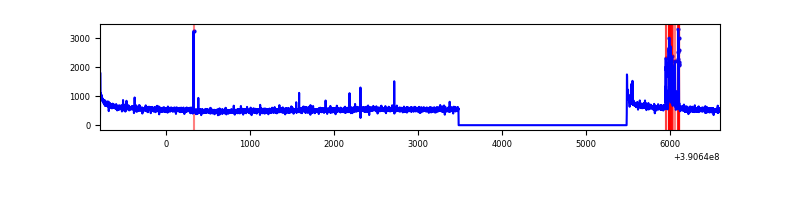 |
| B | 7380 | 5379 | 28 | 28 | 0.38% | 0.52% | 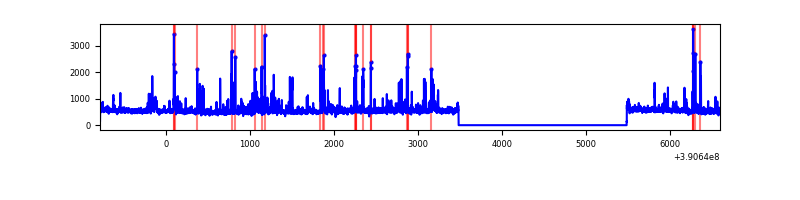 |
| C | 7380 | 5379 | 54 | 54 | 0.73% | 1.00% | 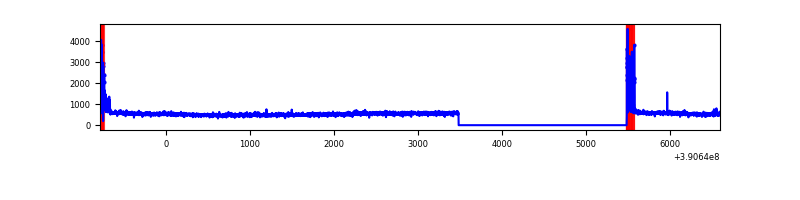 |
| D | 7380 | 5379 | 375 | 375 | 5.08% | 6.97% | 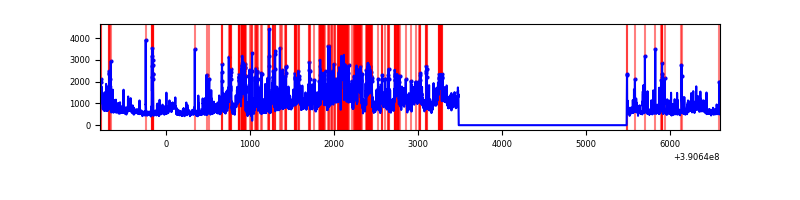 |
Top three noisy pixels from each quadrant. If the there are fewer than three noisy pixels in the level2.evt file, extra rows are filled as -1
| Pixel properties | Quadrant properties | ||||||
|---|---|---|---|---|---|---|---|
| Quadrant | DetID | PixID | Counts | Sigma | Mean | Median | Sigma |
| A | 10 | 83 | 163776 | 1143.73 | 716 | 707 | 142.6 |
| A | 15 | 169 | 124539 | 868.53 | 716 | 707 | 142.6 |
| A | 7 | 3 | 10580 | 69.25 | 716 | 707 | 142.6 |
| B | 5 | 172 | 213572 | 1619.79 | 696 | 681 | 131.4 |
| B | 5 | 255 | 115459 | 873.29 | 696 | 681 | 131.4 |
| B | 0 | 213 | 68688 | 517.43 | 696 | 681 | 131.4 |
| C | 15 | 214 | 228308 | 1477.91 | 670 | 679 | 154.0 |
| C | 0 | 10 | 205315 | 1328.63 | 670 | 679 | 154.0 |
| C | 0 | 207 | 8125 | 48.34 | 670 | 679 | 154.0 |
| D | 12 | 227 | 1835234 | 11350.4 | 670 | 655 | 161.6 |
| D | 8 | 195 | 352354 | 2175.93 | 670 | 655 | 161.6 |
| D | 2 | 250 | 271113 | 1673.3 | 670 | 655 | 161.6 |
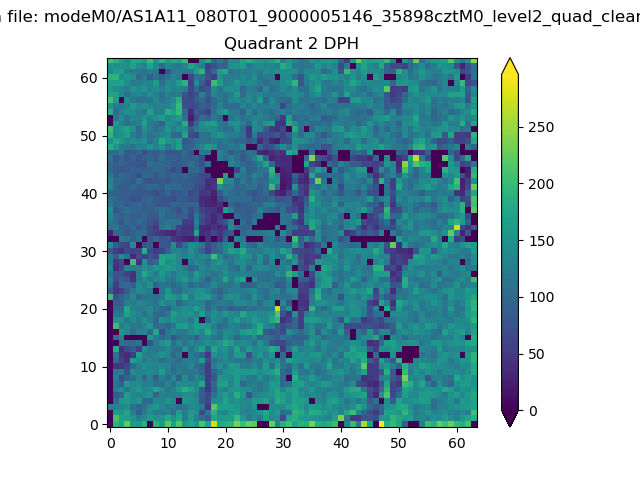
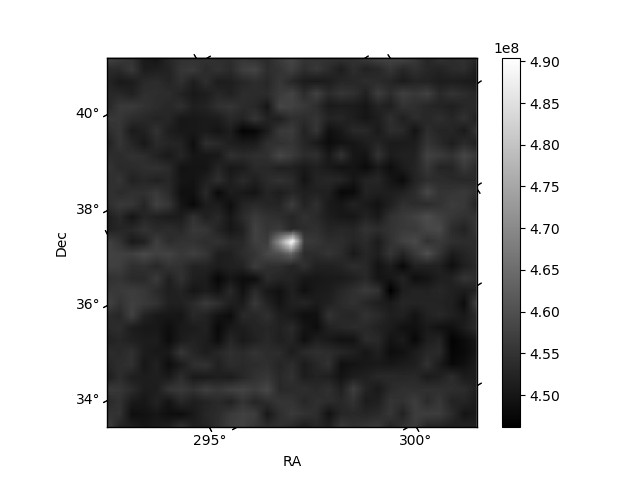
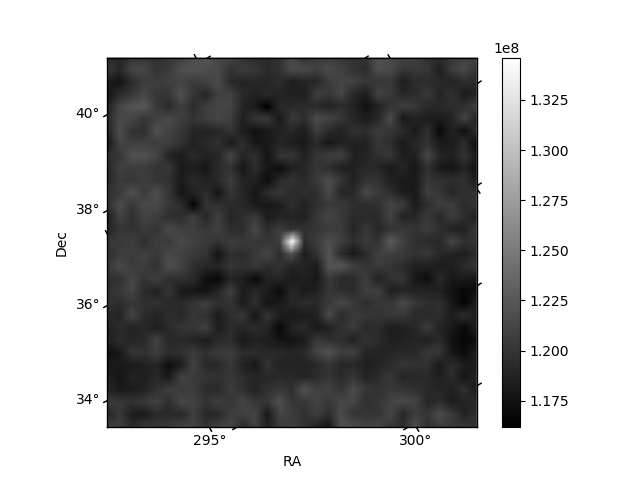
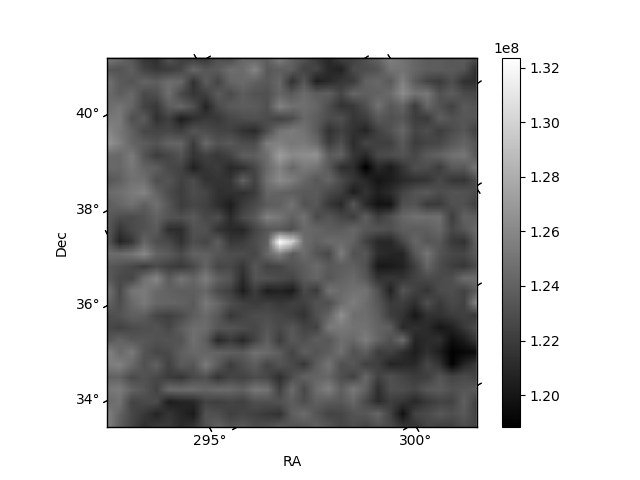
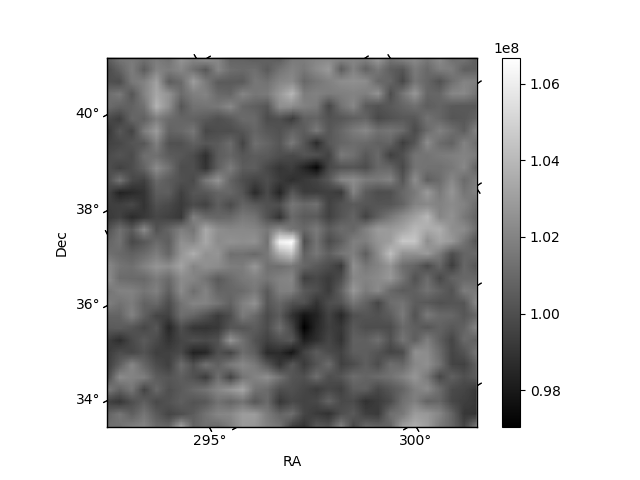
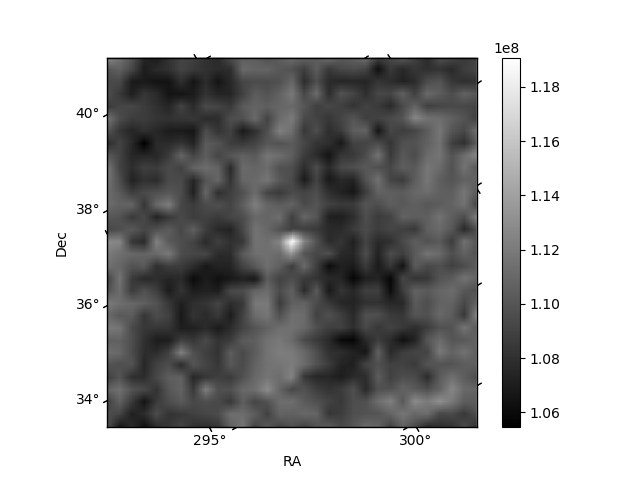
Histogram calculated using DETX and DETY for each event in the final _common_clean file
| Quadrant A | 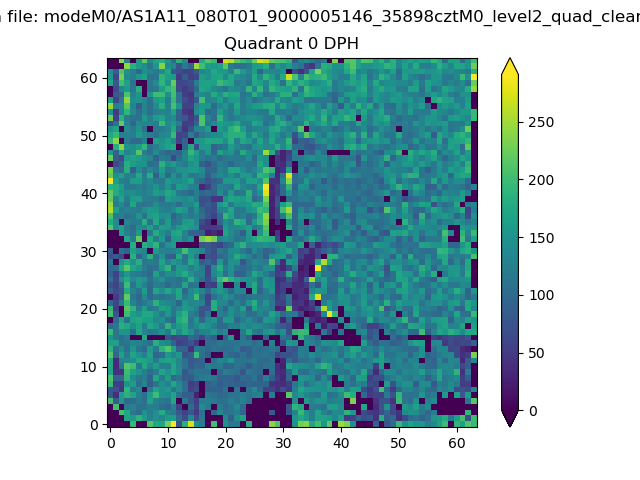 |
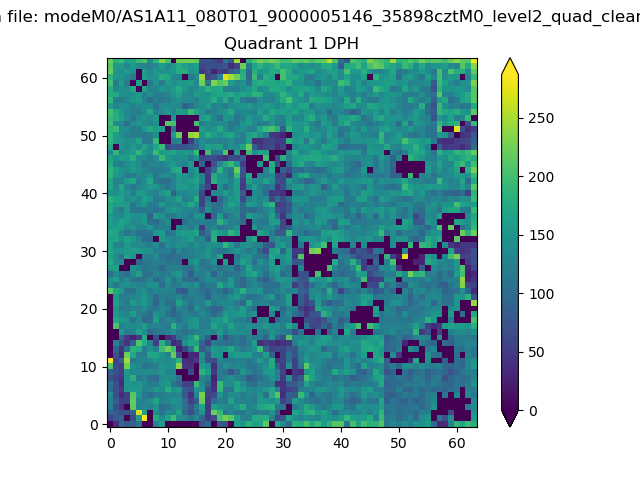 |
Quadrant B |
|---|---|---|---|
| Quadrant D | 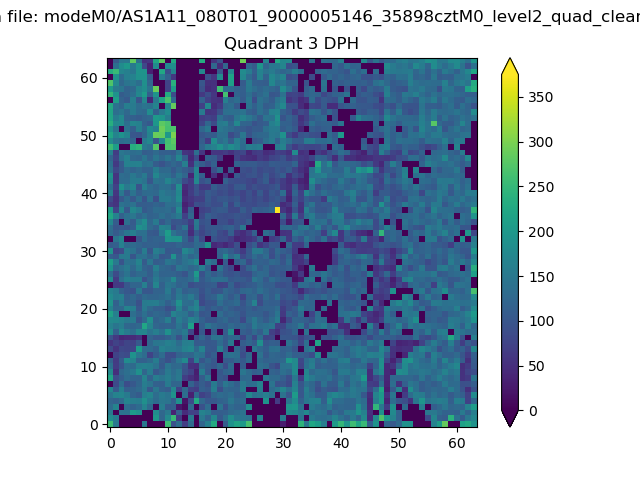 |
 |
Quadrant C |
| Plot type | Count rate plots | Images |
|---|---|---|
| Comparison with Poisson distribution Blue bars denote a histogram of data divided into 1 sec bins. Red curve is a Poisson curve with rate = median count rate of data. |
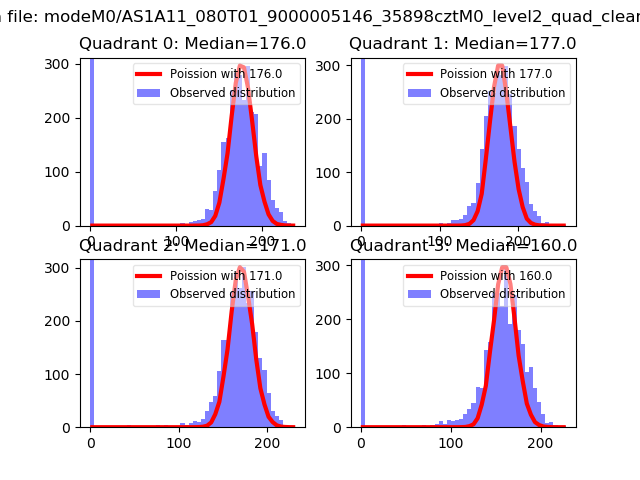 |
 |
| Quadrant-wise count rates Data is divided into 100 sec bins |
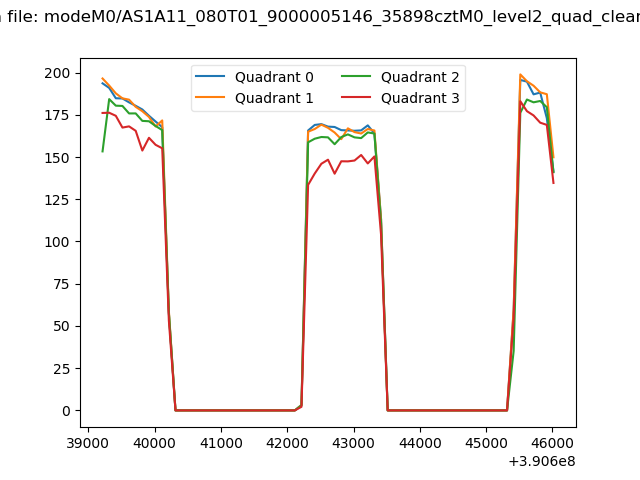 |
|
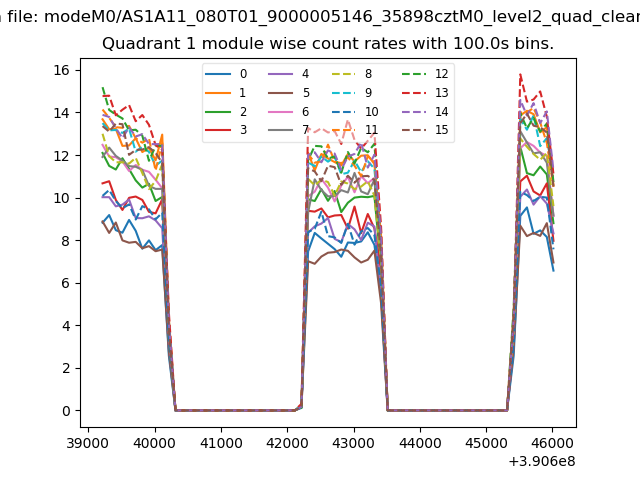
| Module-wise count rates for Quadrant A Data is divided into 100 sec bins |
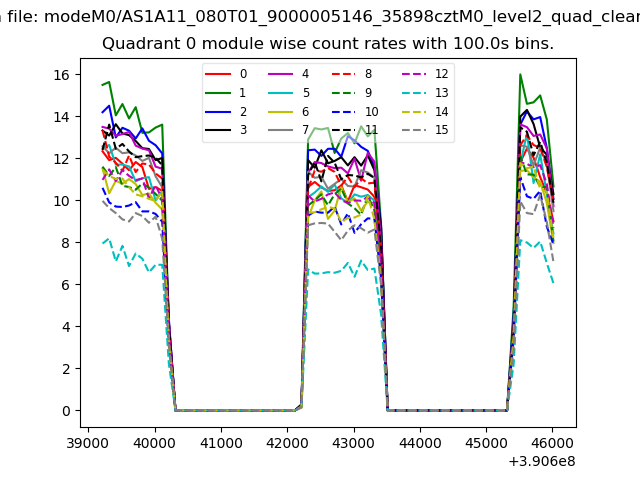 |
 |
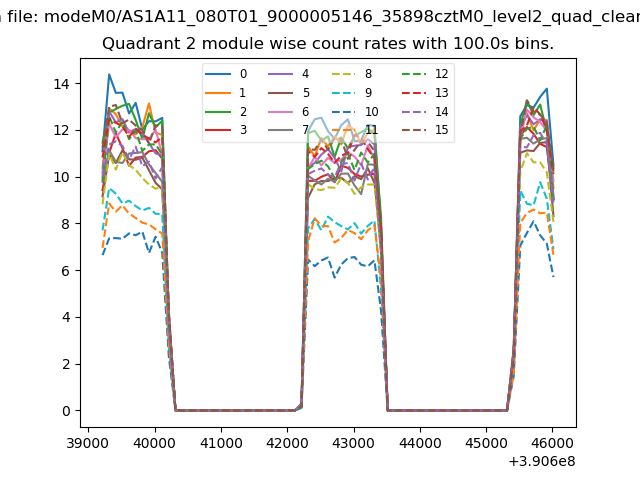
| Module-wise count rates for Quadrant B Data is divided into 100 sec bins |
 |
 |
| Module-wise count rates for Quadrant C Data is divided into 100 sec bins |
 |
 |
| Module-wise count rates for Quadrant D Data is divided into 100 sec bins |
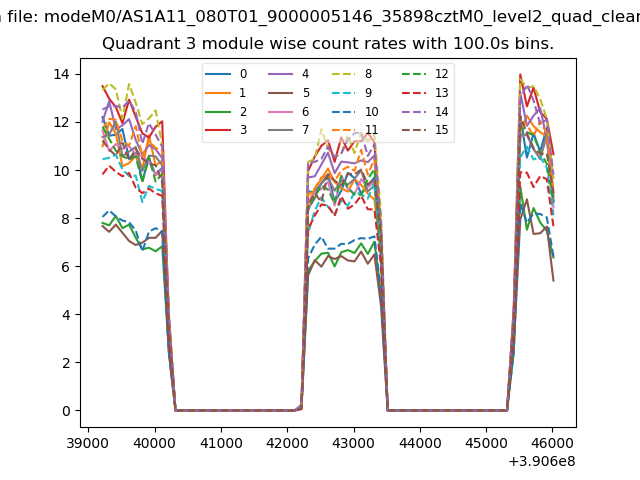 |
 |
| Parameter | Plot |
|---|---|
| CZT HV Monitor | 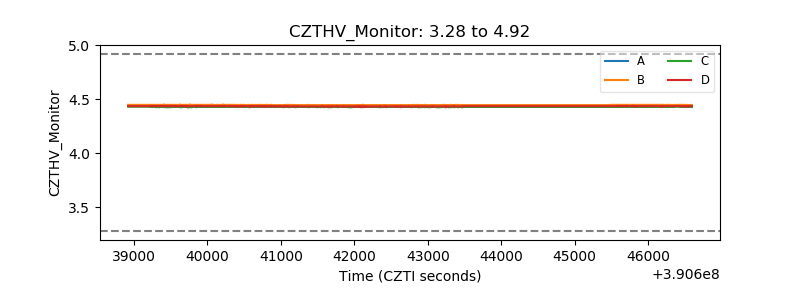 |
| D_VDD | 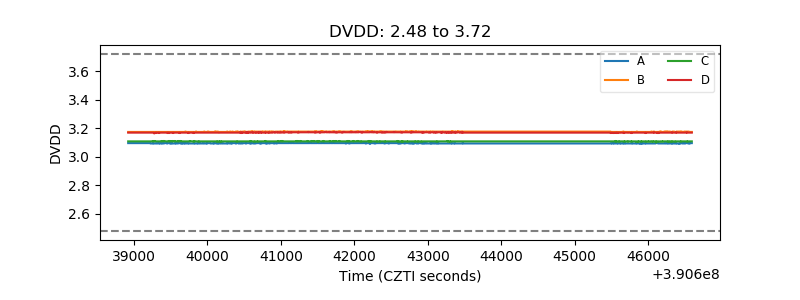 |
| Temperature 1 | 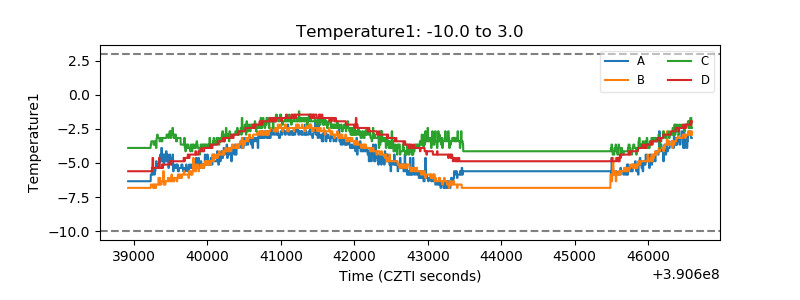 |
| Veto HV Monitor | 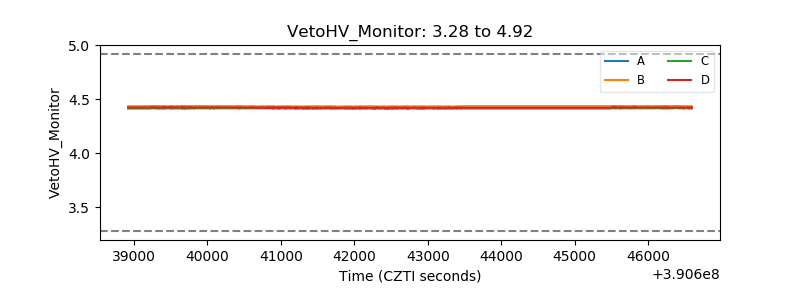 |
| Veto LLD | 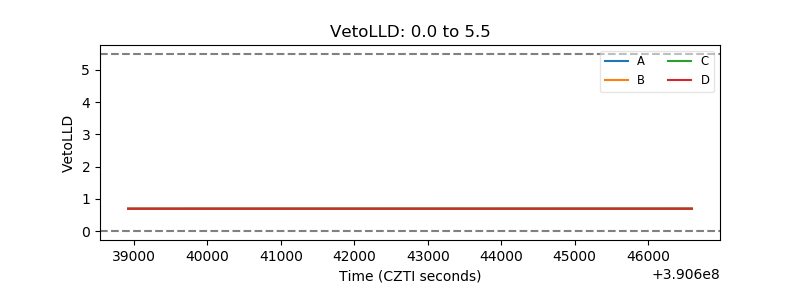 |
| Alpha Counter | 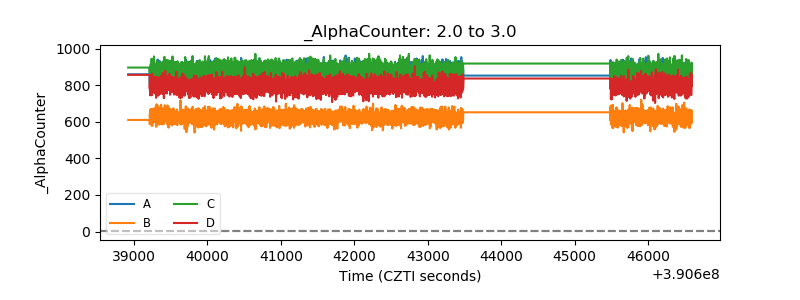 |
| _CPM_Rate | 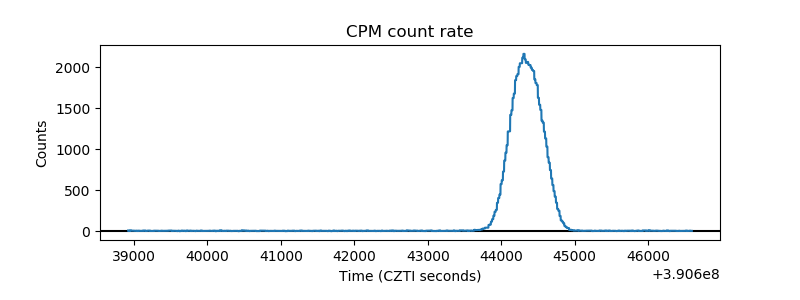 |
| CZT Counter | 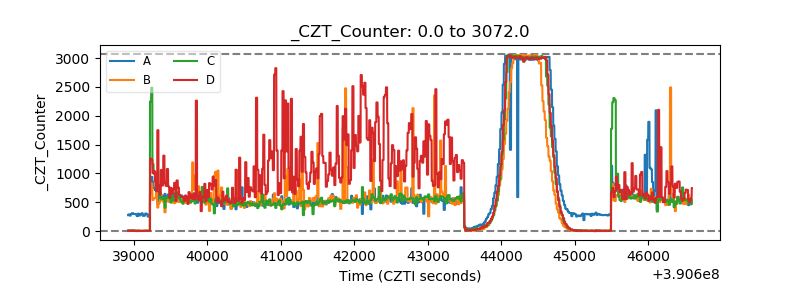 |
| +2.5 Volts monitor | 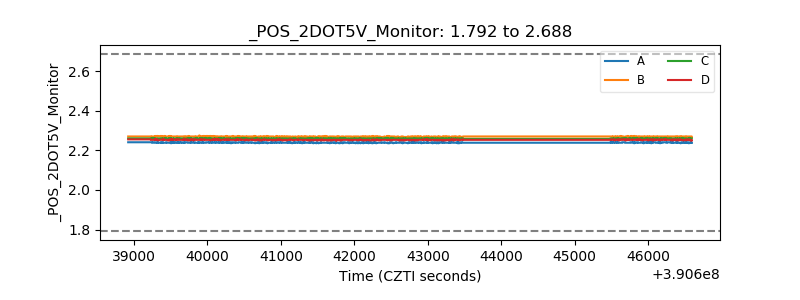 |
| +5 Volts monitor | 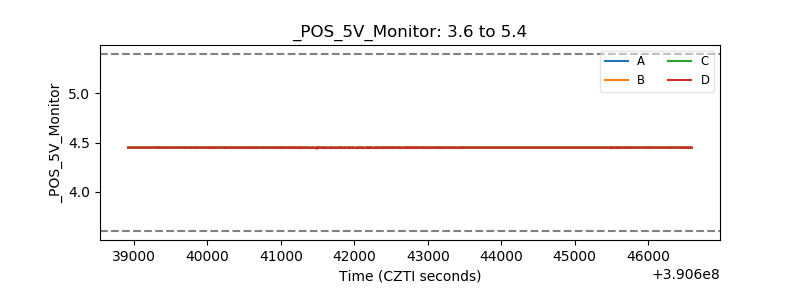 |
| _ROLL_ROT | 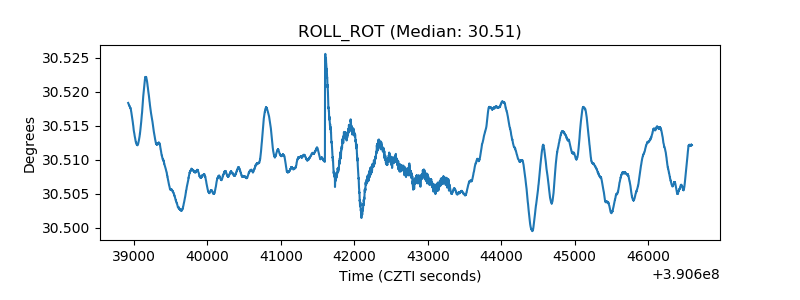 |
| _Roll_DEC | 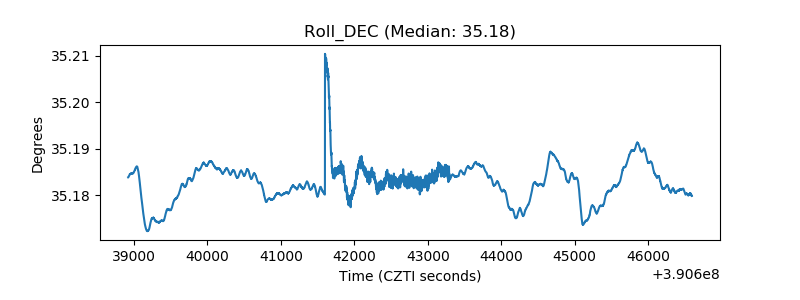 |
| _Roll_RA | 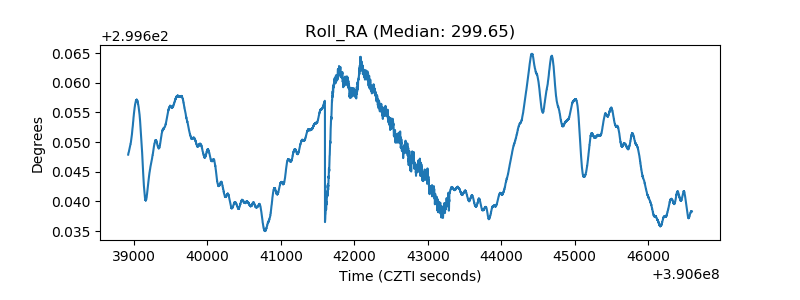 |
| Veto Counter | 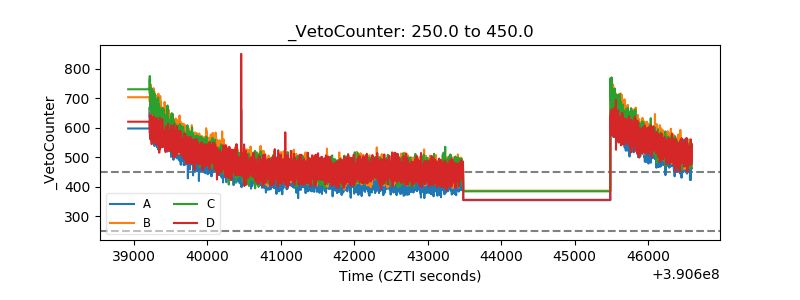 |