| Param | Original file | Final file |
|---|---|---|
| Filename | modeM0/AS1T04_069T01_9000005158_36031cztM0_level2.evt | modeM0/AS1T04_069T01_9000005158_36031cztM0_level2_quad_clean.evt |
| Size (bytes) | 1,930,824,000 | 242,372,160 |
| Size | 1.8 GB | 231.1 MB |
| Events in quadrant A | 10,951,788 | 1,519,558 |
| Events in quadrant B | 13,925,428 | 1,492,902 |
| Events in quadrant C | 14,246,697 | 1,471,430 |
| Events in quadrant D | 17,878,939 | 1,350,373 |
| Mode M0 | |||
|---|---|---|---|
| Quadrant | BADHDUFLAG | Total packets | Discarded packets |
| A | 0 | 45169 | 7 |
| B | 0 | 54735 | 6 |
| C | 0 | 54952 | 6 |
| D | 0 | 67654 | 6 |
| Mode M9 | |||
|---|---|---|---|
| Quadrant | BADHDUFLAG | Total packets | Discarded packets |
| A | 0 | 110 | 0 |
| B | 0 | 110 | 0 |
| C | 0 | 110 | 0 |
| D | 0 | 111 | 0 |
| Mode SS | |||
|---|---|---|---|
| Quadrant | BADHDUFLAG | Total packets | Discarded packets |
| A | 0 | 446 | 0 |
| B | 0 | 446 | 0 |
| C | 0 | 446 | 0 |
| D | 0 | 446 | 0 |
| Quadrant | Total seconds | Saturated seconds | Saturation percentage |
|---|---|---|---|
| A | 21872 | 30 | 0.137162% |
| B | 21872 | 875 | 4.000549% |
| C | 21872 | 761 | 3.479334% |
| D | 21872 | 1573 | 7.191843% |
Noise dominated data is calculated using 1-second bins in cleaned event files. If a bin has >2000 counts, and if more than 50% of those come from <1% of pixels, then it is considered to be noise-dominated and hence unusable.
| Quadrant | # 1 sec bins | Bins with >0 counts | Bins with >2000 counts | High rate bins dominated by noise | Noise dominated (total time) | Noise dominated (detector-on time) | Marked lightcurve |
|---|---|---|---|---|---|---|---|
| A | 32126 | 21877 | 2 | 2 | 0.01% | 0.01% | 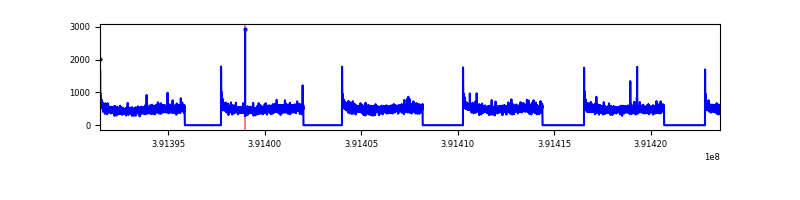 |
| B | 32126 | 21875 | 643 | 643 | 2.00% | 2.94% | 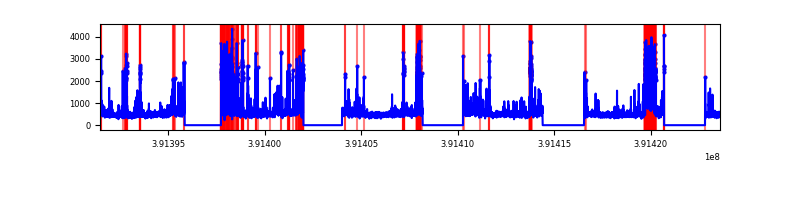 |
| C | 32126 | 21877 | 650 | 650 | 2.02% | 2.97% | 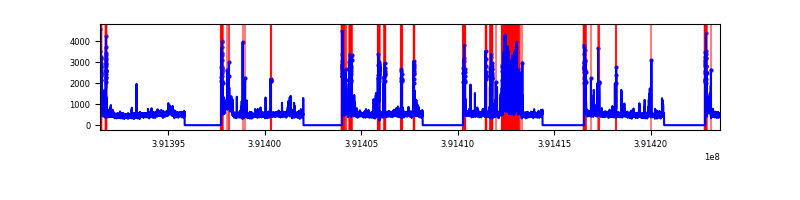 |
| D | 32126 | 21877 | 1491 | 1491 | 4.64% | 6.82% | 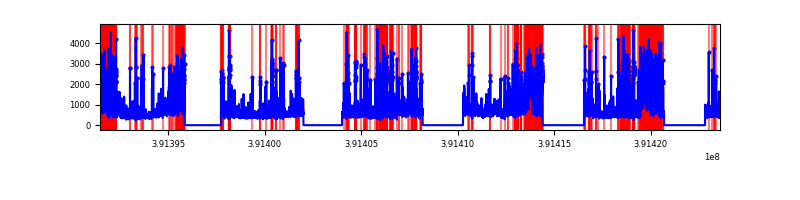 |
Top three noisy pixels from each quadrant. If the there are fewer than three noisy pixels in the level2.evt file, extra rows are filled as -1
| Pixel properties | Quadrant properties | ||||||
|---|---|---|---|---|---|---|---|
| Quadrant | DetID | PixID | Counts | Sigma | Mean | Median | Sigma |
| A | 10 | 83 | 587657 | 1102.65 | 2671 | 2625 | 530.6 |
| A | 13 | 254 | 33688 | 58.55 | 2671 | 2625 | 530.6 |
| A | 13 | 6 | 27451 | 46.79 | 2671 | 2625 | 530.6 |
| B | 5 | 236 | 1922229 | 3916.66 | 2619 | 2551 | 490.1 |
| B | 5 | 172 | 581162 | 1180.52 | 2619 | 2551 | 490.1 |
| B | 5 | 255 | 465701 | 944.95 | 2619 | 2551 | 490.1 |
| C | 9 | 187 | 2087933 | 3571.05 | 2563 | 2581 | 584.0 |
| C | 15 | 214 | 892507 | 1523.95 | 2563 | 2581 | 584.0 |
| C | 0 | 10 | 687666 | 1173.17 | 2563 | 2581 | 584.0 |
| D | 12 | 227 | 3351075 | 5508.04 | 2527 | 2464 | 608.0 |
| D | 12 | 235 | 1439074 | 2363.04 | 2527 | 2464 | 608.0 |
| D | 13 | 249 | 877399 | 1439.16 | 2527 | 2464 | 608.0 |
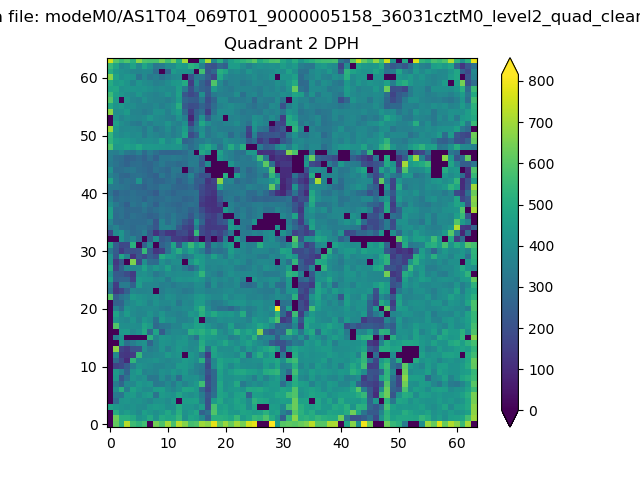
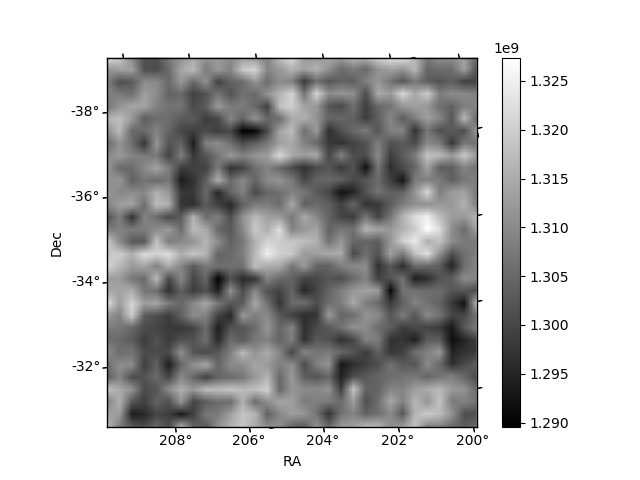
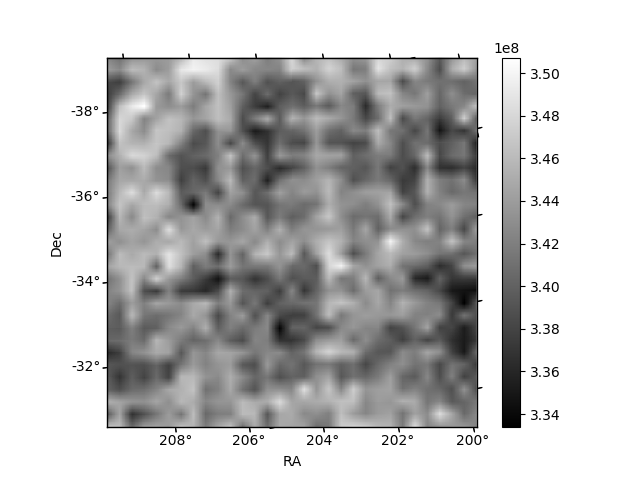
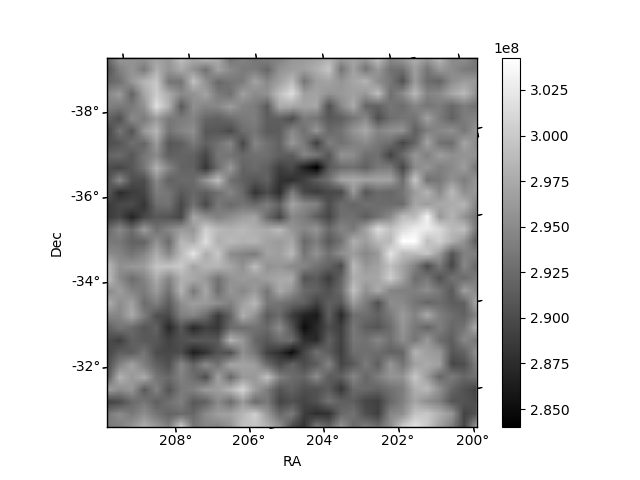
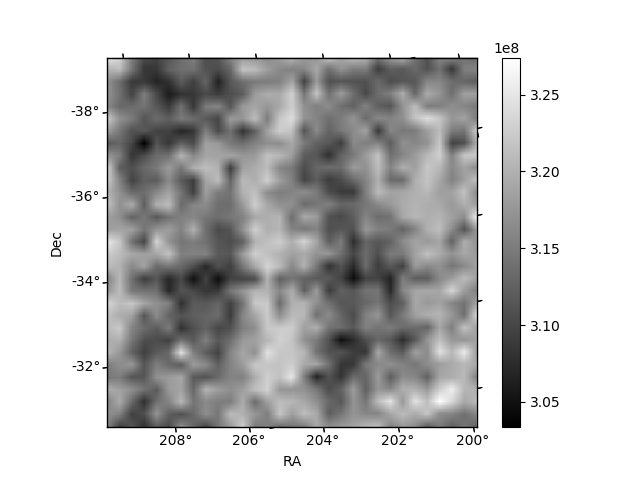
Histogram calculated using DETX and DETY for each event in the final _common_clean file
| Quadrant A | 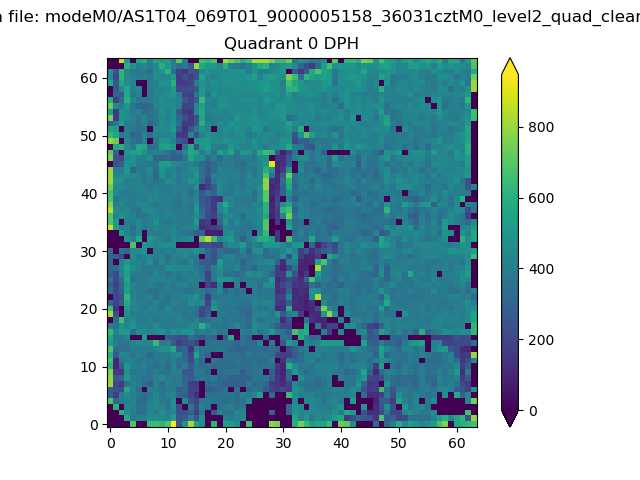 |
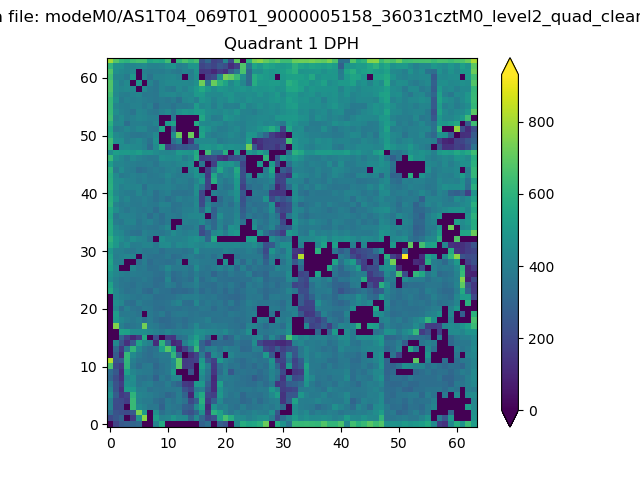 |
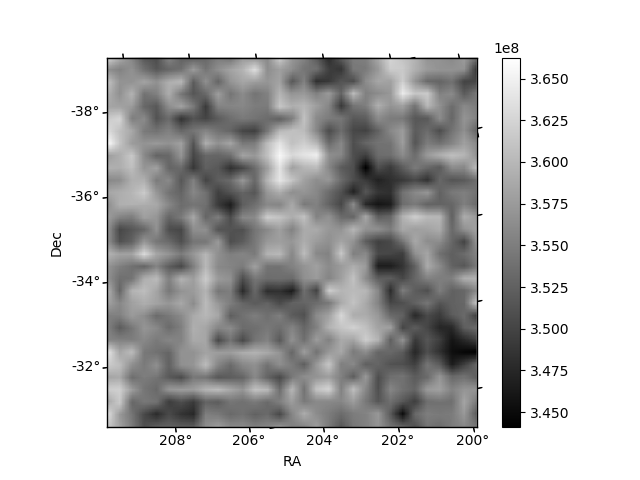
Quadrant B |
|---|---|---|---|
| Quadrant D | 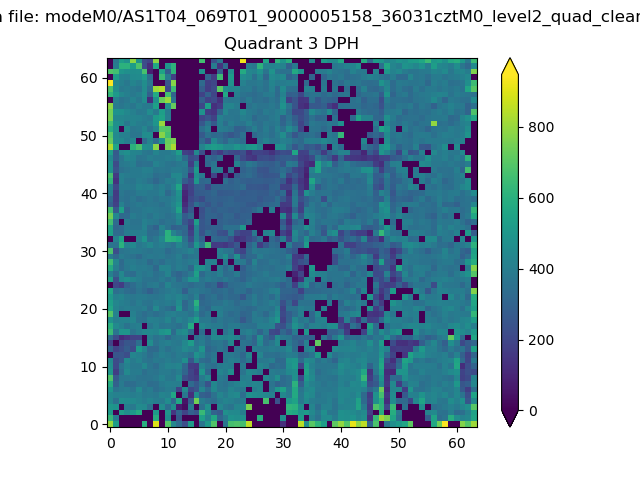 |
 |
Quadrant C |
| Plot type | Count rate plots | Images |
|---|---|---|
| Comparison with Poisson distribution Blue bars denote a histogram of data divided into 1 sec bins. Red curve is a Poisson curve with rate = median count rate of data. |
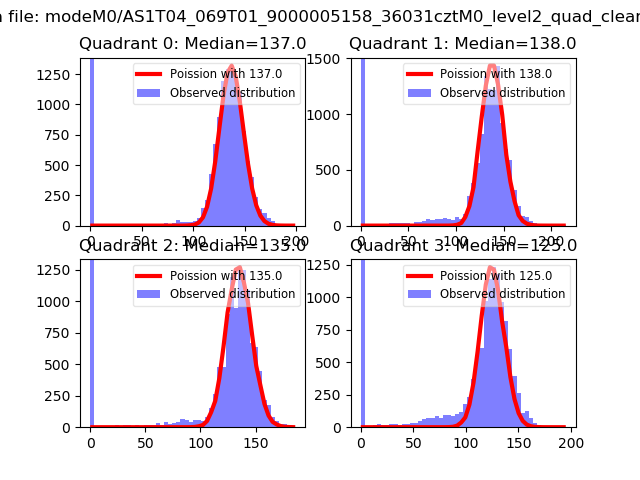 |
 |
| Quadrant-wise count rates Data is divided into 100 sec bins |
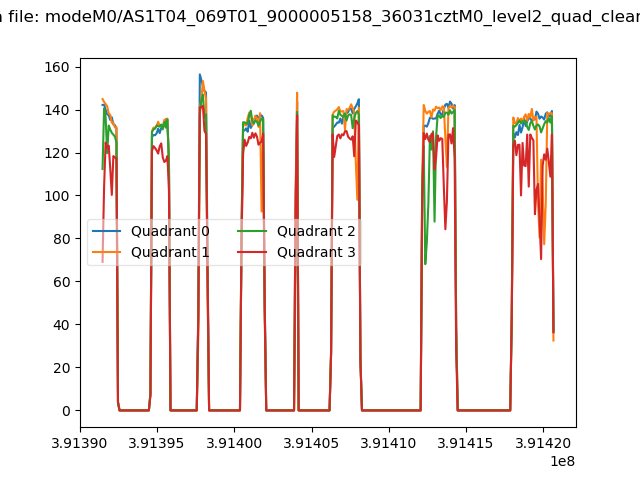 |
|
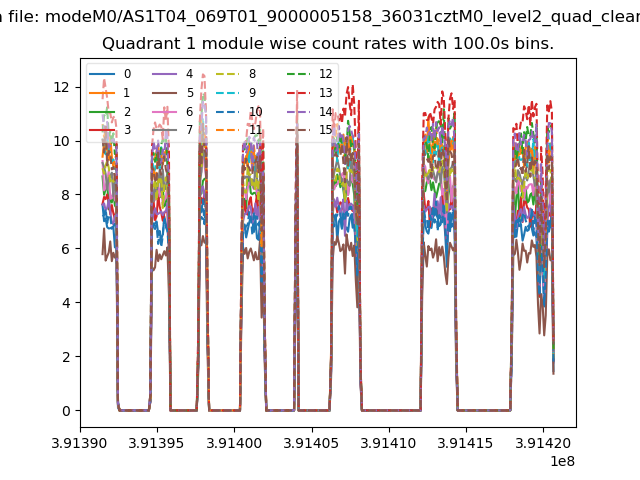
| Module-wise count rates for Quadrant A Data is divided into 100 sec bins |
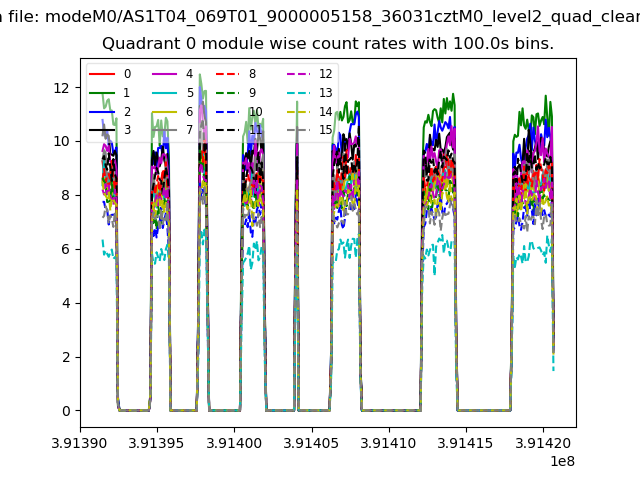 |
 |
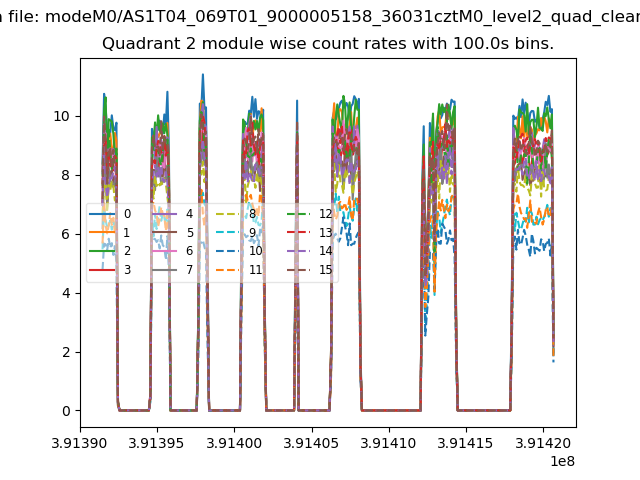
| Module-wise count rates for Quadrant B Data is divided into 100 sec bins |
 |
 |
| Module-wise count rates for Quadrant C Data is divided into 100 sec bins |
 |
 |
| Module-wise count rates for Quadrant D Data is divided into 100 sec bins |
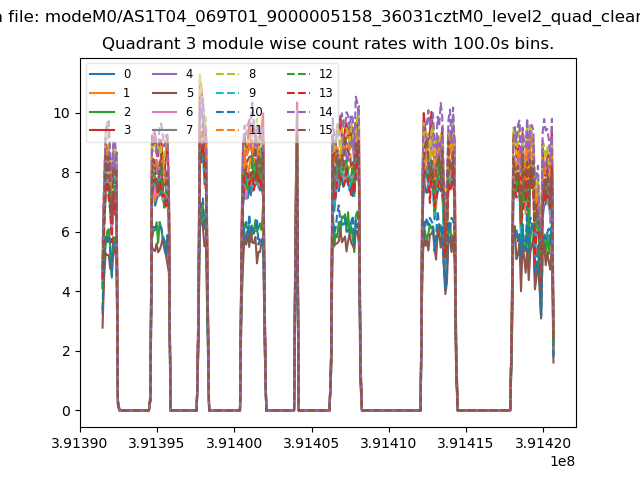 |
 |
| Parameter | Plot |
|---|---|
| CZT HV Monitor | 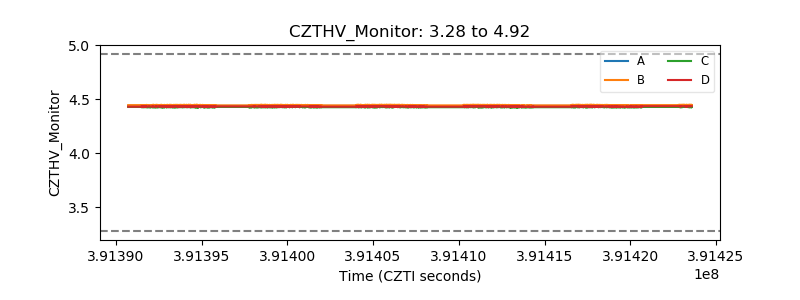 |
| D_VDD | 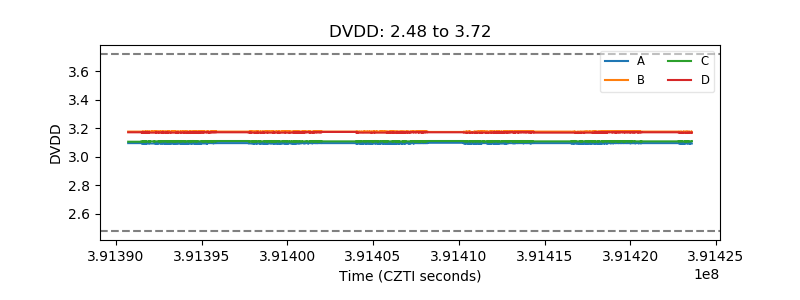 |
| Temperature 1 | 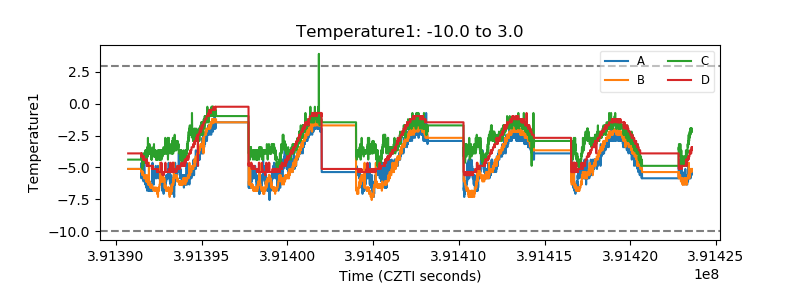 |
| Veto HV Monitor | 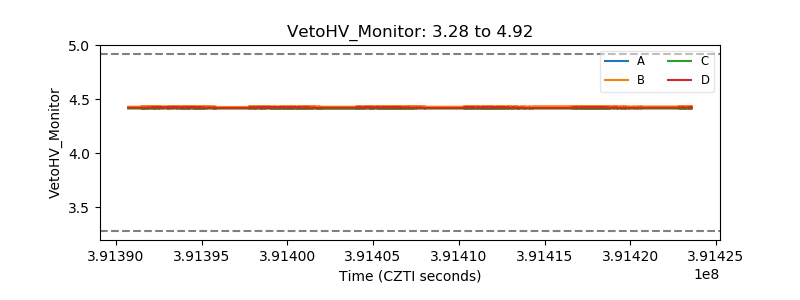 |
| Veto LLD | 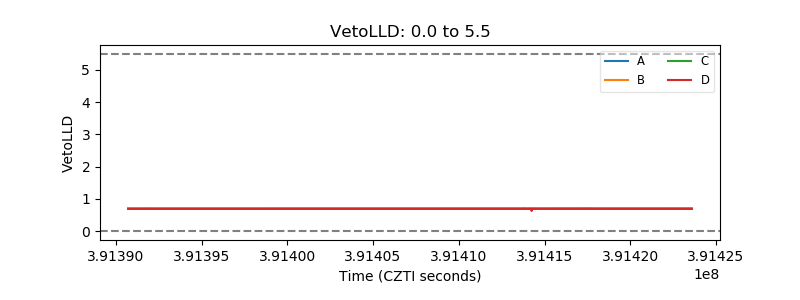 |
| Alpha Counter | 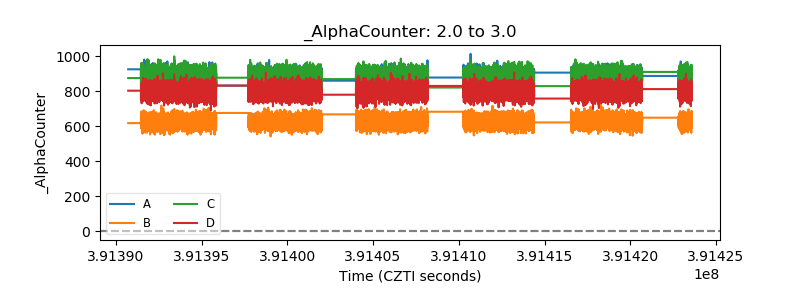 |
| _CPM_Rate | 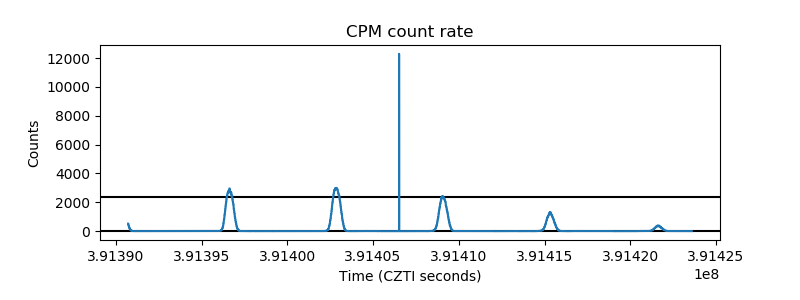 |
| CZT Counter | 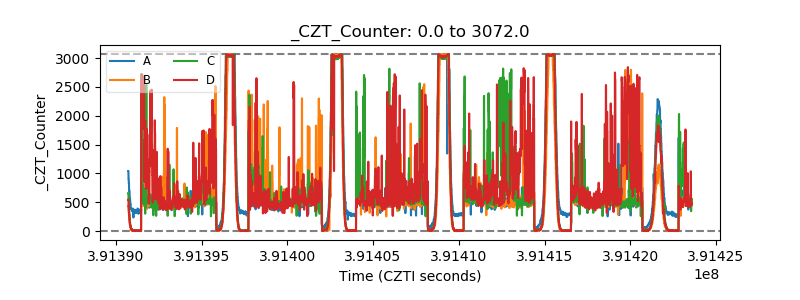 |
| +2.5 Volts monitor | 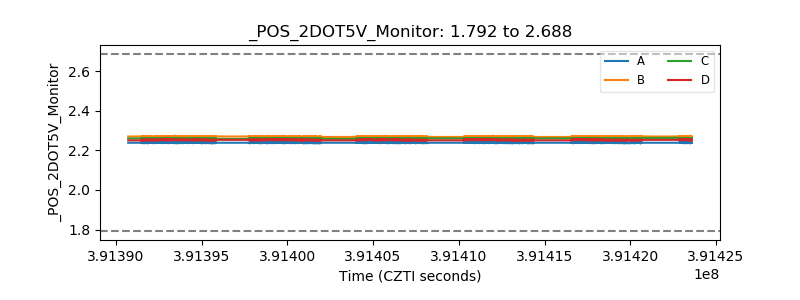 |
| +5 Volts monitor | 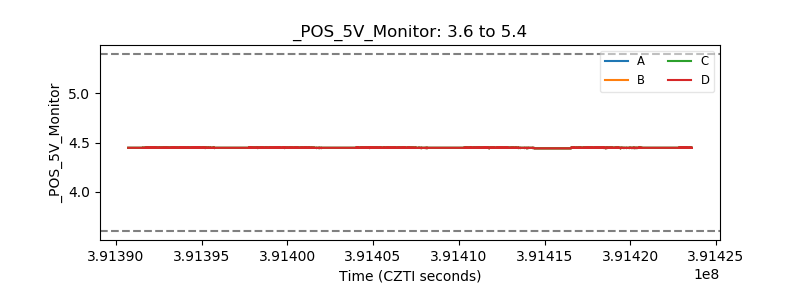 |
| _ROLL_ROT | 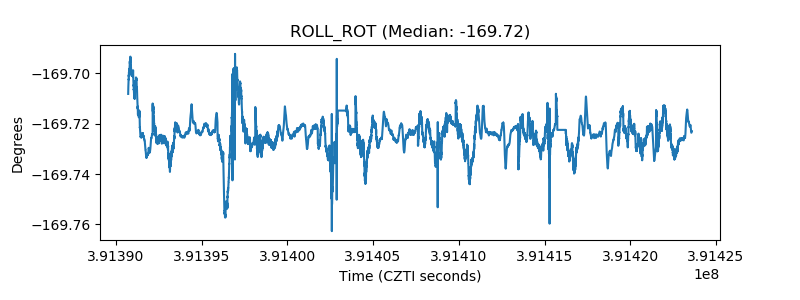 |
| _Roll_DEC | 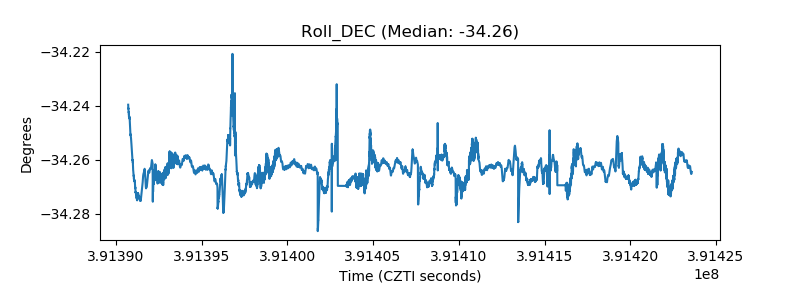 |
| _Roll_RA | 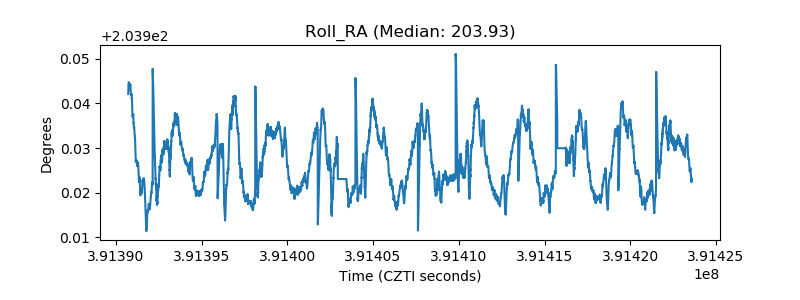 |
| Veto Counter | 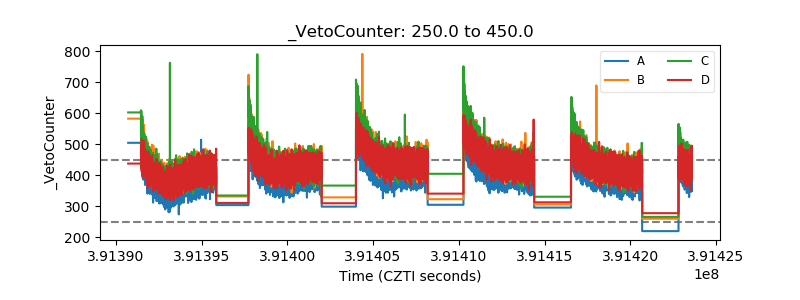 |