| Param | Original file | Final file |
|---|---|---|
| Filename | modeM0/AS1A11_097T17_9000005170_36193cztM0_level2.evt | modeM0/AS1A11_097T17_9000005170_36193cztM0_level2_quad_clean.evt |
| Size (bytes) | 583,879,680 | 78,825,600 |
| Size | 556.8 MB | 75.2 MB |
| Events in quadrant A | 3,225,564 | 492,900 |
| Events in quadrant B | 3,197,671 | 501,972 |
| Events in quadrant C | 5,957,905 | 482,940 |
| Events in quadrant D | 4,851,856 | 446,220 |
| Mode SS | |||
|---|---|---|---|
| Quadrant | BADHDUFLAG | Total packets | Discarded packets |
| A | 0 | 136 | 0 |
| B | 0 | 136 | 0 |
| C | 0 | 136 | 0 |
| D | 0 | 136 | 0 |
| Mode M0 | |||
|---|---|---|---|
| Quadrant | BADHDUFLAG | Total packets | Discarded packets |
| A | 0 | 13690 | 3 |
| B | 0 | 13758 | 2 |
| C | 0 | 21833 | 2 |
| D | 0 | 18961 | 2 |
| Mode M9 | |||
|---|---|---|---|
| Quadrant | BADHDUFLAG | Total packets | Discarded packets |
| A | 0 | 30 | 0 |
| B | 0 | 30 | 0 |
| C | 0 | 30 | 0 |
| D | 0 | 30 | 0 |
| Quadrant | Total seconds | Saturated seconds | Saturation percentage |
|---|---|---|---|
| A | 6639 | 20 | 0.301250% |
| B | 6639 | 14 | 0.210875% |
| C | 6639 | 883 | 13.300196% |
| D | 6639 | 487 | 7.335442% |
Noise dominated data is calculated using 1-second bins in cleaned event files. If a bin has >2000 counts, and if more than 50% of those come from <1% of pixels, then it is considered to be noise-dominated and hence unusable.
| Quadrant | # 1 sec bins | Bins with >0 counts | Bins with >2000 counts | High rate bins dominated by noise | Noise dominated (total time) | Noise dominated (detector-on time) | Marked lightcurve |
|---|---|---|---|---|---|---|---|
| A | 9655 | 6641 | 3 | 3 | 0.03% | 0.05% | 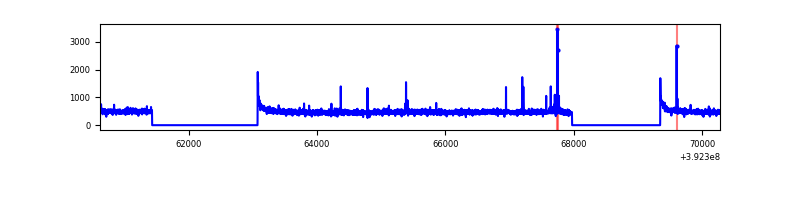 |
| B | 9655 | 6641 | 5 | 5 | 0.05% | 0.08% |  |
| C | 9655 | 6641 | 750 | 750 | 7.77% | 11.29% |  |
| D | 9655 | 6641 | 396 | 396 | 4.10% | 5.96% | 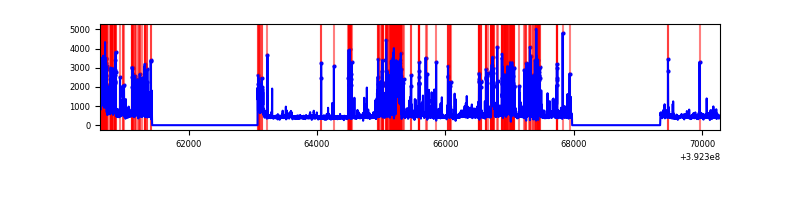 |
Top three noisy pixels from each quadrant. If the there are fewer than three noisy pixels in the level2.evt file, extra rows are filled as -1
| Pixel properties | Quadrant properties | ||||||
|---|---|---|---|---|---|---|---|
| Quadrant | DetID | PixID | Counts | Sigma | Mean | Median | Sigma |
| A | 10 | 83 | 188980 | 1227.66 | 764 | 749 | 153.3 |
| A | 9 | 143 | 36469 | 232.97 | 764 | 749 | 153.3 |
| A | 8 | 144 | 22561 | 142.26 | 764 | 749 | 153.3 |
| B | 5 | 172 | 112350 | 760.83 | 761 | 740 | 146.7 |
| B | 0 | 213 | 43508 | 291.54 | 761 | 740 | 146.7 |
| B | 4 | 232 | 27965 | 185.59 | 761 | 740 | 146.7 |
| C | 4 | 254 | 2484981 | 15165.34 | 704 | 708 | 163.8 |
| C | 15 | 214 | 283085 | 1723.78 | 704 | 708 | 163.8 |
| C | 15 | 208 | 267743 | 1630.13 | 704 | 708 | 163.8 |
| D | 2 | 250 | 902709 | 5112.33 | 725 | 706 | 176.4 |
| D | 12 | 6 | 553630 | 3133.84 | 725 | 706 | 176.4 |
| D | 13 | 249 | 374938 | 2121.06 | 725 | 706 | 176.4 |
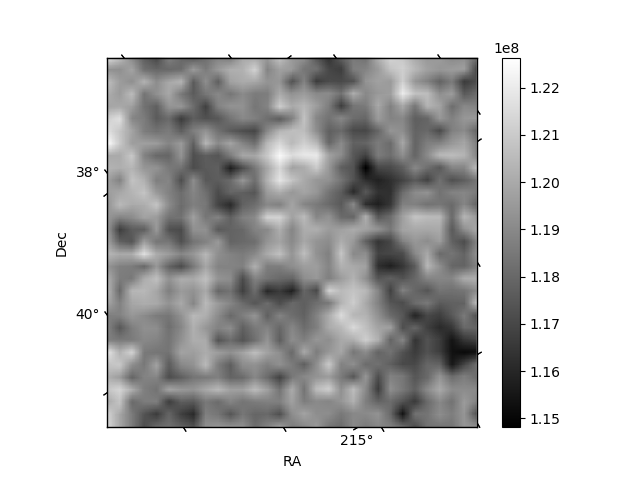
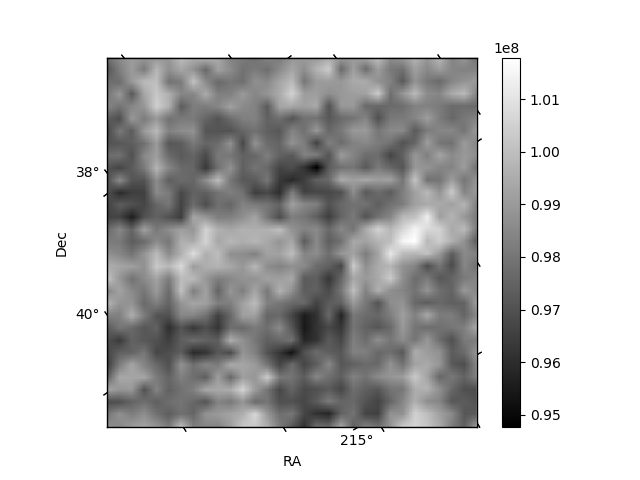
Histogram calculated using DETX and DETY for each event in the final _common_clean file
| Quadrant A |  |
 |
Quadrant B |
|---|---|---|---|
| Quadrant D |  |
 |
Quadrant C |
| Plot type | Count rate plots | Images |
|---|---|---|
| Comparison with Poisson distribution Blue bars denote a histogram of data divided into 1 sec bins. Red curve is a Poisson curve with rate = median count rate of data. |
 |
 |
| Quadrant-wise count rates Data is divided into 100 sec bins |
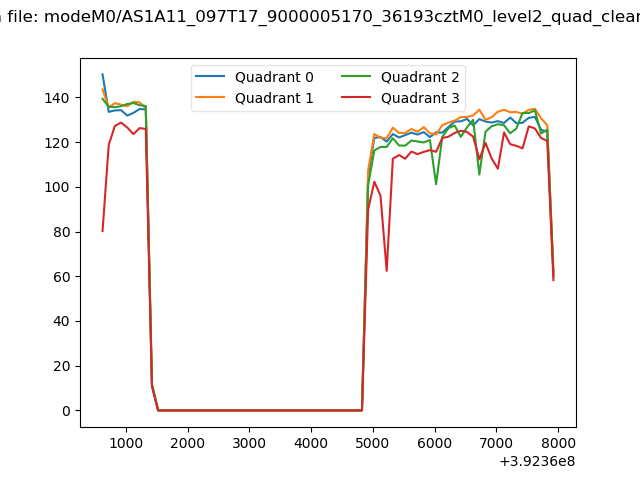 |
|
| Module-wise count rates for Quadrant A Data is divided into 100 sec bins |
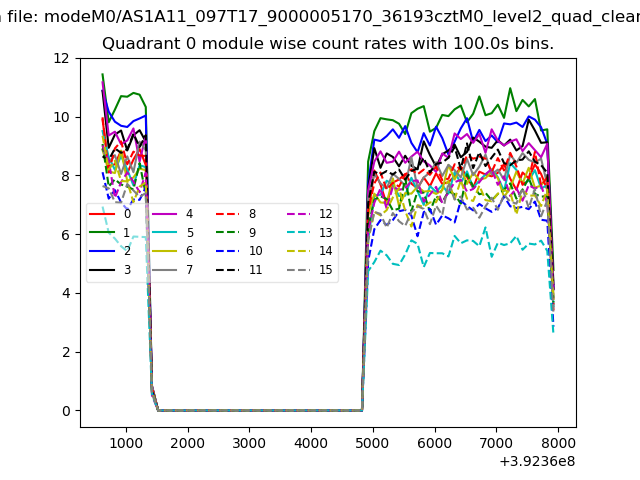 |
 |
| Module-wise count rates for Quadrant B Data is divided into 100 sec bins |
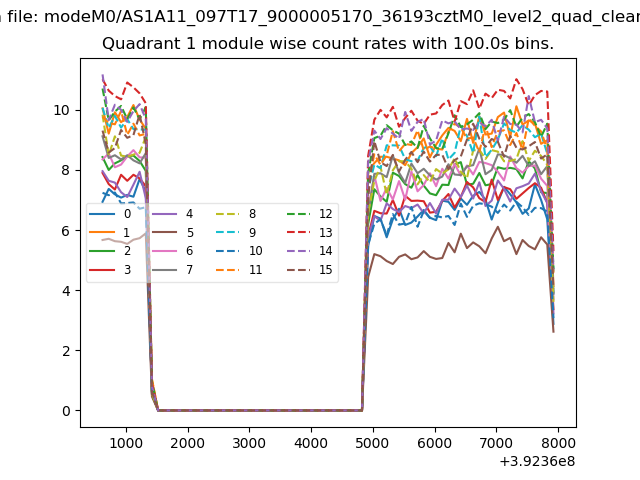 |
 |
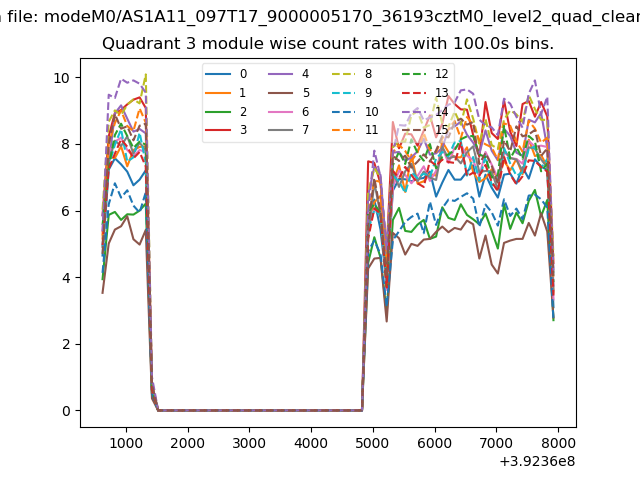
| Module-wise count rates for Quadrant C Data is divided into 100 sec bins |
 |
 |
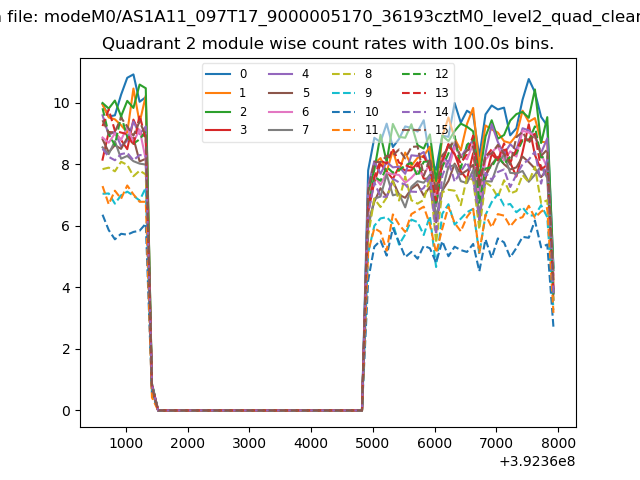
| Module-wise count rates for Quadrant D Data is divided into 100 sec bins |
 |
 |
| Parameter | Plot |
|---|---|
| CZT HV Monitor | 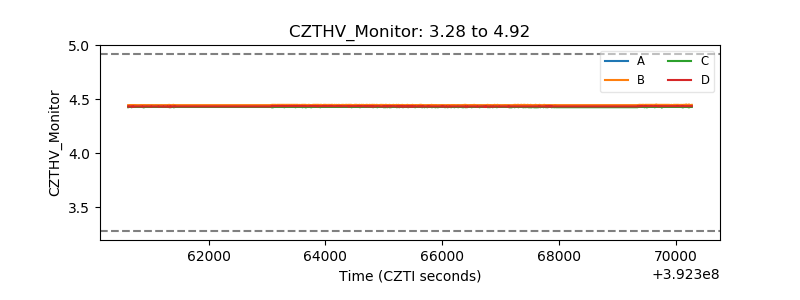 |
| D_VDD |  |
| Temperature 1 |  |
| Veto HV Monitor |  |
| Veto LLD | 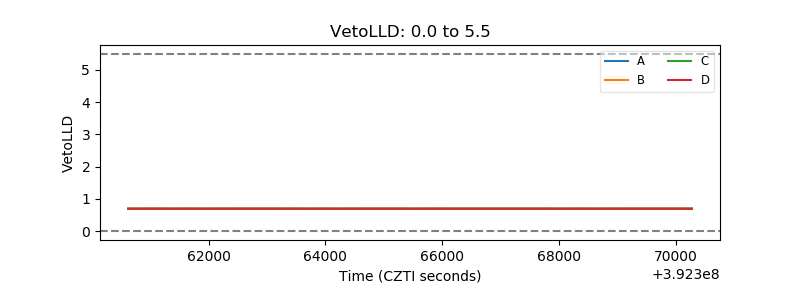 |
| Alpha Counter |  |
| _CPM_Rate | 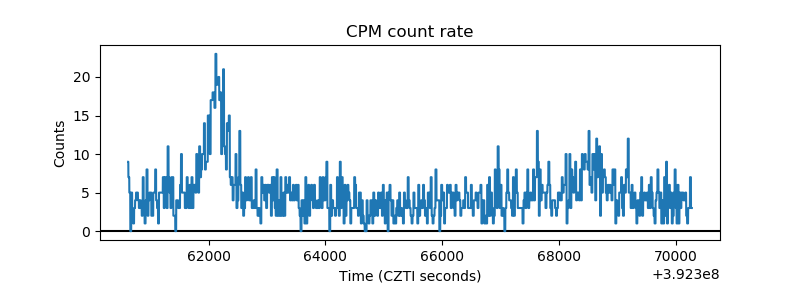 |
| CZT Counter | 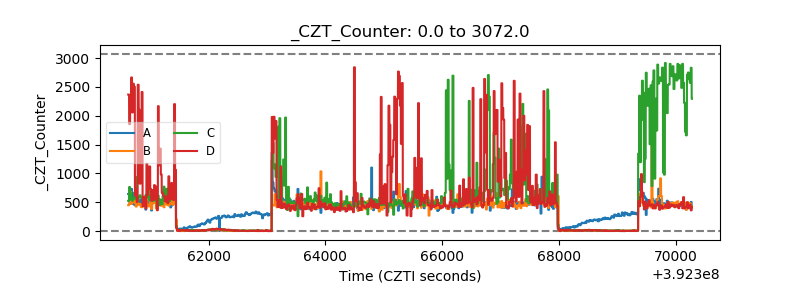 |
| +2.5 Volts monitor |  |
| +5 Volts monitor |  |
| _ROLL_ROT | 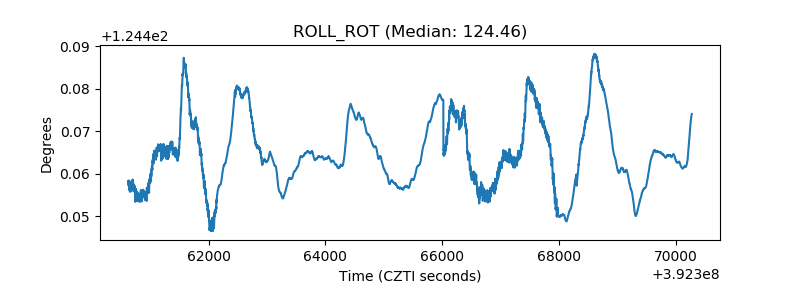 |
| _Roll_DEC | 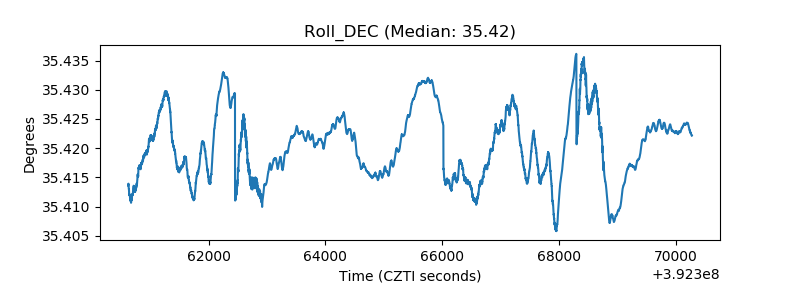 |
| _Roll_RA |  |
| Veto Counter | 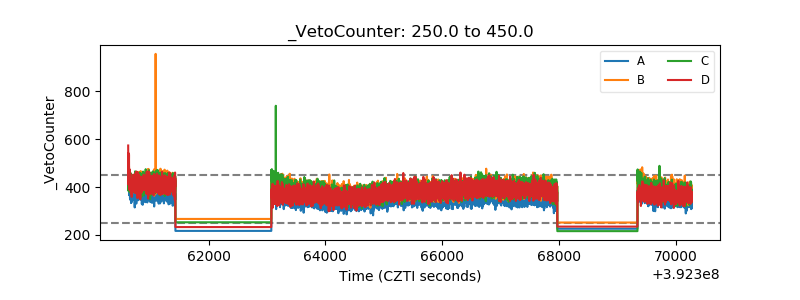 |