| Param | Original file | Final file |
|---|---|---|
| Filename | modeM0/AS1A11_049T02_9000005220_36556cztM0_level2.evt | modeM0/AS1A11_049T02_9000005220_36556cztM0_level2_quad_clean.evt |
| Size (bytes) | 455,250,240 | 73,108,800 |
| Size | 434.2 MB | 69.7 MB |
| Events in quadrant A | 3,059,137 | 467,764 |
| Events in quadrant B | 3,393,048 | 459,079 |
| Events in quadrant C | 3,236,838 | 447,707 |
| Events in quadrant D | 3,698,179 | 427,487 |
| Mode M9 | |||
|---|---|---|---|
| Quadrant | BADHDUFLAG | Total packets | Discarded packets |
| A | 0 | 24 | 0 |
| B | 0 | 24 | 0 |
| C | 0 | 24 | 0 |
| D | 0 | 25 | 0 |
| Mode M0 | |||
|---|---|---|---|
| Quadrant | BADHDUFLAG | Total packets | Discarded packets |
| A | 0 | 12866 | 3 |
| B | 0 | 13964 | 2 |
| C | 0 | 13330 | 2 |
| D | 0 | 15047 | 2 |
| Mode SS | |||
|---|---|---|---|
| Quadrant | BADHDUFLAG | Total packets | Discarded packets |
| A | 0 | 118 | 0 |
| B | 0 | 118 | 0 |
| C | 0 | 118 | 0 |
| D | 0 | 118 | 0 |
| Quadrant | Total seconds | Saturated seconds | Saturation percentage |
|---|---|---|---|
| A | 5896 | 68 | 1.153324% |
| B | 5896 | 147 | 2.493216% |
| C | 5896 | 162 | 2.747626% |
| D | 5896 | 284 | 4.816825% |
Noise dominated data is calculated using 1-second bins in cleaned event files. If a bin has >2000 counts, and if more than 50% of those come from <1% of pixels, then it is considered to be noise-dominated and hence unusable.
| Quadrant | # 1 sec bins | Bins with >0 counts | Bins with >2000 counts | High rate bins dominated by noise | Noise dominated (total time) | Noise dominated (detector-on time) | Marked lightcurve |
|---|---|---|---|---|---|---|---|
| A | 7178 | 5897 | 41 | 41 | 0.57% | 0.70% | 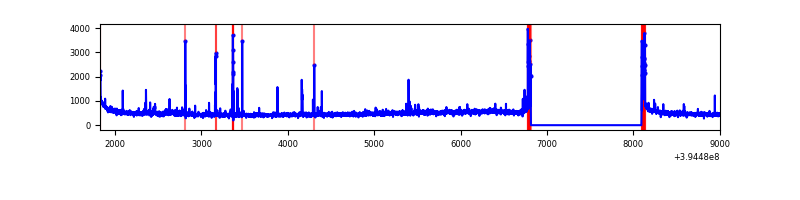 |
| B | 7178 | 5897 | 104 | 104 | 1.45% | 1.76% | 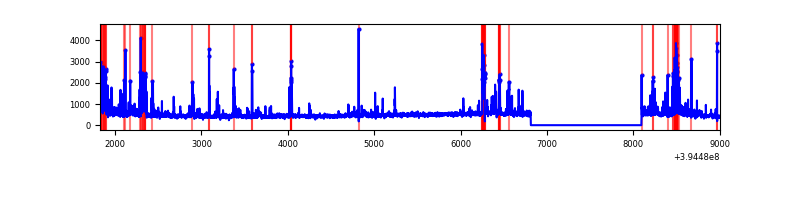 |
| C | 7178 | 5897 | 116 | 116 | 1.62% | 1.97% | 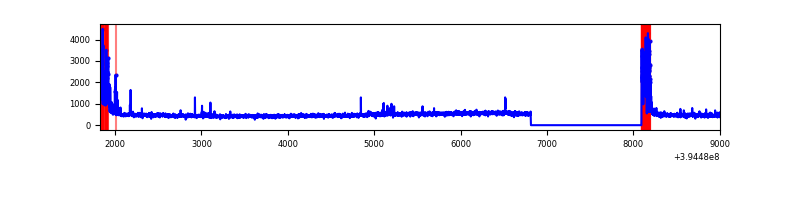 |
| D | 7178 | 5897 | 182 | 182 | 2.54% | 3.09% | 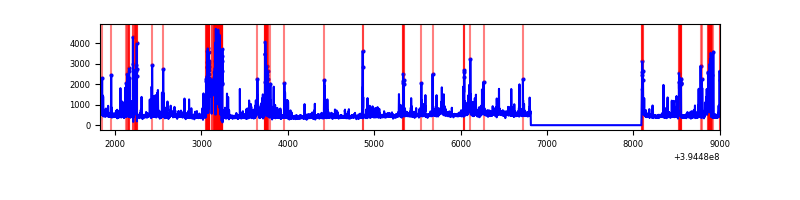 |
Top three noisy pixels from each quadrant. If the there are fewer than three noisy pixels in the level2.evt file, extra rows are filled as -1
| Pixel properties | Quadrant properties | ||||||
|---|---|---|---|---|---|---|---|
| Quadrant | DetID | PixID | Counts | Sigma | Mean | Median | Sigma |
| A | 10 | 83 | 216611 | 1579.94 | 671 | 659 | 136.7 |
| A | 15 | 223 | 154369 | 1124.57 | 671 | 659 | 136.7 |
| A | 9 | 143 | 55899 | 404.14 | 671 | 659 | 136.7 |
| B | 5 | 255 | 340434 | 2647.81 | 662 | 643 | 128.3 |
| B | 5 | 172 | 308649 | 2400.13 | 662 | 643 | 128.3 |
| B | 0 | 190 | 55573 | 428.04 | 662 | 643 | 128.3 |
| C | 0 | 10 | 417972 | 2790.16 | 638 | 643 | 149.6 |
| C | 15 | 214 | 246376 | 1642.91 | 638 | 643 | 149.6 |
| C | 14 | 254 | 63353 | 419.26 | 638 | 643 | 149.6 |
| D | 13 | 249 | 455507 | 2936.35 | 633 | 616 | 154.9 |
| D | 2 | 250 | 213805 | 1376.15 | 633 | 616 | 154.9 |
| D | 13 | 171 | 196237 | 1262.75 | 633 | 616 | 154.9 |
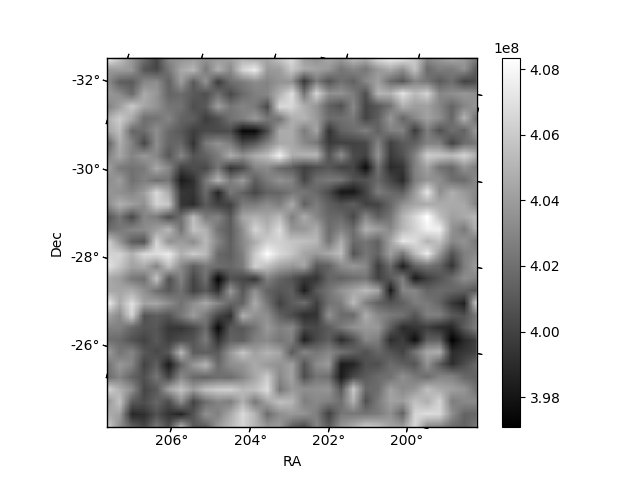
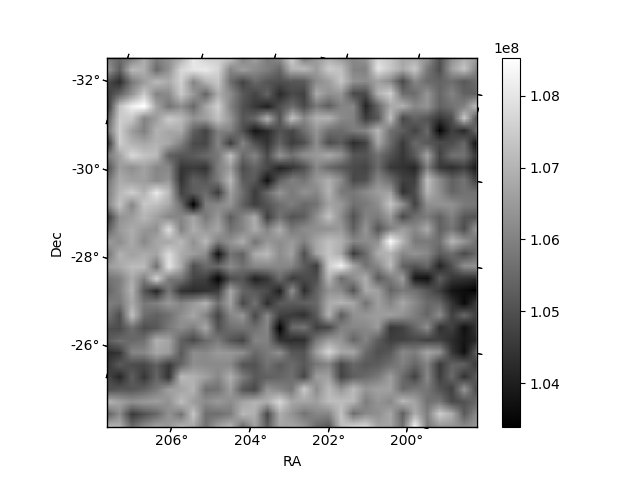
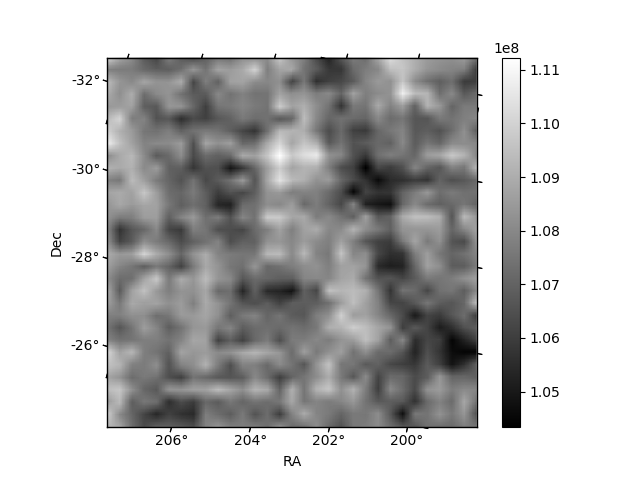
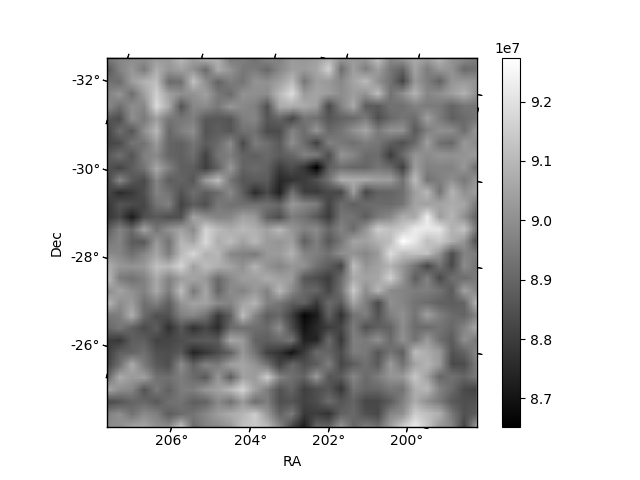
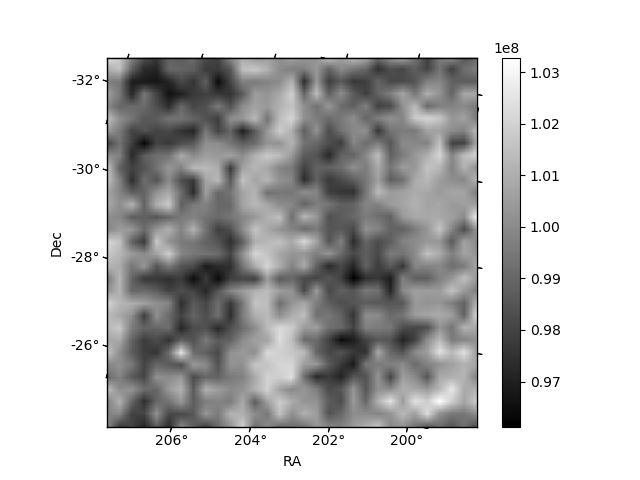
Histogram calculated using DETX and DETY for each event in the final _common_clean file
| Quadrant A | 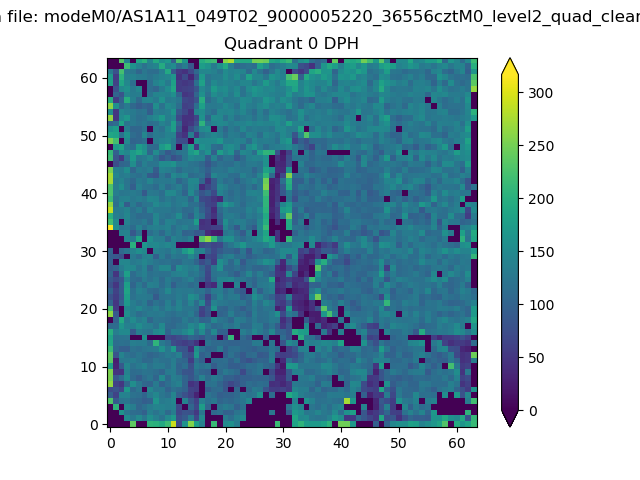 |
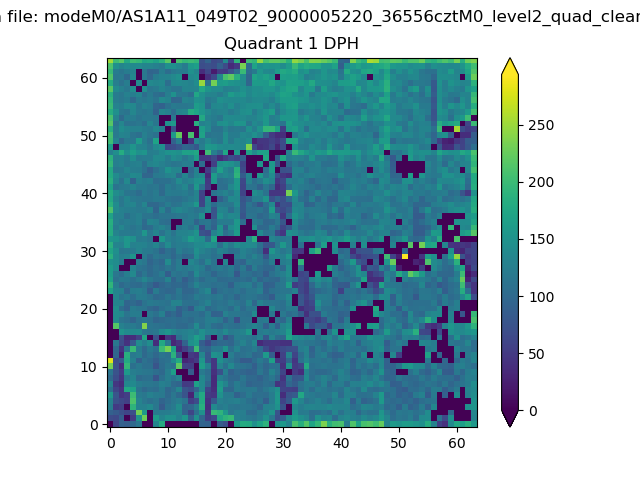 |
Quadrant B |
|---|---|---|---|
| Quadrant D | 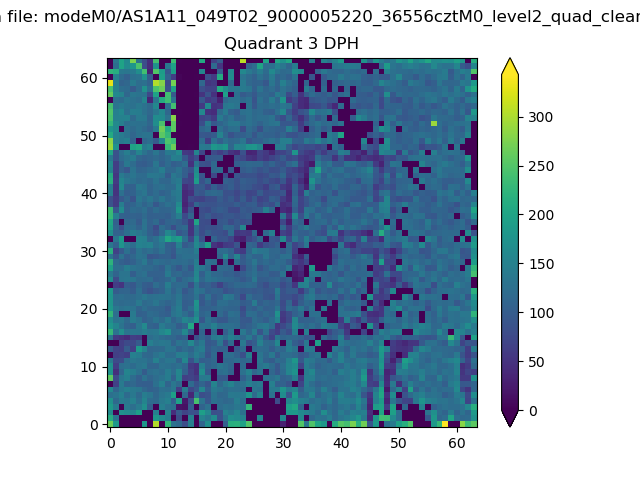 |
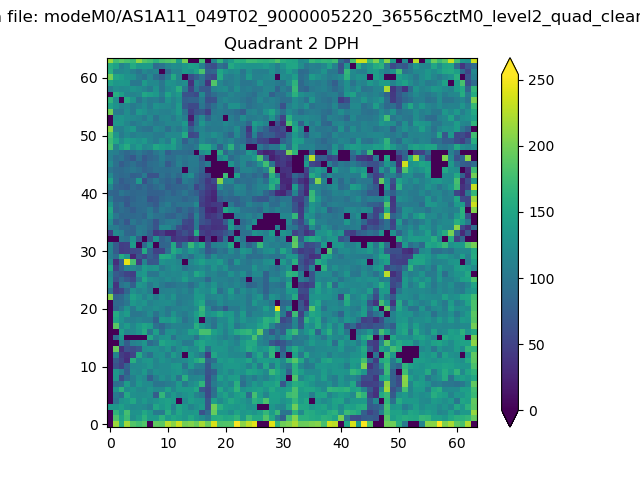 |
Quadrant C |
| Plot type | Count rate plots | Images |
|---|---|---|
| Comparison with Poisson distribution Blue bars denote a histogram of data divided into 1 sec bins. Red curve is a Poisson curve with rate = median count rate of data. |
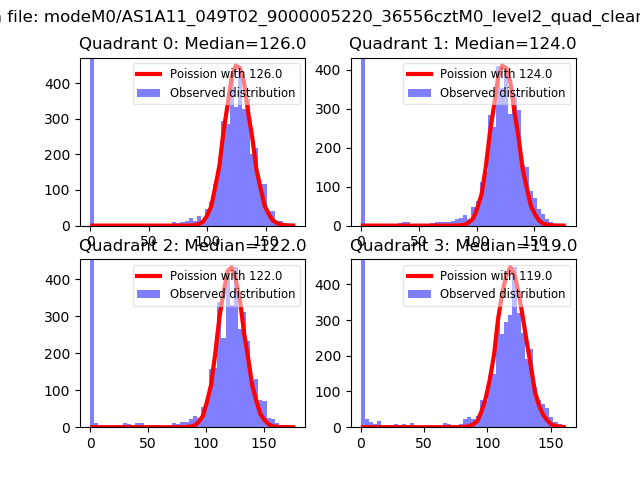 |
 |
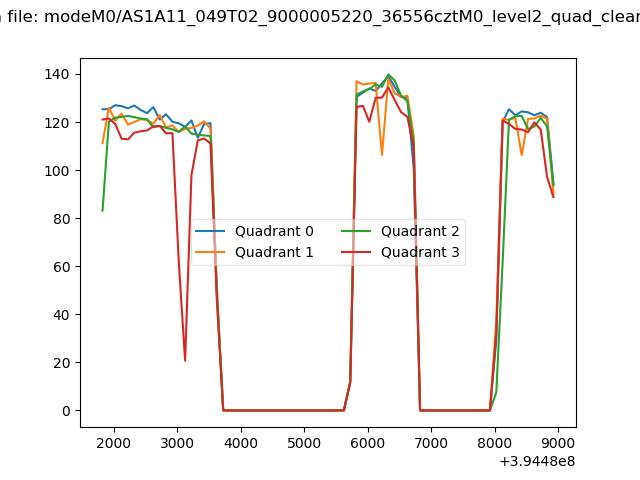
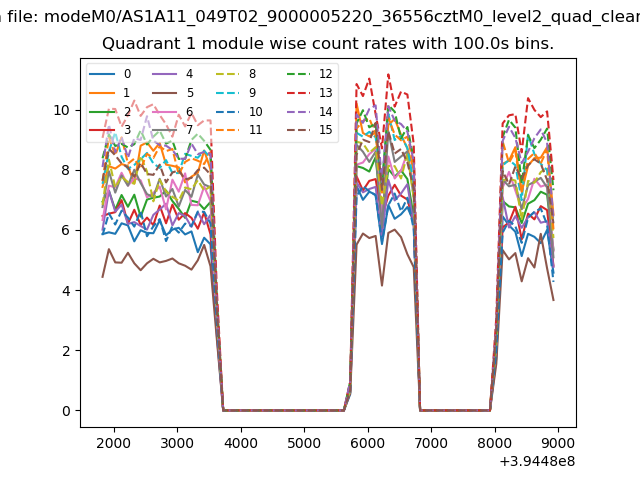
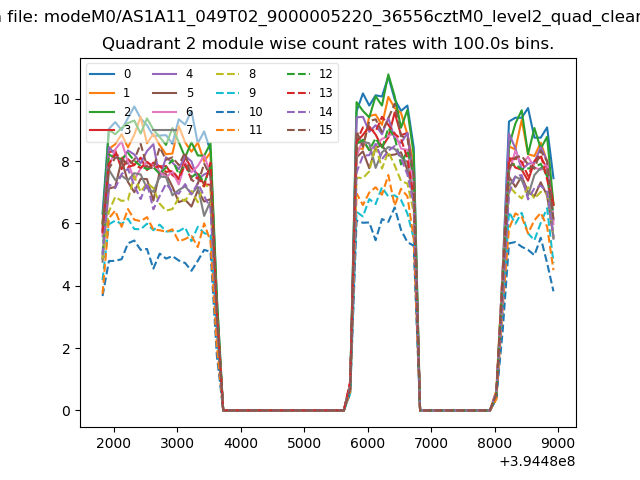
| Quadrant-wise count rates Data is divided into 100 sec bins |
 |
|
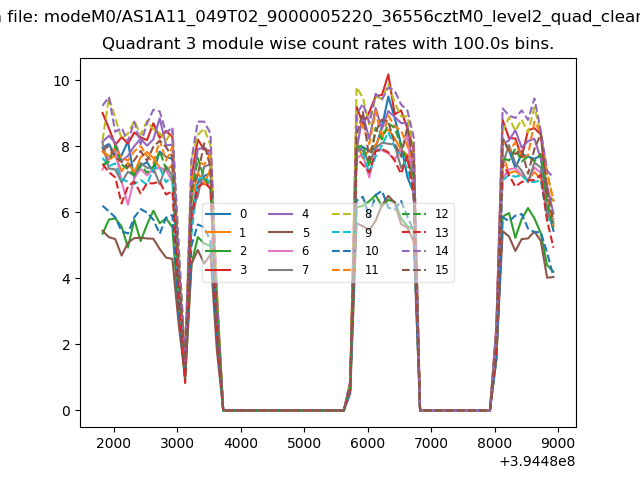
| Module-wise count rates for Quadrant A Data is divided into 100 sec bins |
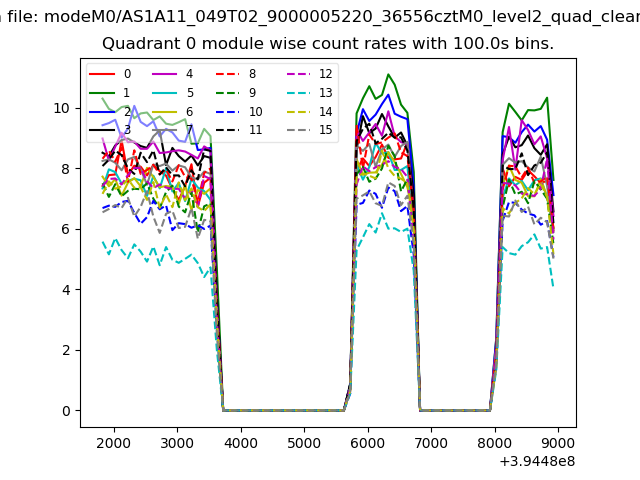 |
 |
| Module-wise count rates for Quadrant B Data is divided into 100 sec bins |
 |
 |
| Module-wise count rates for Quadrant C Data is divided into 100 sec bins |
 |
 |
| Module-wise count rates for Quadrant D Data is divided into 100 sec bins |
 |
 |
| Parameter | Plot |
|---|---|
| CZT HV Monitor |  |
| D_VDD | 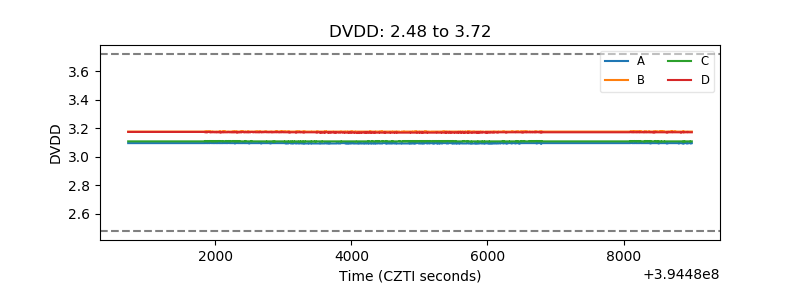 |
| Temperature 1 | 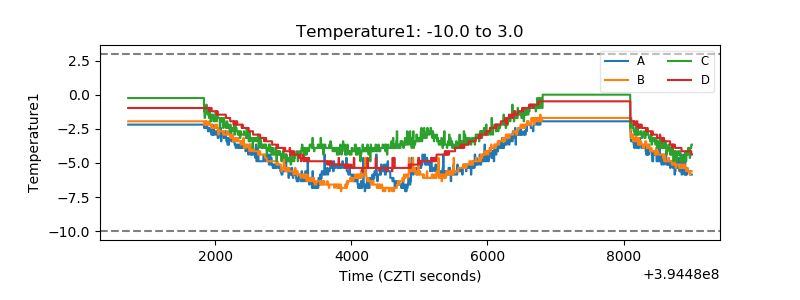 |
| Veto HV Monitor | 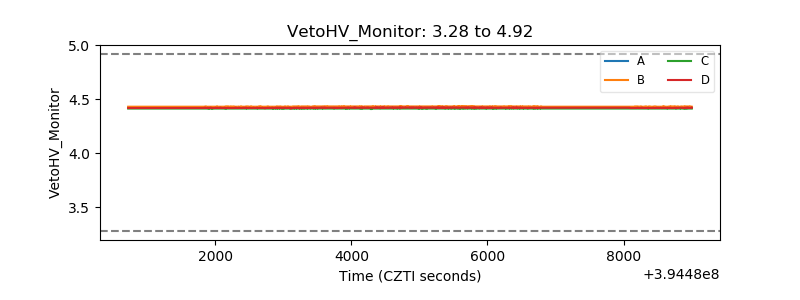 |
| Veto LLD | 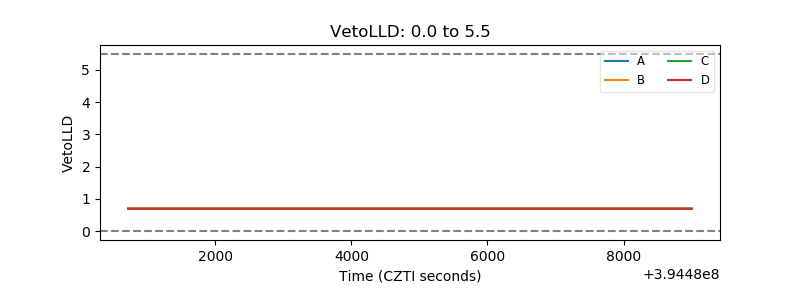 |
| Alpha Counter | 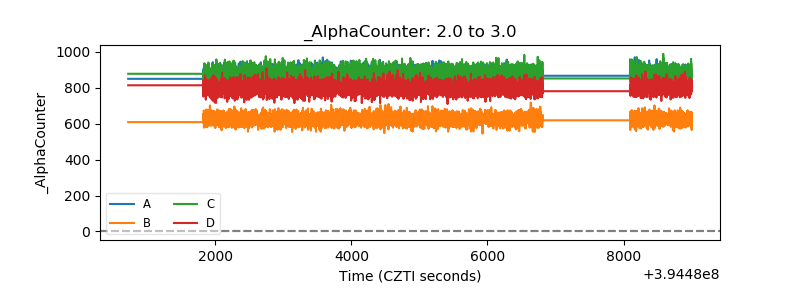 |
| _CPM_Rate | 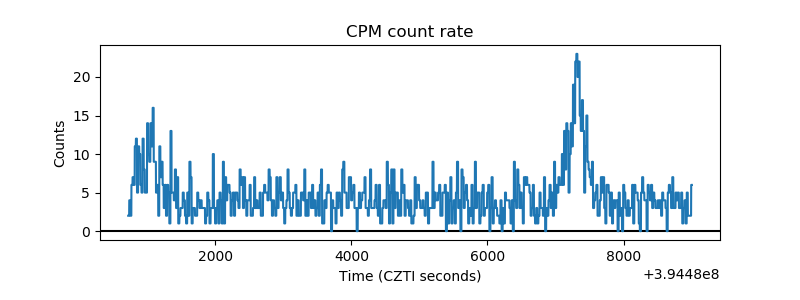 |
| CZT Counter | 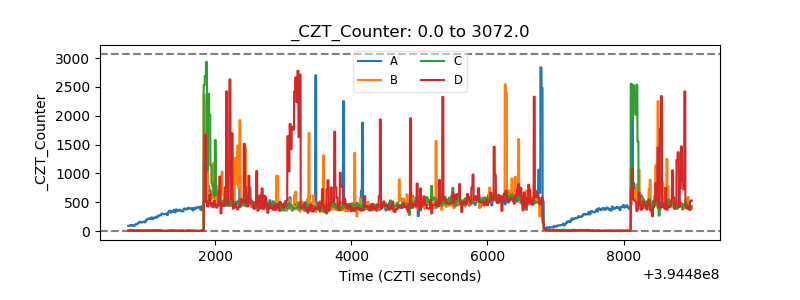 |
| +2.5 Volts monitor | 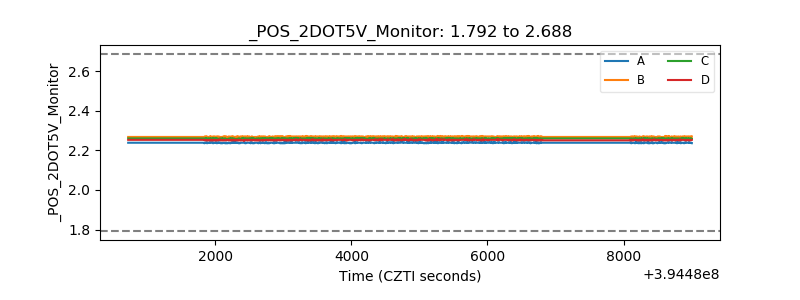 |
| +5 Volts monitor | 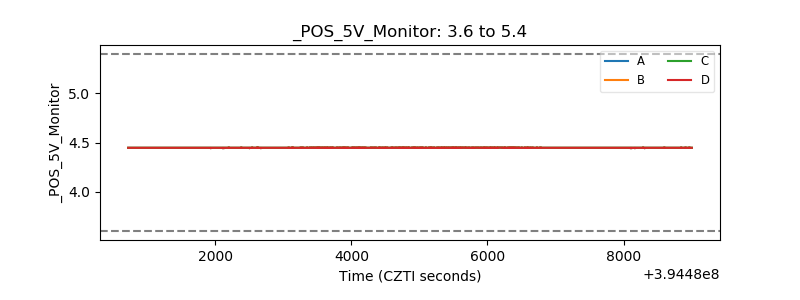 |
| _ROLL_ROT | 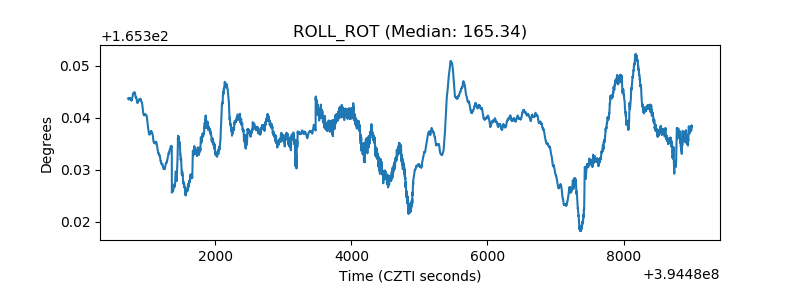 |
| _Roll_DEC | 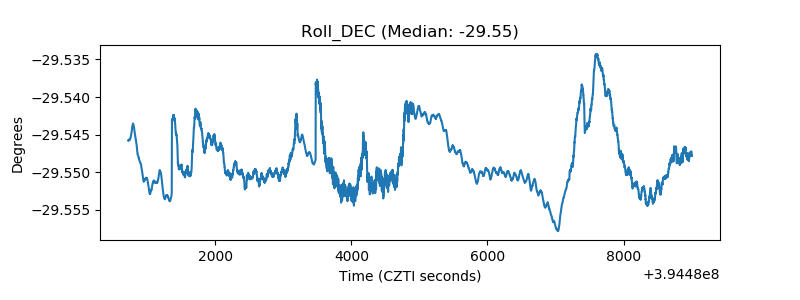 |
| _Roll_RA | 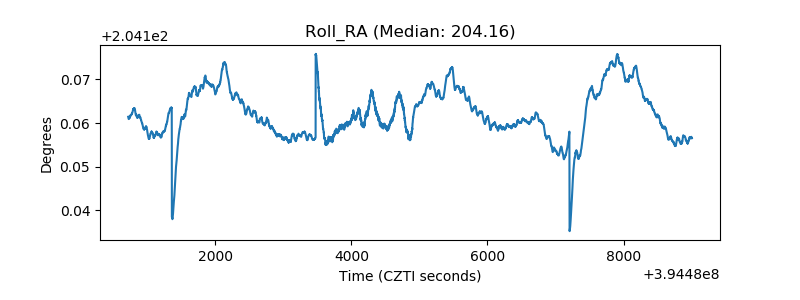 |
| Veto Counter | 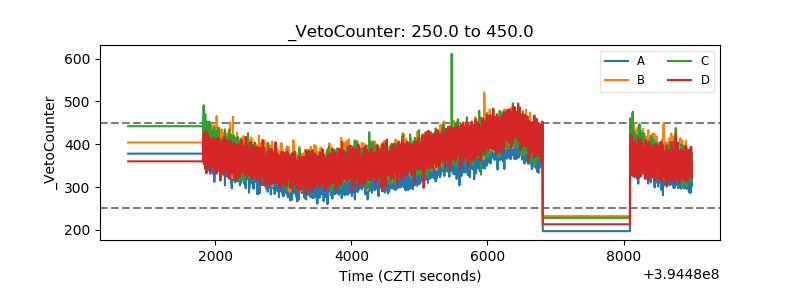 |