| Param | Original file | Final file |
|---|---|---|
| Filename | modeM0/AS1C07_001T09_9000005236_36700cztM0_level2.evt | modeM0/AS1C07_001T09_9000005236_36700cztM0_level2_quad_clean.evt |
| Size (bytes) | 460,457,280 | 108,745,920 |
| Size | 439.1 MB | 103.7 MB |
| Events in quadrant A | 2,864,221 | 740,198 |
| Events in quadrant B | 3,175,657 | 726,907 |
| Events in quadrant C | 3,447,767 | 719,253 |
| Events in quadrant D | 4,054,069 | 692,137 |
| Mode SS | |||
|---|---|---|---|
| Quadrant | BADHDUFLAG | Total packets | Discarded packets |
| A | 0 | 122 | 0 |
| B | 0 | 122 | 0 |
| C | 0 | 122 | 0 |
| D | 0 | 122 | 0 |
| Mode M9 | |||
|---|---|---|---|
| Quadrant | BADHDUFLAG | Total packets | Discarded packets |
| A | 0 | 18 | 0 |
| B | 0 | 18 | 0 |
| C | 0 | 18 | 0 |
| D | 0 | 19 | 0 |
| Mode M0 | |||
|---|---|---|---|
| Quadrant | BADHDUFLAG | Total packets | Discarded packets |
| A | 0 | 12381 | 3 |
| B | 0 | 13285 | 2 |
| C | 0 | 13872 | 2 |
| D | 0 | 16004 | 2 |
| Quadrant | Total seconds | Saturated seconds | Saturation percentage |
|---|---|---|---|
| A | 5935 | 16 | 0.269587% |
| B | 5935 | 67 | 1.128896% |
| C | 5935 | 124 | 2.089301% |
| D | 5935 | 247 | 4.161752% |
Noise dominated data is calculated using 1-second bins in cleaned event files. If a bin has >2000 counts, and if more than 50% of those come from <1% of pixels, then it is considered to be noise-dominated and hence unusable.
| Quadrant | # 1 sec bins | Bins with >0 counts | Bins with >2000 counts | High rate bins dominated by noise | Noise dominated (total time) | Noise dominated (detector-on time) | Marked lightcurve |
|---|---|---|---|---|---|---|---|
| A | 7279 | 5936 | 1 | 1 | 0.01% | 0.02% | 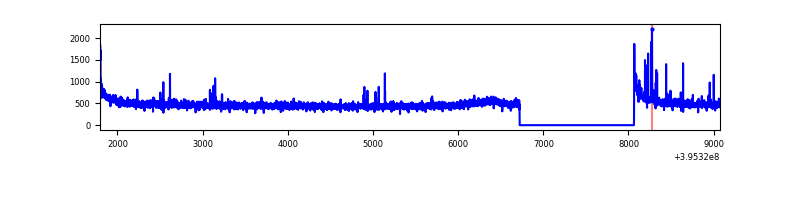 |
| B | 7279 | 5936 | 46 | 46 | 0.63% | 0.77% | 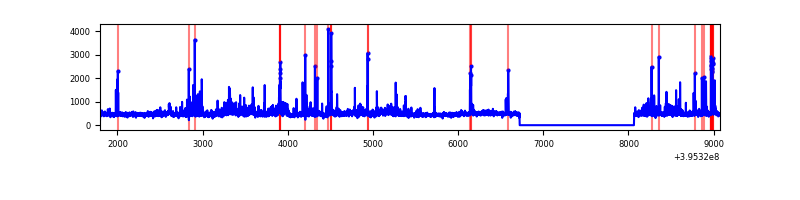 |
| C | 7279 | 5936 | 104 | 104 | 1.43% | 1.75% | 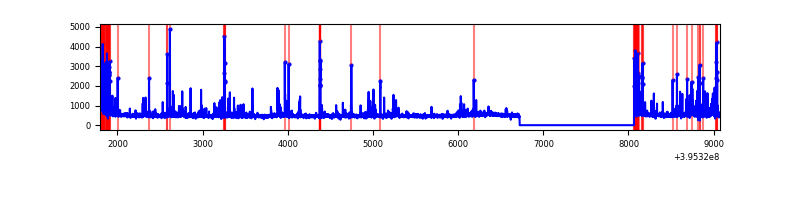 |
| D | 7279 | 5936 | 213 | 213 | 2.93% | 3.59% | 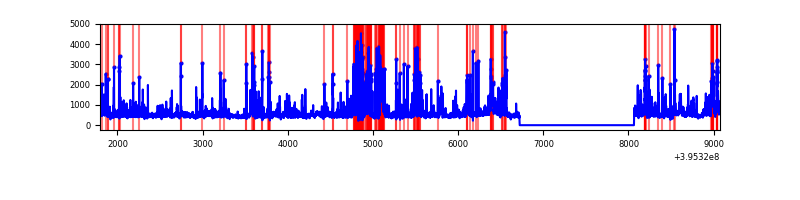 |
Top three noisy pixels from each quadrant. If the there are fewer than three noisy pixels in the level2.evt file, extra rows are filled as -1
| Pixel properties | Quadrant properties | ||||||
|---|---|---|---|---|---|---|---|
| Quadrant | DetID | PixID | Counts | Sigma | Mean | Median | Sigma |
| A | 10 | 83 | 242376 | 1827.28 | 660 | 646 | 132.3 |
| A | 9 | 143 | 31968 | 236.77 | 660 | 646 | 132.3 |
| A | 13 | 6 | 21081 | 154.47 | 660 | 646 | 132.3 |
| B | 5 | 255 | 159443 | 1302.53 | 650 | 635 | 121.9 |
| B | 0 | 197 | 103811 | 846.24 | 650 | 635 | 121.9 |
| B | 5 | 200 | 74002 | 601.75 | 650 | 635 | 121.9 |
| C | 0 | 10 | 372088 | 2525.51 | 636 | 640 | 147.1 |
| C | 14 | 254 | 278742 | 1890.85 | 636 | 640 | 147.1 |
| C | 15 | 214 | 270607 | 1835.53 | 636 | 640 | 147.1 |
| D | 12 | 233 | 493944 | 3148.23 | 636 | 617 | 156.7 |
| D | 13 | 249 | 285424 | 1817.53 | 636 | 617 | 156.7 |
| D | 14 | 52 | 149751 | 951.72 | 636 | 617 | 156.7 |
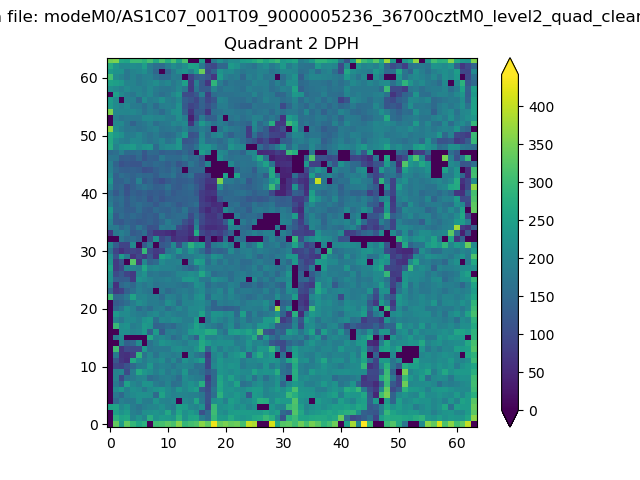
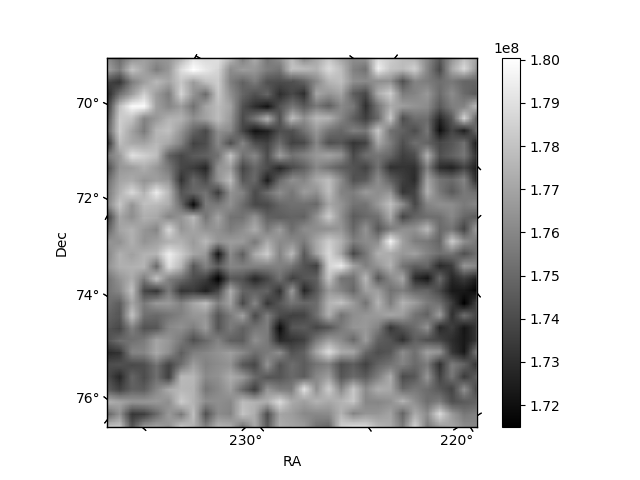
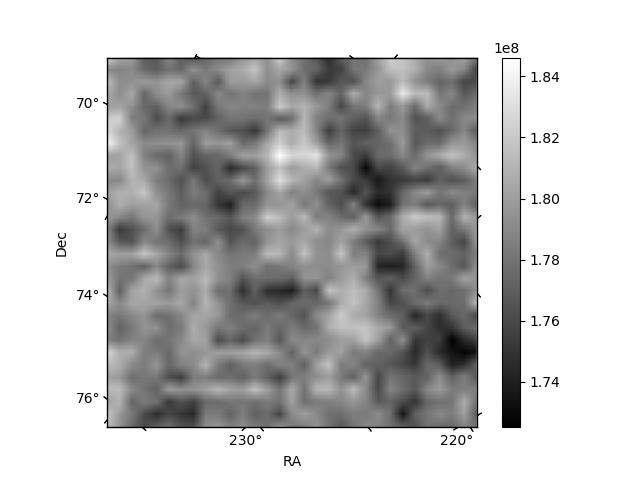
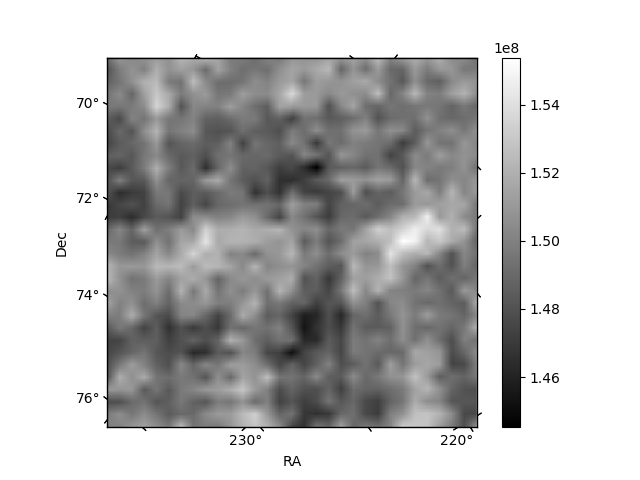
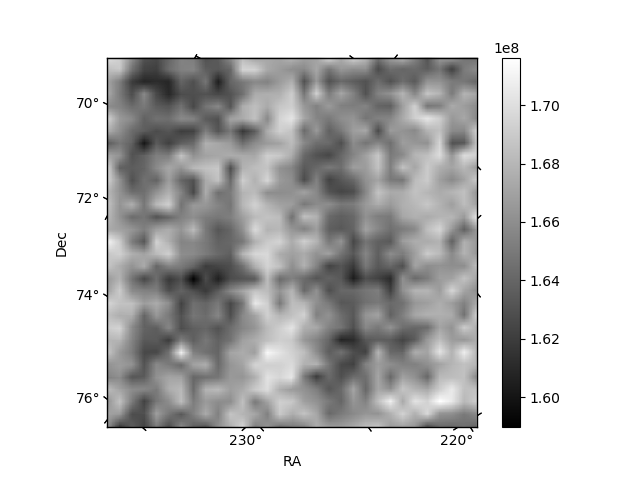
Histogram calculated using DETX and DETY for each event in the final _common_clean file
| Quadrant A | 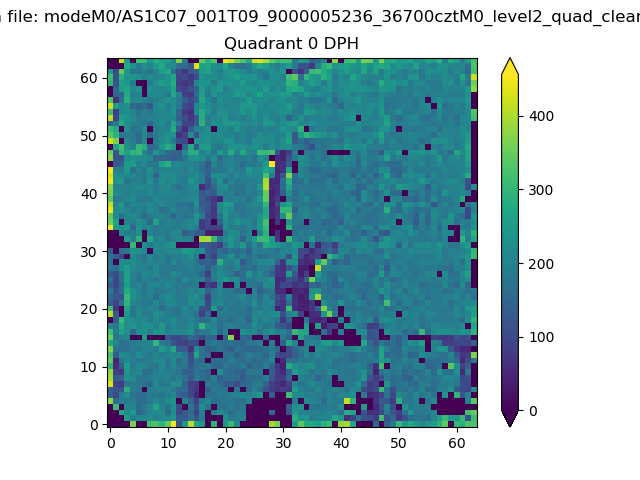 |
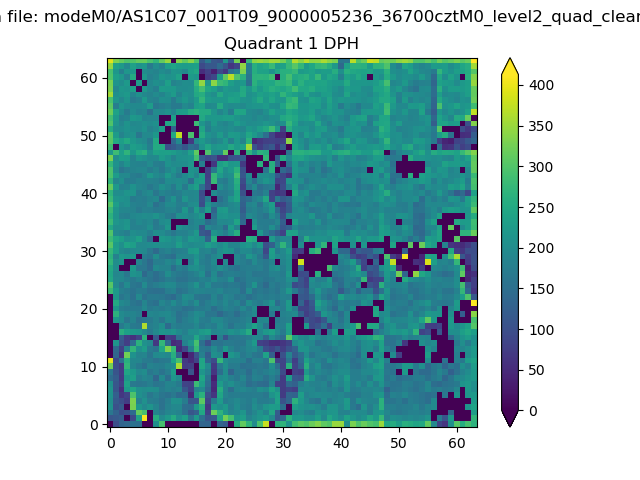 |
Quadrant B |
|---|---|---|---|
| Quadrant D | 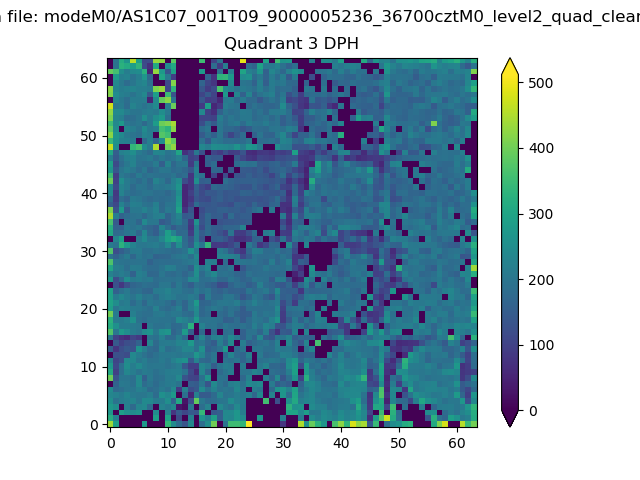 |
 |
Quadrant C |
| Plot type | Count rate plots | Images |
|---|---|---|
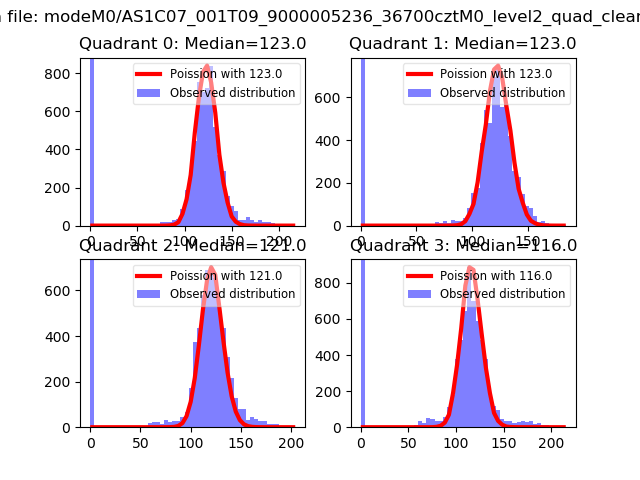
| Comparison with Poisson distribution Blue bars denote a histogram of data divided into 1 sec bins. Red curve is a Poisson curve with rate = median count rate of data. |
 |
 |
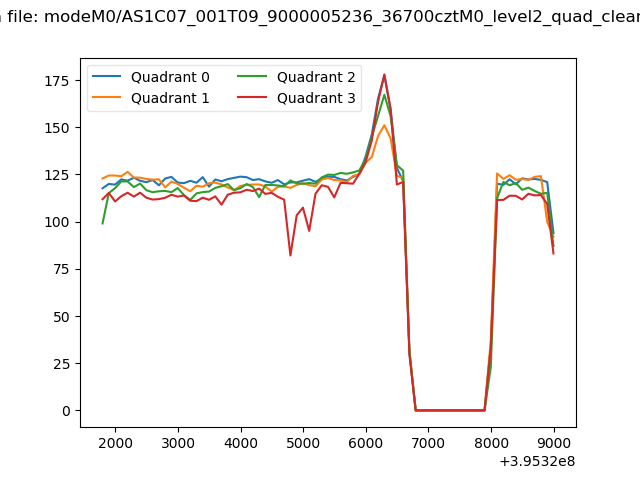
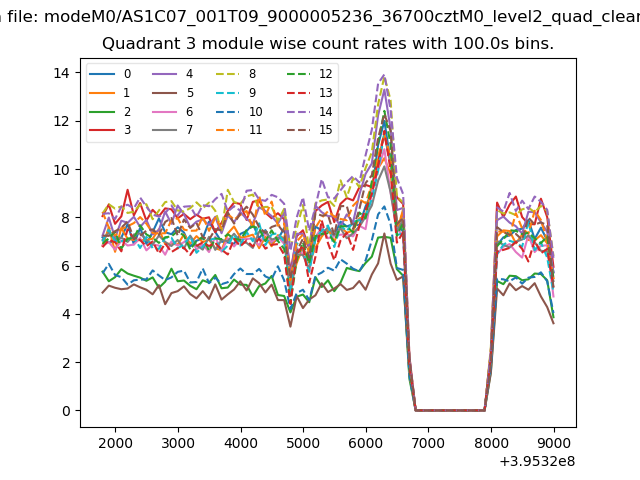
| Quadrant-wise count rates Data is divided into 100 sec bins |
 |
|
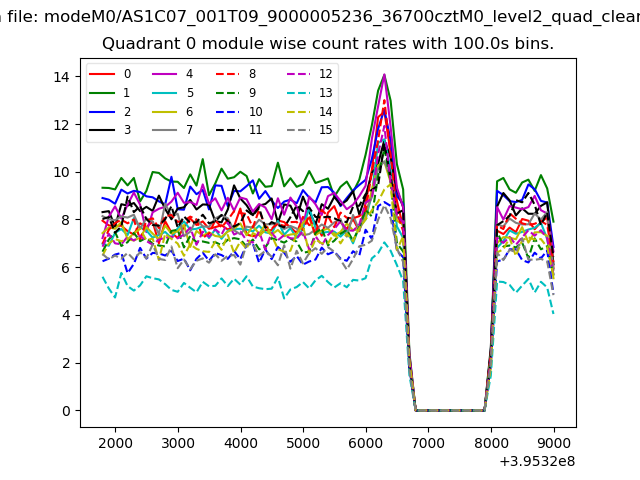
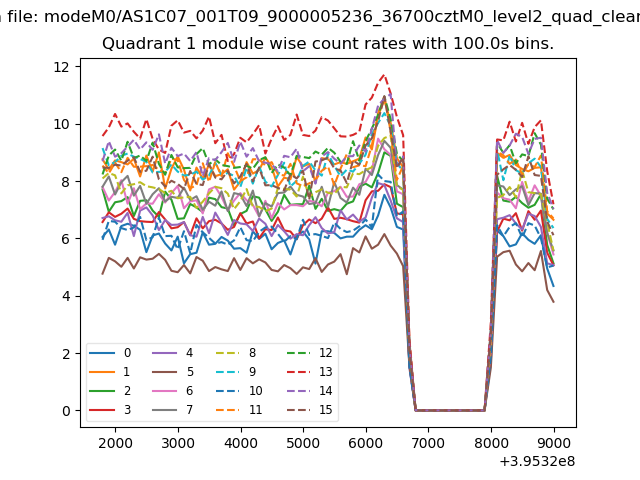
| Module-wise count rates for Quadrant A Data is divided into 100 sec bins |
 |
 |
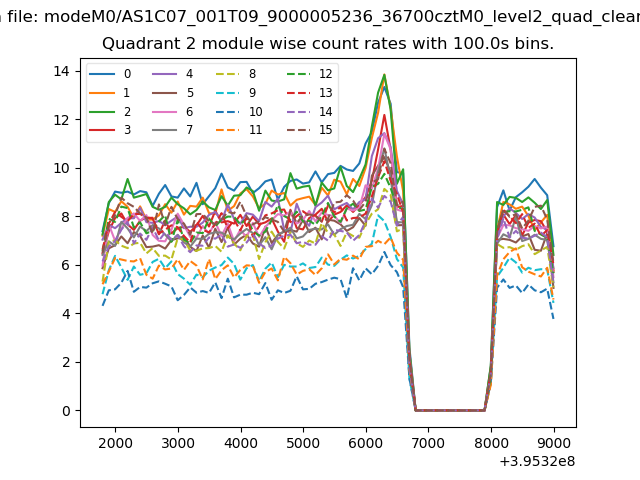
| Module-wise count rates for Quadrant B Data is divided into 100 sec bins |
 |
 |
| Module-wise count rates for Quadrant C Data is divided into 100 sec bins |
 |
 |
| Module-wise count rates for Quadrant D Data is divided into 100 sec bins |
 |
 |
| Parameter | Plot |
|---|---|
| CZT HV Monitor | 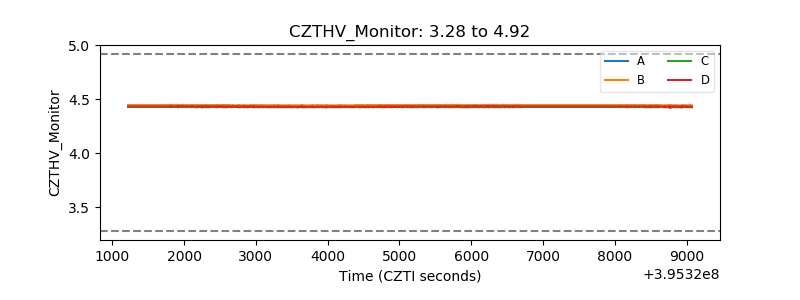 |
| D_VDD | 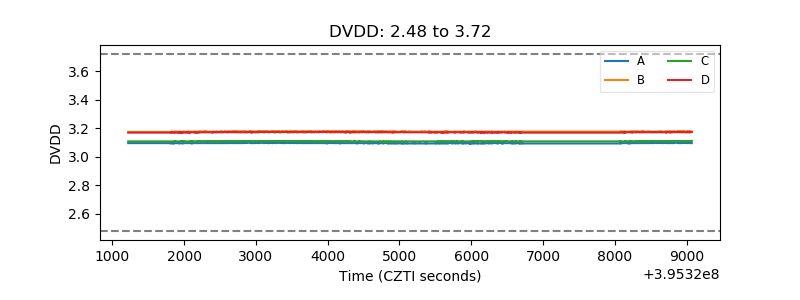 |
| Temperature 1 | 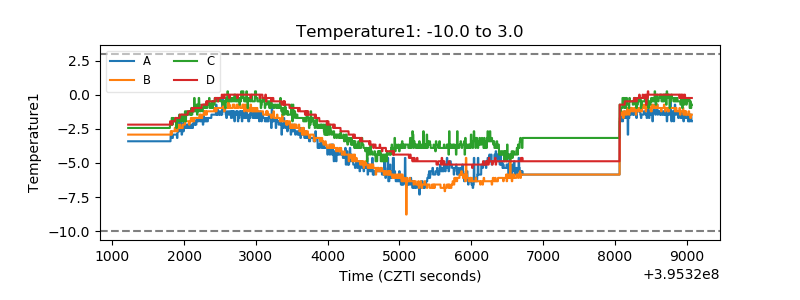 |
| Veto HV Monitor | 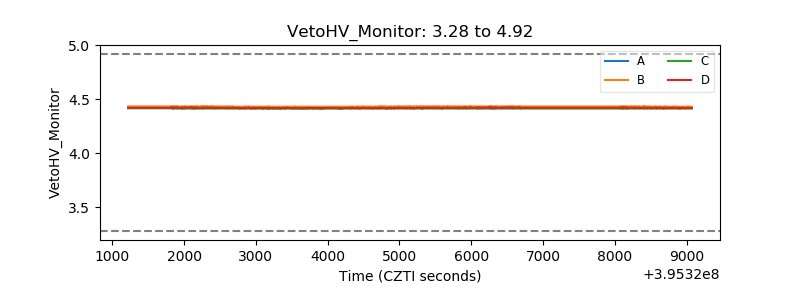 |
| Veto LLD | 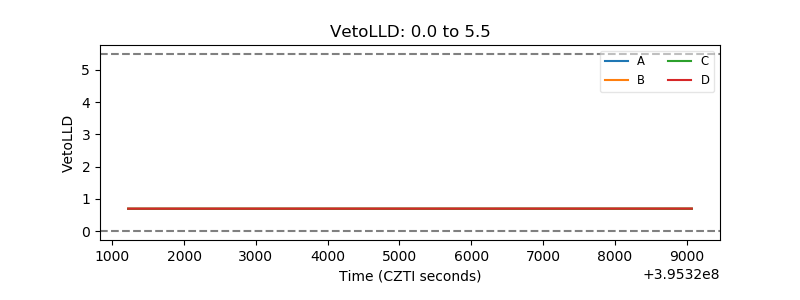 |
| Alpha Counter | 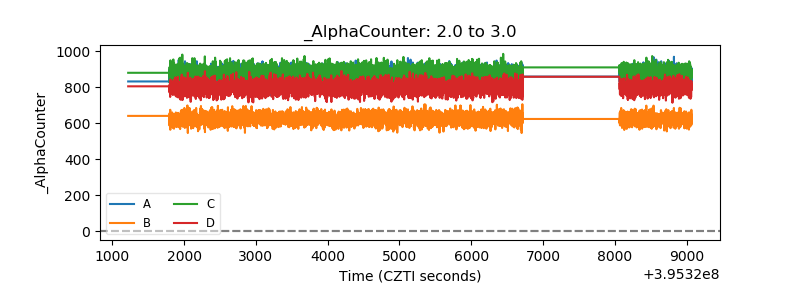 |
| _CPM_Rate | 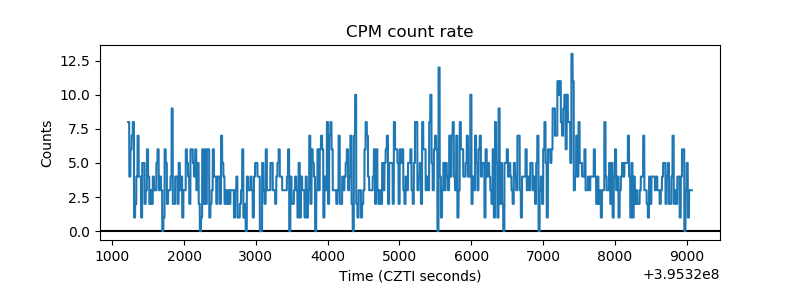 |
| CZT Counter | 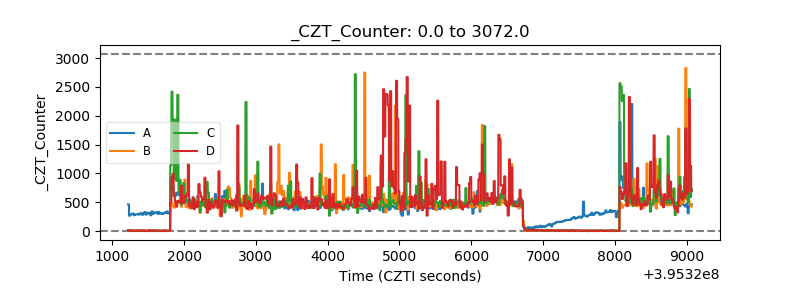 |
| +2.5 Volts monitor |  |
| +5 Volts monitor | 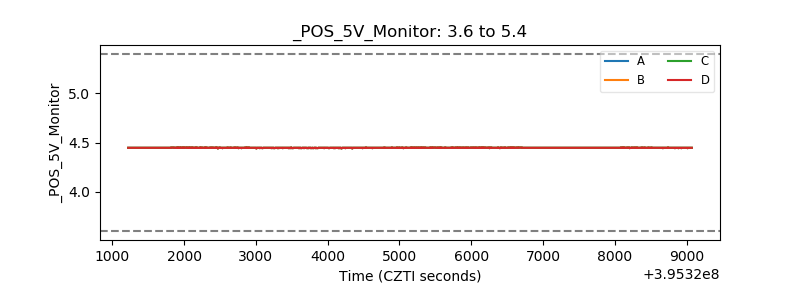 |
| _ROLL_ROT | 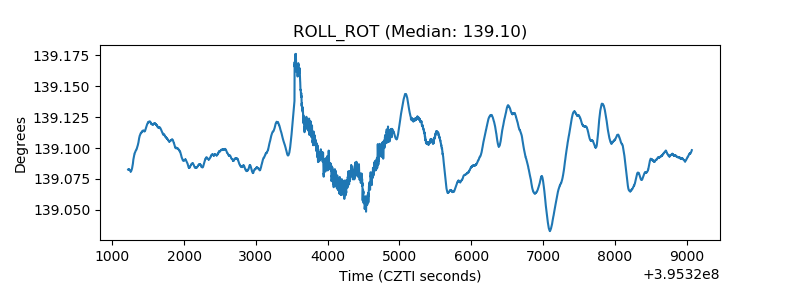 |
| _Roll_DEC | 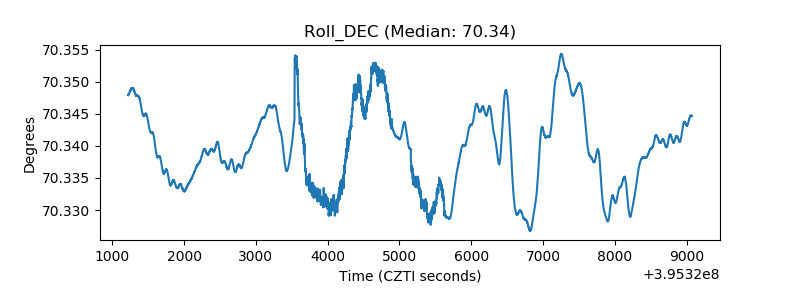 |
| _Roll_RA | 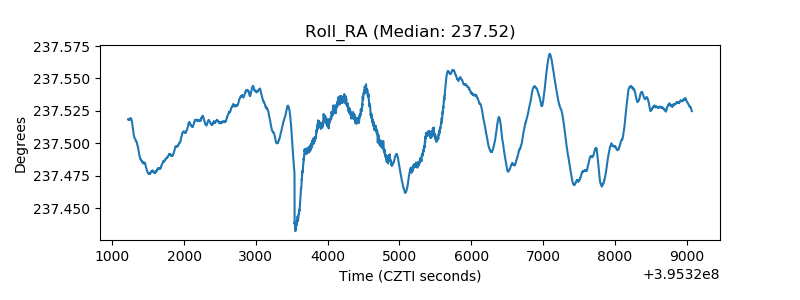 |
| Veto Counter | 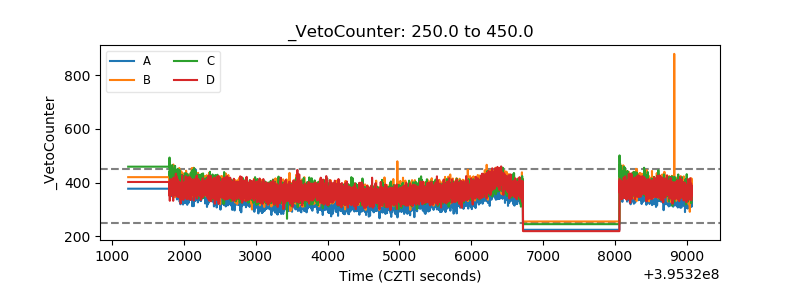 |