| Param | Original file | Final file |
|---|---|---|
| Filename | modeM0/AS1A11_083T01_9000005242_36785cztM0_level2.evt | modeM0/AS1A11_083T01_9000005242_36785cztM0_level2_quad_clean.evt |
| Size (bytes) | 611,320,320 | 64,595,520 |
| Size | 583.0 MB | 61.6 MB |
| Events in quadrant A | 2,599,152 | 485,420 |
| Events in quadrant B | 9,708,407 | 175,993 |
| Events in quadrant C | 2,858,822 | 475,846 |
| Events in quadrant D | 2,995,832 | 453,911 |
| Mode SS | |||
|---|---|---|---|
| Quadrant | BADHDUFLAG | Total packets | Discarded packets |
| A | 0 | 106 | 0 |
| B | 0 | 106 | 0 |
| C | 0 | 106 | 0 |
| D | 0 | 106 | 0 |
| Mode M9 | |||
|---|---|---|---|
| Quadrant | BADHDUFLAG | Total packets | Discarded packets |
| A | 0 | 24 | 0 |
| B | 0 | 24 | 0 |
| C | 0 | 24 | 0 |
| D | 0 | 25 | 0 |
| Mode M0 | |||
|---|---|---|---|
| Quadrant | BADHDUFLAG | Total packets | Discarded packets |
| A | 0 | 10795 | 3 |
| B | 0 | 32255 | 2 |
| C | 0 | 11493 | 2 |
| D | 0 | 12195 | 2 |
| Quadrant | Total seconds | Saturated seconds | Saturation percentage |
|---|---|---|---|
| A | 5184 | 9 | 0.173611% |
| B | 5184 | 3274 | 63.155864% |
| C | 5184 | 51 | 0.983796% |
| D | 5184 | 51 | 0.983796% |
Noise dominated data is calculated using 1-second bins in cleaned event files. If a bin has >2000 counts, and if more than 50% of those come from <1% of pixels, then it is considered to be noise-dominated and hence unusable.
| Quadrant | # 1 sec bins | Bins with >0 counts | Bins with >2000 counts | High rate bins dominated by noise | Noise dominated (total time) | Noise dominated (detector-on time) | Marked lightcurve |
|---|---|---|---|---|---|---|---|
| A | 7067 | 5185 | 0 | 0 | 0.00% | 0.00% | 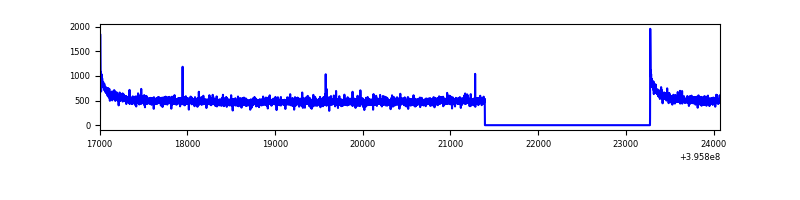 |
| B | 7067 | 5185 | 3092 | 3092 | 43.75% | 59.63% | 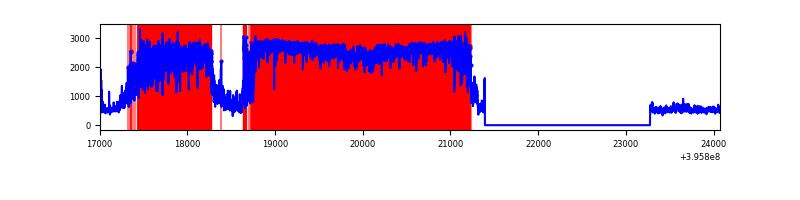 |
| C | 7067 | 5185 | 42 | 42 | 0.59% | 0.81% | 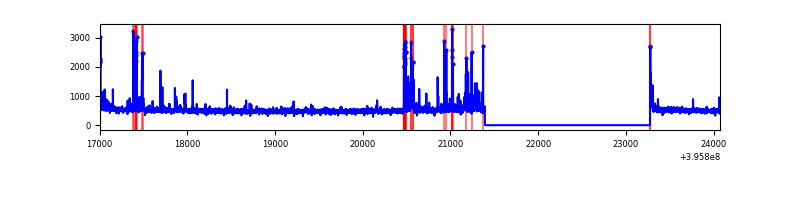 |
| D | 7067 | 5185 | 53 | 53 | 0.75% | 1.02% | 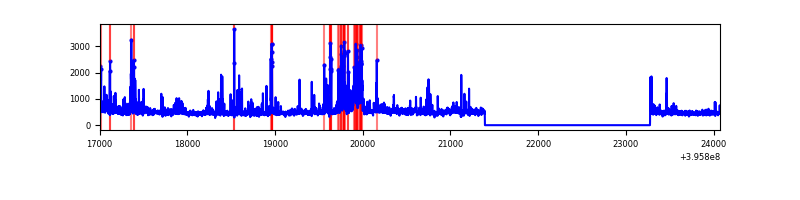 |
Top three noisy pixels from each quadrant. If the there are fewer than three noisy pixels in the level2.evt file, extra rows are filled as -1
| Pixel properties | Quadrant properties | ||||||
|---|---|---|---|---|---|---|---|
| Quadrant | DetID | PixID | Counts | Sigma | Mean | Median | Sigma |
| A | 10 | 83 | 220638 | 1768.12 | 611 | 600 | 124.4 |
| A | 13 | 6 | 12226 | 93.42 | 611 | 600 | 124.4 |
| A | 13 | 254 | 8382 | 62.53 | 611 | 600 | 124.4 |
| B | 12 | 1 | 8194959 | 123731.1 | 339 | 331 | 66.2 |
| B | 4 | 171 | 67657 | 1016.56 | 339 | 331 | 66.2 |
| B | 0 | 190 | 33372 | 498.89 | 339 | 331 | 66.2 |
| C | 0 | 207 | 244201 | 1789.94 | 586 | 591 | 136.1 |
| C | 15 | 214 | 243257 | 1783.0 | 586 | 591 | 136.1 |
| C | 0 | 10 | 46732 | 339.02 | 586 | 591 | 136.1 |
| D | 13 | 249 | 191715 | 1321.64 | 589 | 572 | 144.6 |
| D | 12 | 227 | 171693 | 1183.2 | 589 | 572 | 144.6 |
| D | 12 | 6 | 130357 | 897.38 | 589 | 572 | 144.6 |
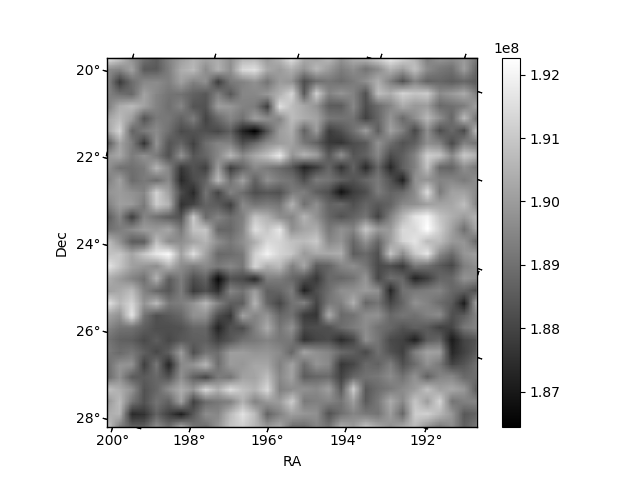
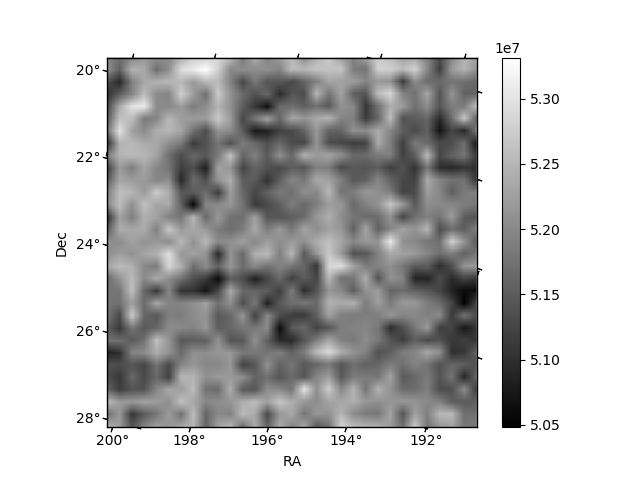
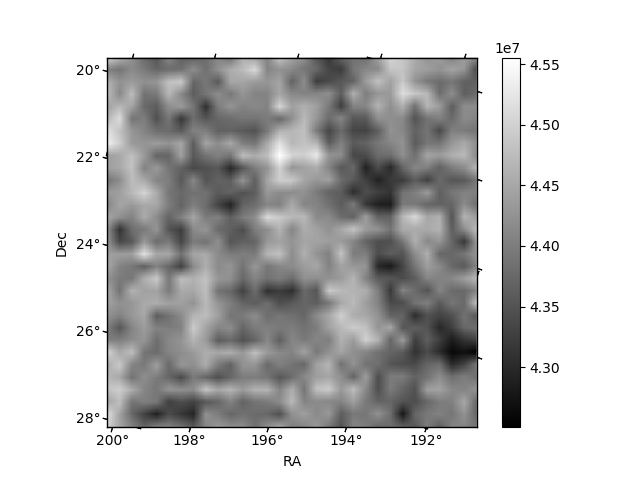
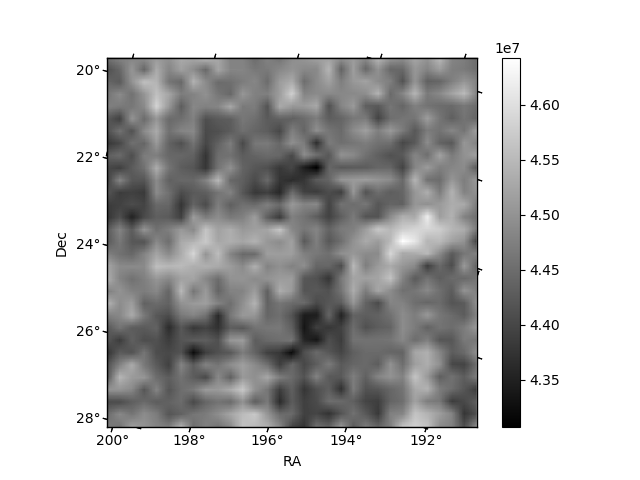
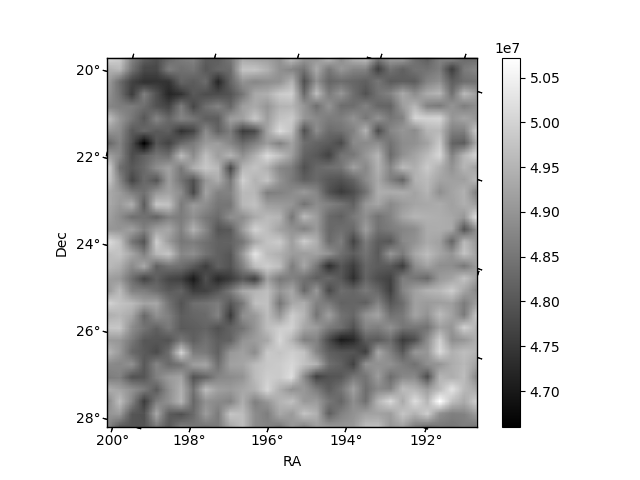
Histogram calculated using DETX and DETY for each event in the final _common_clean file
| Quadrant A | 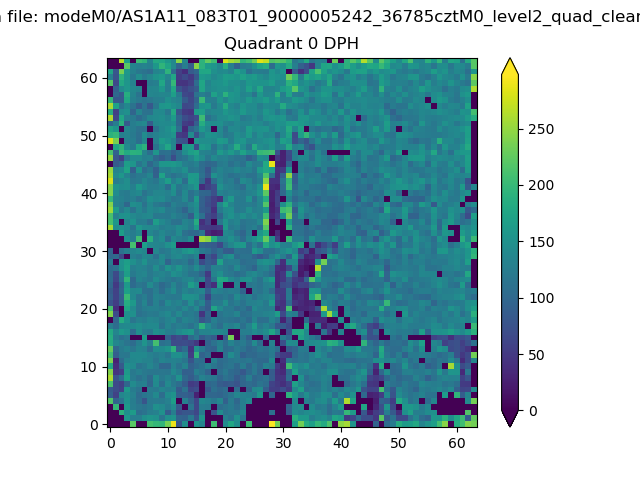 |
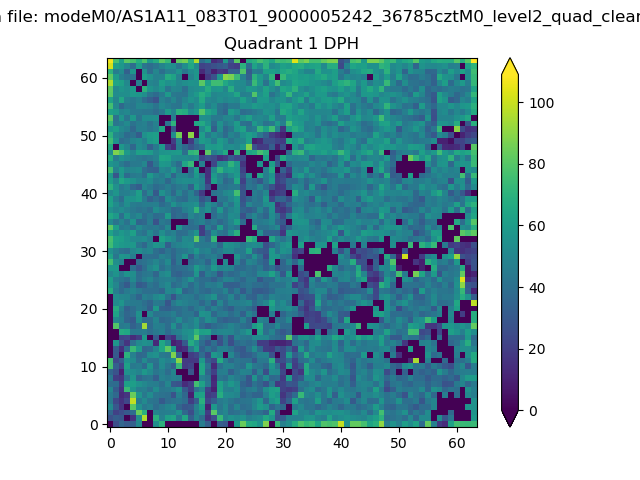 |
Quadrant B |
|---|---|---|---|
| Quadrant D | 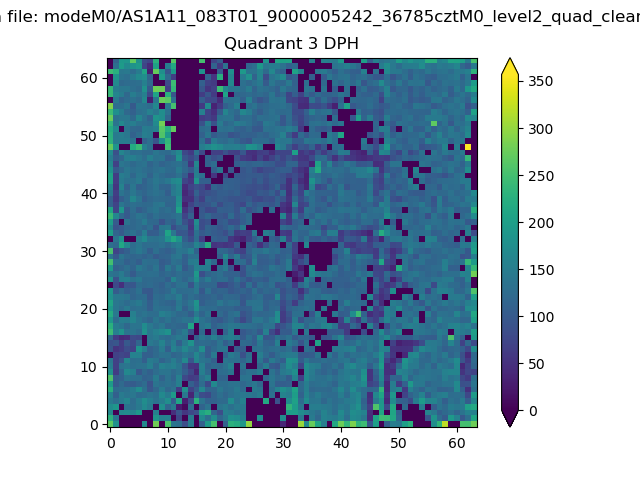 |
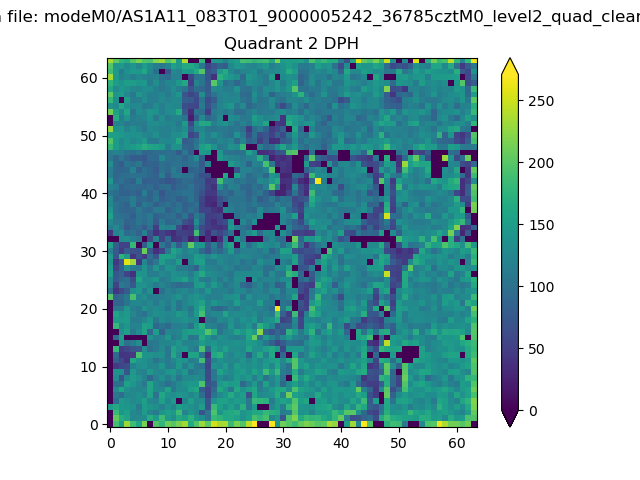 |
Quadrant C |
| Plot type | Count rate plots | Images |
|---|---|---|
| Comparison with Poisson distribution Blue bars denote a histogram of data divided into 1 sec bins. Red curve is a Poisson curve with rate = median count rate of data. |
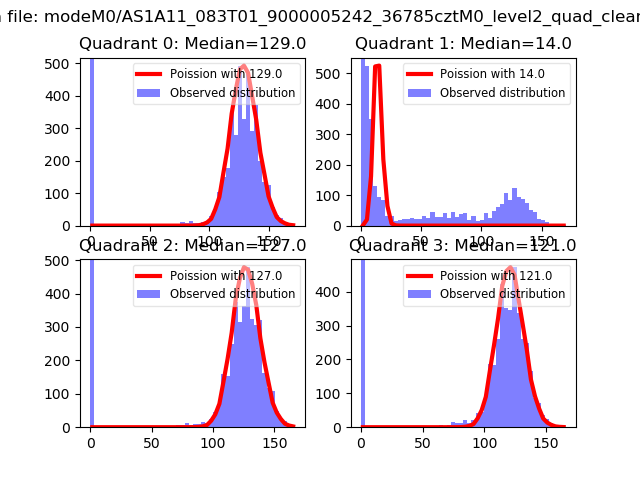 |
 |
| Quadrant-wise count rates Data is divided into 100 sec bins |
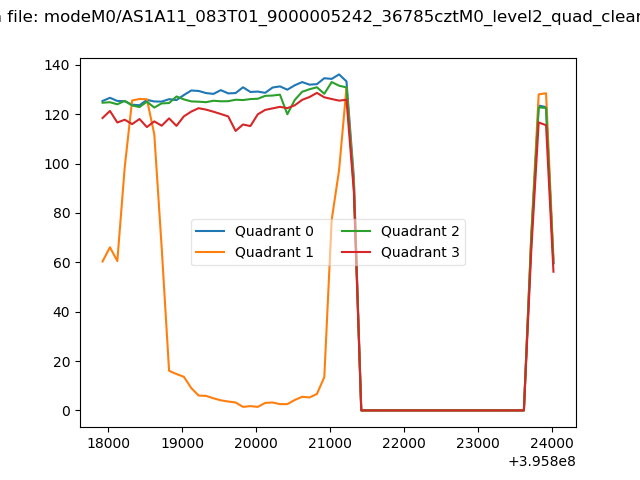 |
|
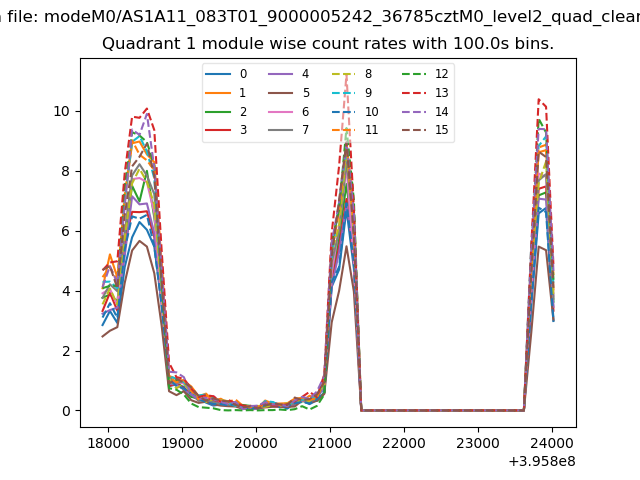
| Module-wise count rates for Quadrant A Data is divided into 100 sec bins |
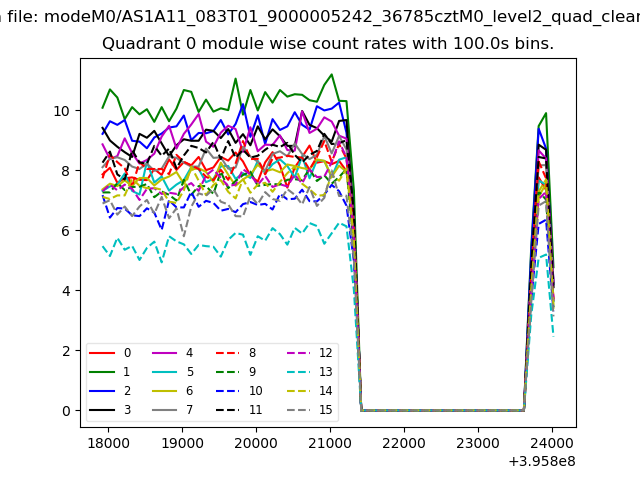 |
 |
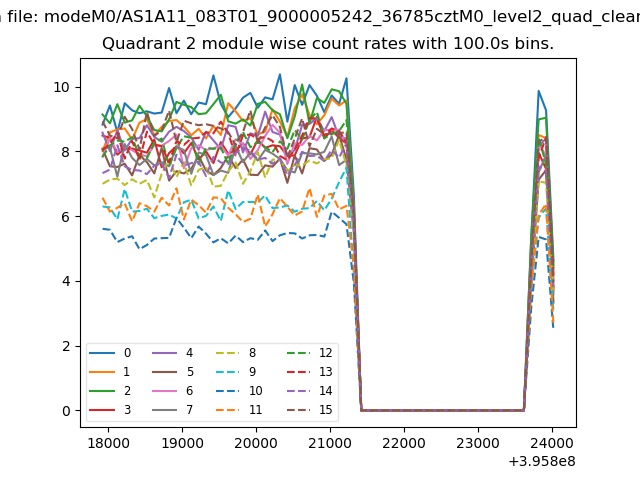
| Module-wise count rates for Quadrant B Data is divided into 100 sec bins |
 |
 |
| Module-wise count rates for Quadrant C Data is divided into 100 sec bins |
 |
 |
| Module-wise count rates for Quadrant D Data is divided into 100 sec bins |
 |
 |
| Parameter | Plot |
|---|---|
| CZT HV Monitor | 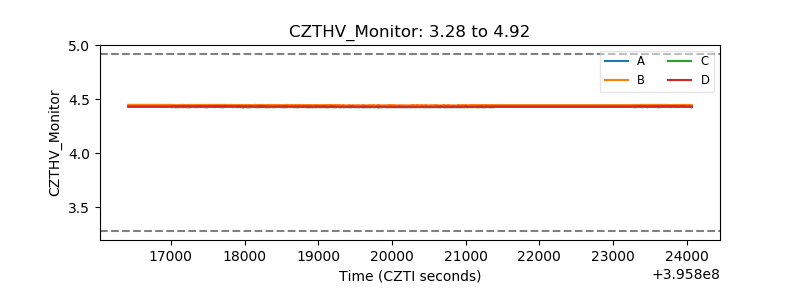 |
| D_VDD | 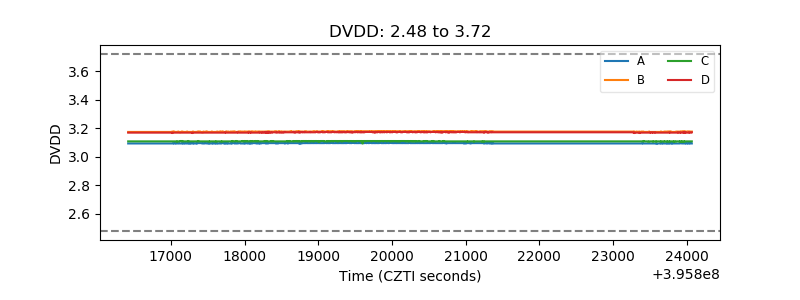 |
| Temperature 1 | 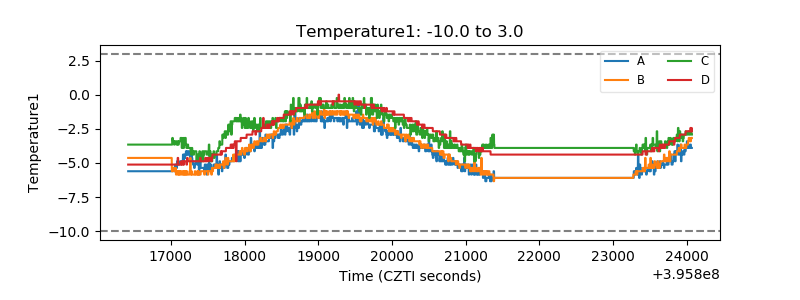 |
| Veto HV Monitor | 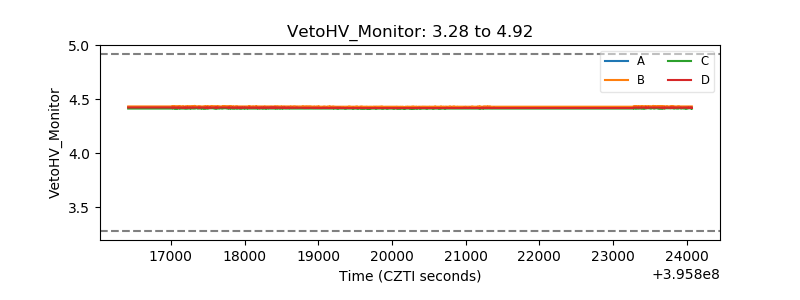 |
| Veto LLD | 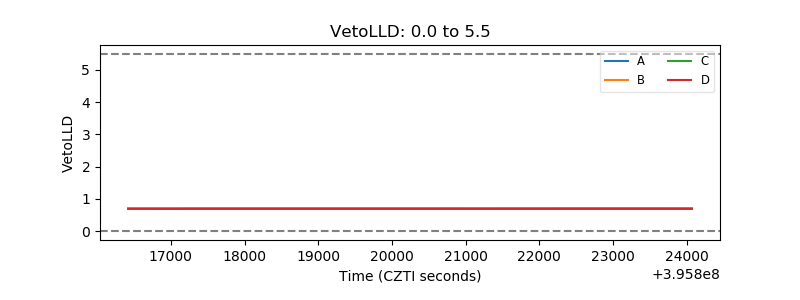 |
| Alpha Counter | 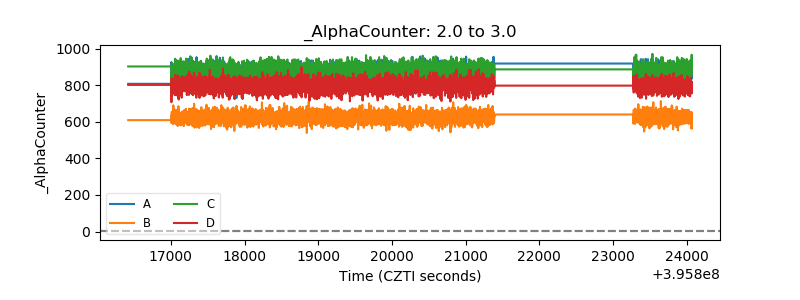 |
| _CPM_Rate | 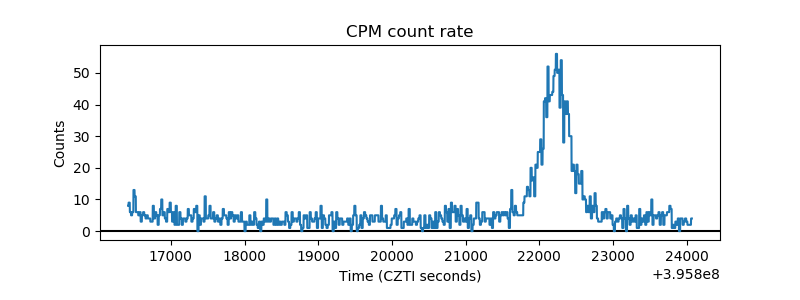 |
| CZT Counter | 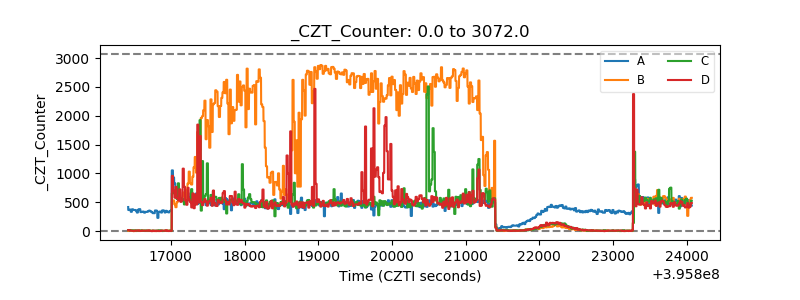 |
| +2.5 Volts monitor | 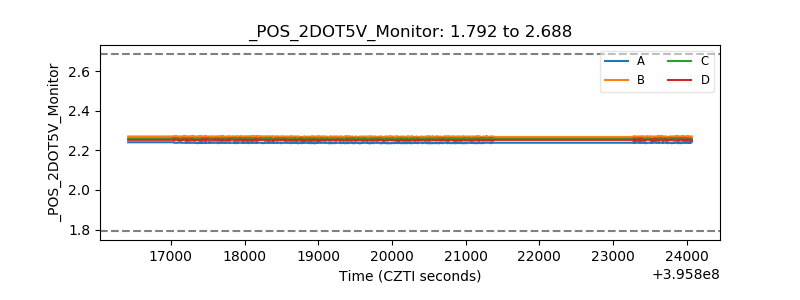 |
| +5 Volts monitor | 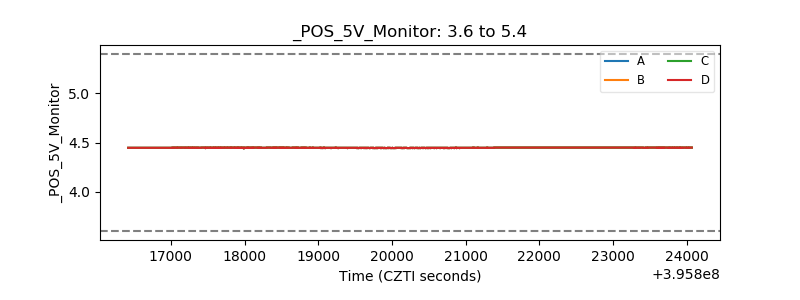 |
| _ROLL_ROT | 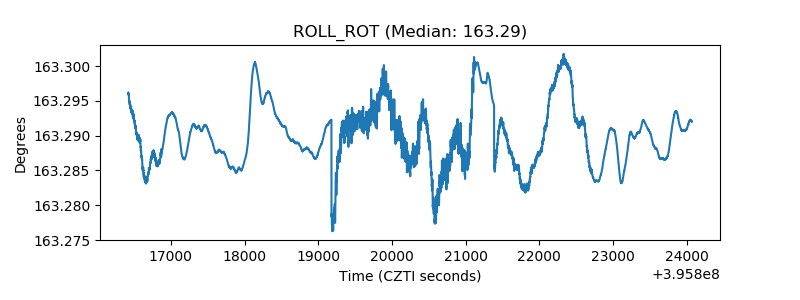 |
| _Roll_DEC | 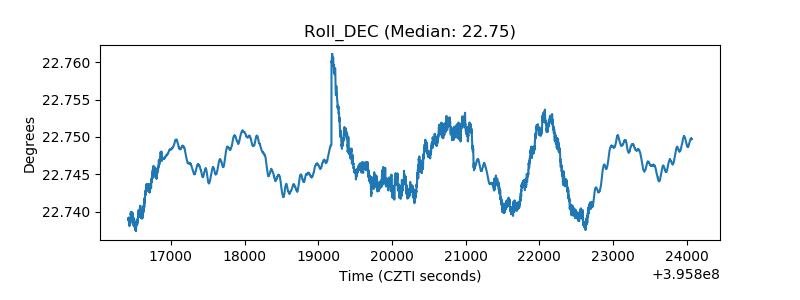 |
| _Roll_RA | 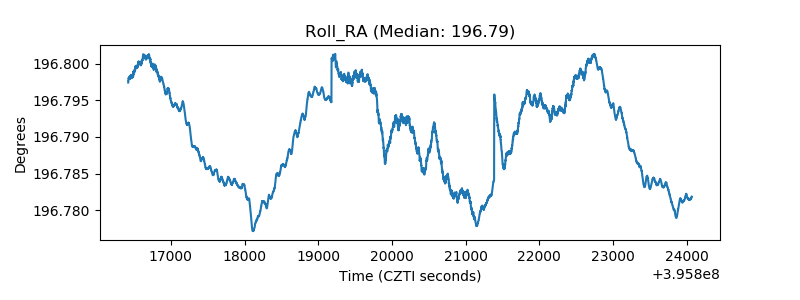 |
| Veto Counter | 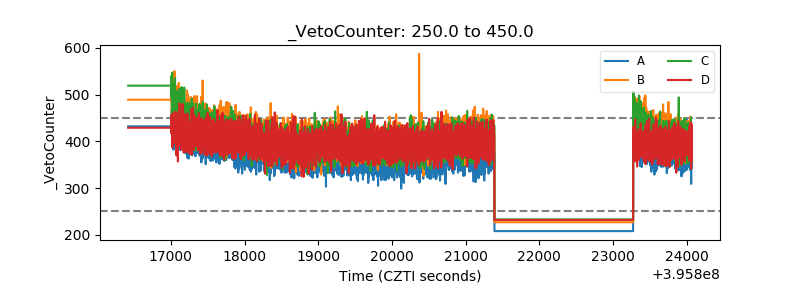 |