| Param | Original file | Final file |
|---|---|---|
| Filename | modeM0/AS1C07_010T01_9000005246_36913cztM0_level2.evt | modeM0/AS1C07_010T01_9000005246_36913cztM0_level2_quad_clean.evt |
| Size (bytes) | 303,073,920 | 63,028,800 |
| Size | 289.0 MB | 60.1 MB |
| Events in quadrant A | 2,733,908 | 525,221 |
| Events in quadrant B | 733,562 | 7,017 |
| Events in quadrant C | 2,723,117 | 529,498 |
| Events in quadrant D | 2,649,713 | 501,842 |
| Mode SS | |||
|---|---|---|---|
| Quadrant | BADHDUFLAG | Total packets | Discarded packets |
| A | 0 | 100 | 0 |
| B | 0 | 100 | 0 |
| C | 0 | 100 | 0 |
| D | 0 | 100 | 0 |
| Mode M9 | |||
|---|---|---|---|
| Quadrant | BADHDUFLAG | Total packets | Discarded packets |
| A | 0 | 38 | 0 |
| B | 0 | 38 | 0 |
| C | 0 | 38 | 0 |
| D | 0 | 39 | 0 |
| Mode M0 | |||
|---|---|---|---|
| Quadrant | BADHDUFLAG | Total packets | Discarded packets |
| A | 0 | 11175 | 3 |
| B | 0 | 4925 | 2 |
| C | 0 | 10836 | 2 |
| D | 0 | 11134 | 2 |
| Quadrant | Total seconds | Saturated seconds | Saturation percentage |
|---|---|---|---|
| A | 4887 | 80 | 1.636996% |
| B | 4887 | 4887 | 100.000000% |
| C | 4887 | 74 | 1.514221% |
| D | 4887 | 83 | 1.698383% |
Noise dominated data is calculated using 1-second bins in cleaned event files. If a bin has >2000 counts, and if more than 50% of those come from <1% of pixels, then it is considered to be noise-dominated and hence unusable.
| Quadrant | # 1 sec bins | Bins with >0 counts | Bins with >2000 counts | High rate bins dominated by noise | Noise dominated (total time) | Noise dominated (detector-on time) | Marked lightcurve |
|---|---|---|---|---|---|---|---|
| A | 7010 | 4888 | 60 | 60 | 0.86% | 1.23% | 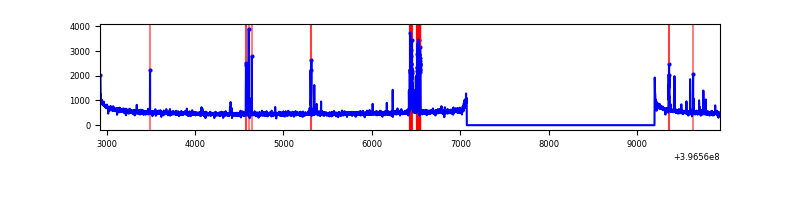 |
| B | 7009 | 4886 | 0 | 0 | 0.00% | 0.00% | 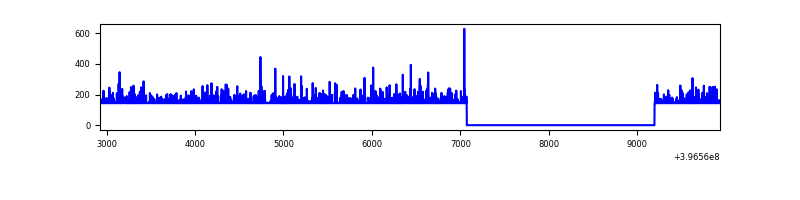 |
| C | 7010 | 4888 | 58 | 58 | 0.83% | 1.19% | 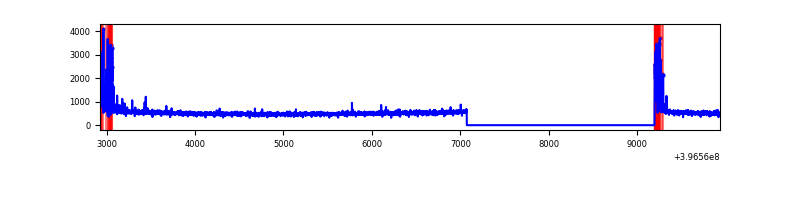 |
| D | 7010 | 4888 | 67 | 67 | 0.96% | 1.37% | 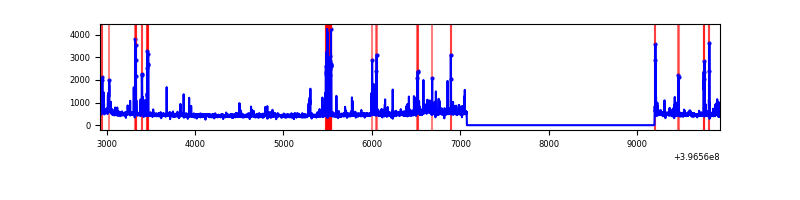 |
Top three noisy pixels from each quadrant. If the there are fewer than three noisy pixels in the level2.evt file, extra rows are filled as -1
| Pixel properties | Quadrant properties | ||||||
|---|---|---|---|---|---|---|---|
| Quadrant | DetID | PixID | Counts | Sigma | Mean | Median | Sigma |
| A | 9 | 143 | 263267 | 2281.87 | 578 | 567 | 115.1 |
| A | 10 | 83 | 210465 | 1823.22 | 578 | 567 | 115.1 |
| A | 13 | 6 | 13164 | 109.42 | 578 | 567 | 115.1 |
| B | 12 | 243 | 679505 | 193183.45 | 9 | 9 | 3.5 |
| B | 12 | 144 | 12483 | 3546.41 | 9 | 9 | 3.5 |
| B | 5 | 255 | 1479 | 417.93 | 9 | 9 | 3.5 |
| C | 0 | 10 | 235459 | 1768.76 | 578 | 585 | 132.8 |
| C | 15 | 214 | 210552 | 1581.2 | 578 | 585 | 132.8 |
| C | 0 | 207 | 14742 | 106.61 | 578 | 585 | 132.8 |
| D | 13 | 171 | 276238 | 1977.84 | 572 | 559 | 139.4 |
| D | 2 | 153 | 66235 | 471.19 | 572 | 559 | 139.4 |
| D | 13 | 249 | 48969 | 347.31 | 572 | 559 | 139.4 |
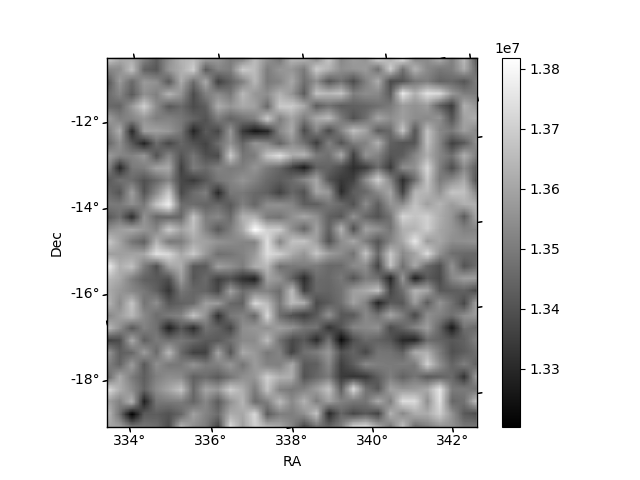
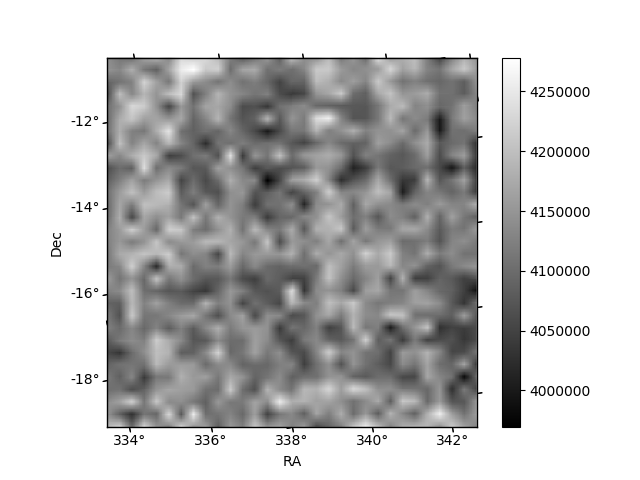
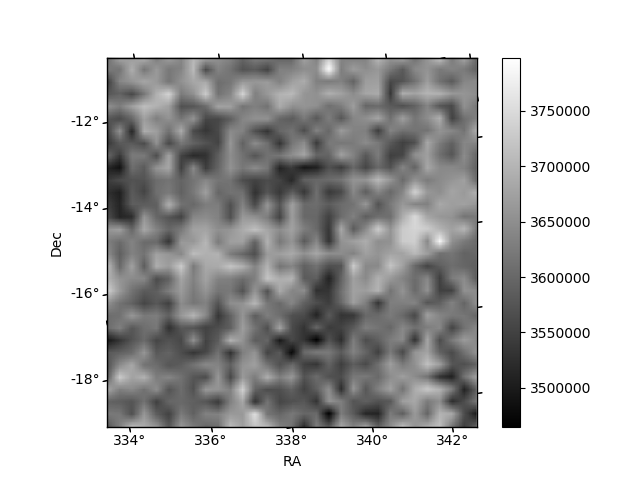
Histogram calculated using DETX and DETY for each event in the final _common_clean file
| Quadrant A | 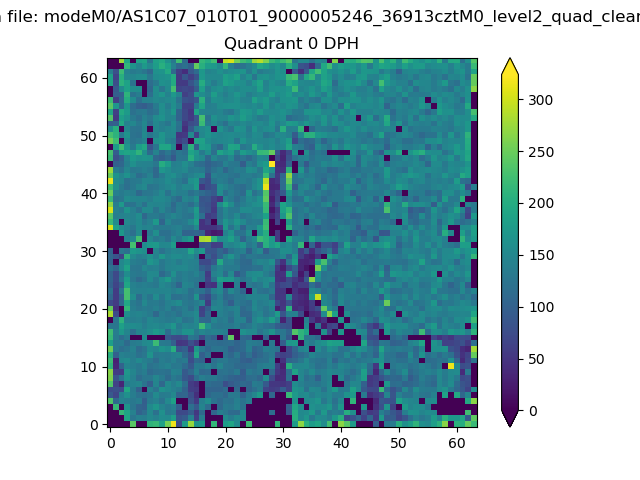 |
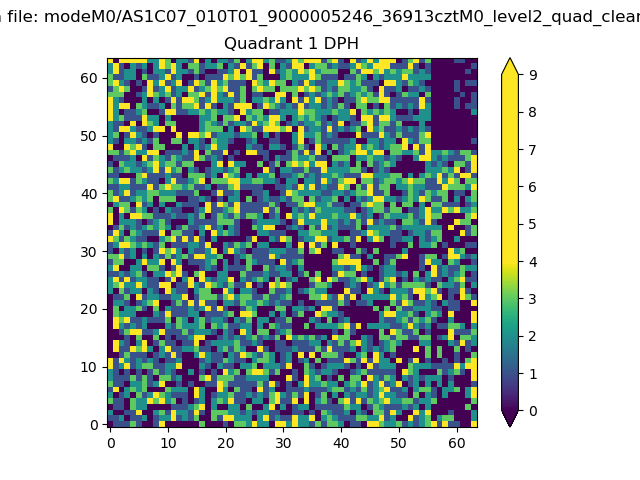 |
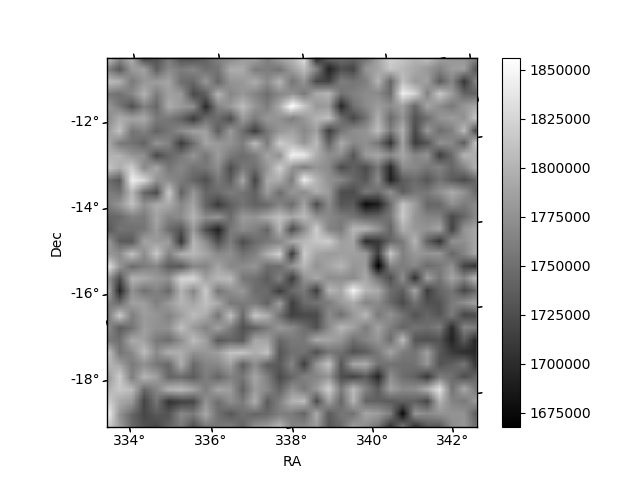
Quadrant B |
|---|---|---|---|
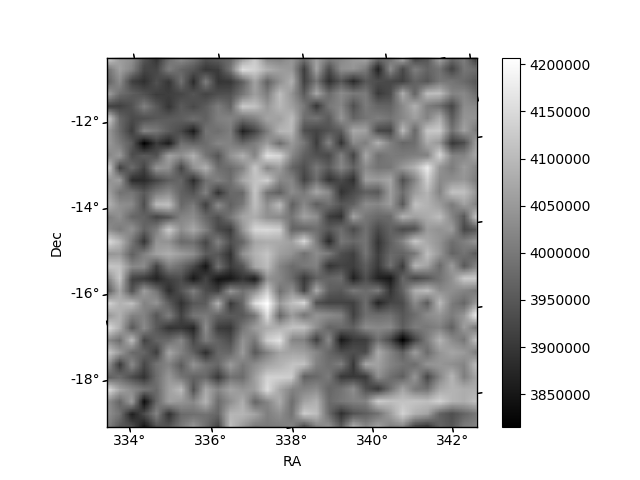
| Quadrant D | 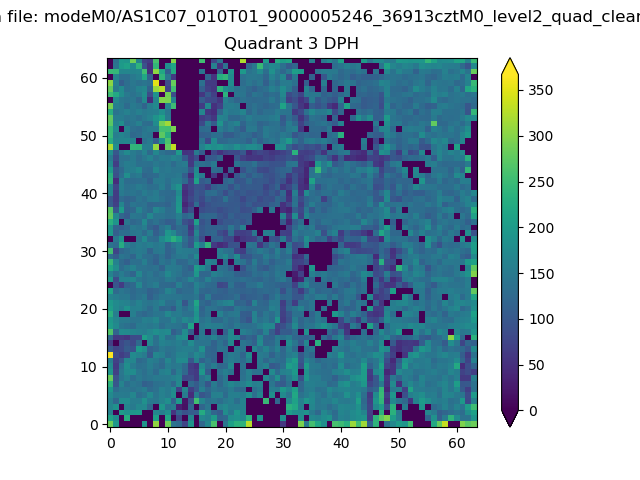 |
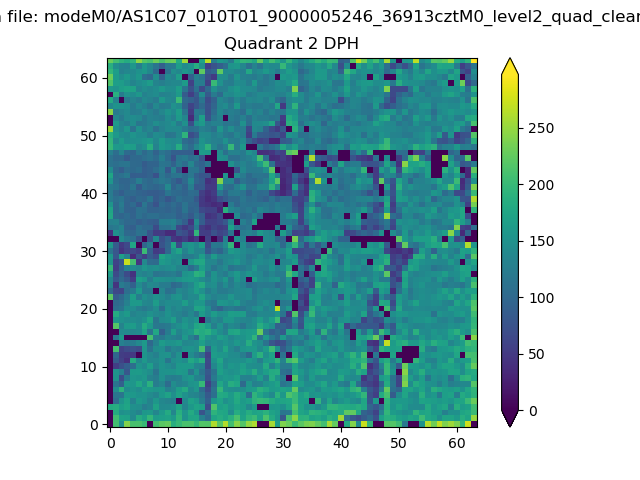 |
Quadrant C |
| Plot type | Count rate plots | Images |
|---|---|---|
| Comparison with Poisson distribution Blue bars denote a histogram of data divided into 1 sec bins. Red curve is a Poisson curve with rate = median count rate of data. |
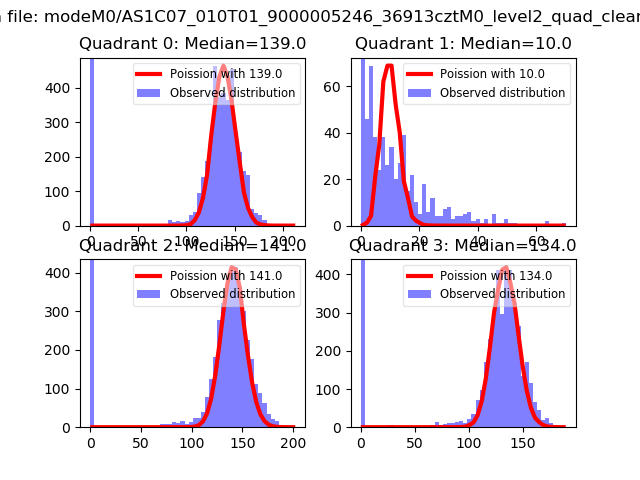 |
 |
| Quadrant-wise count rates Data is divided into 100 sec bins |
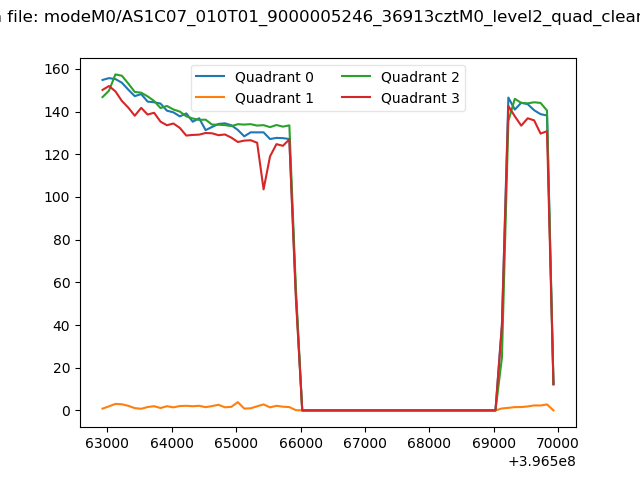 |
|
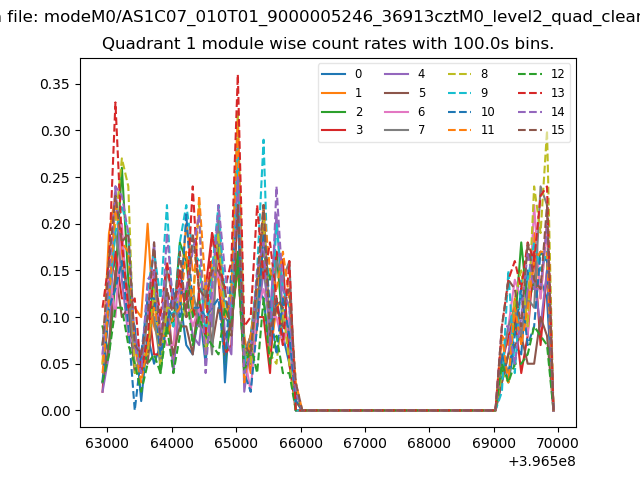
| Module-wise count rates for Quadrant A Data is divided into 100 sec bins |
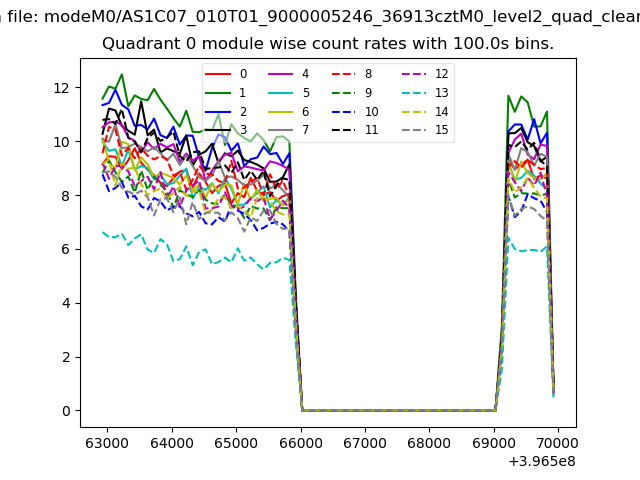 |
 |
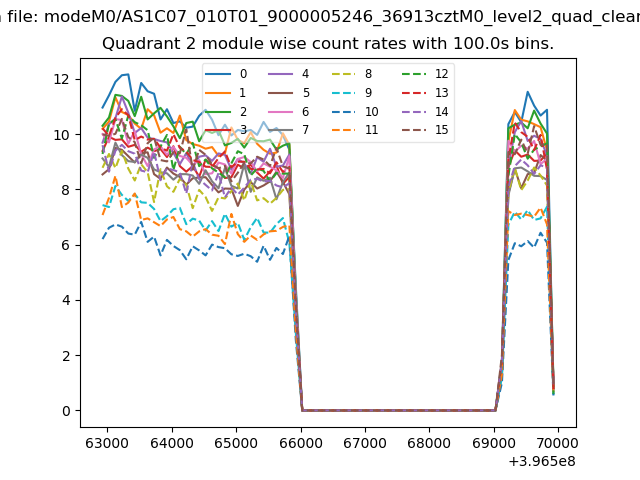
| Module-wise count rates for Quadrant B Data is divided into 100 sec bins |
 |
 |
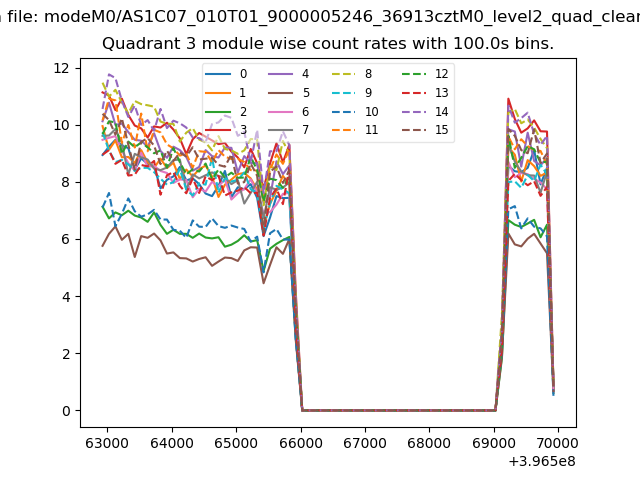
| Module-wise count rates for Quadrant C Data is divided into 100 sec bins |
 |
 |
| Module-wise count rates for Quadrant D Data is divided into 100 sec bins |
 |
 |
| Parameter | Plot |
|---|---|
| CZT HV Monitor | 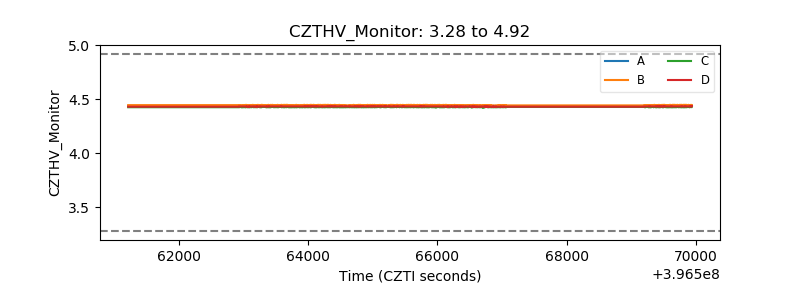 |
| D_VDD | 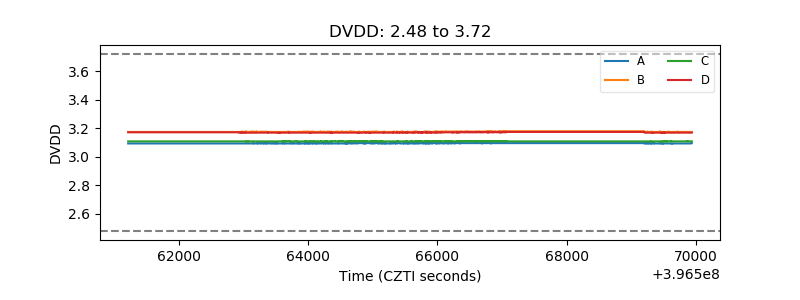 |
| Temperature 1 | 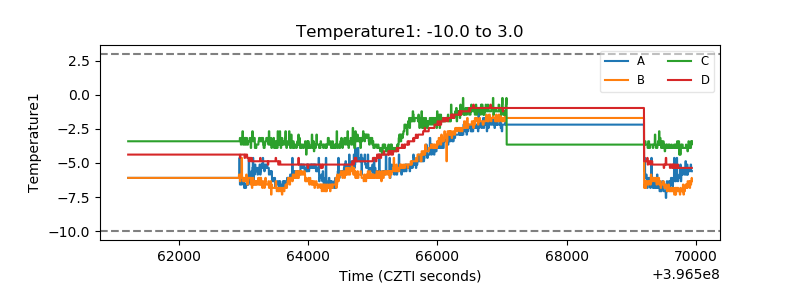 |
| Veto HV Monitor | 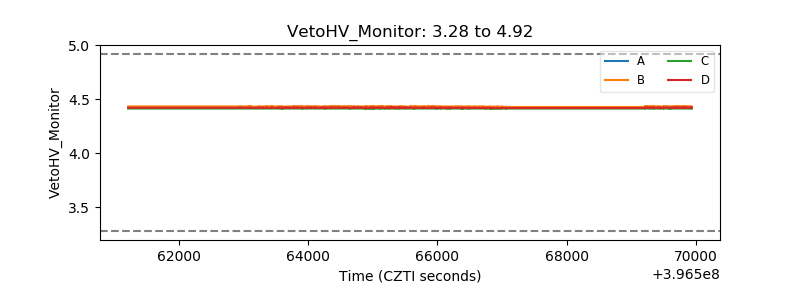 |
| Veto LLD | 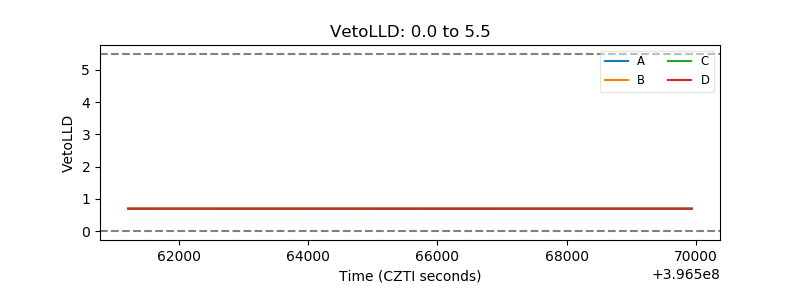 |
| Alpha Counter | 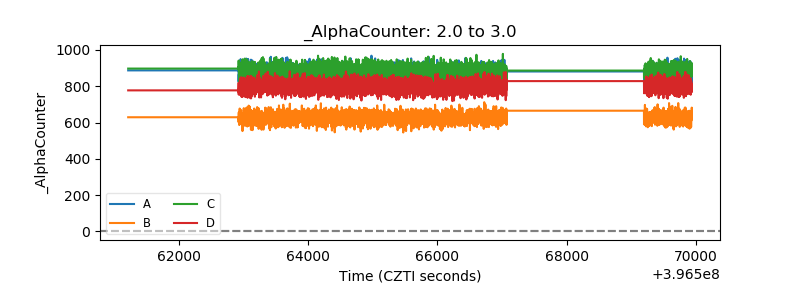 |
| _CPM_Rate | 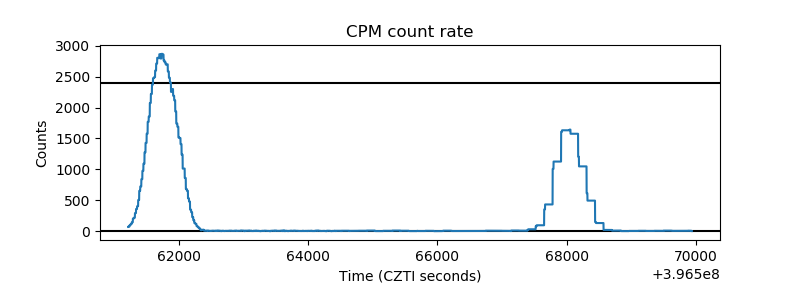 |
| CZT Counter | 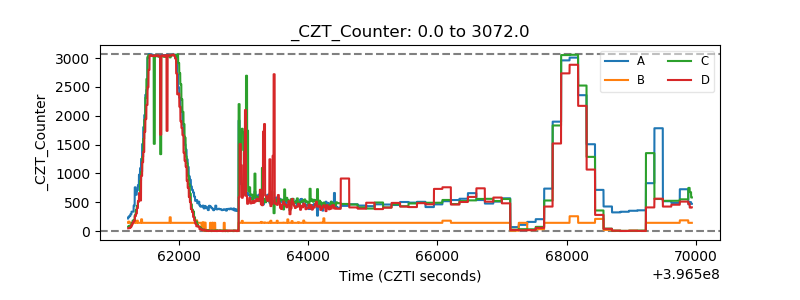 |
| +2.5 Volts monitor | 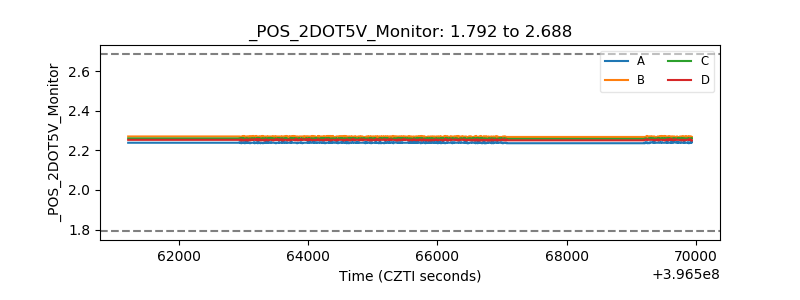 |
| +5 Volts monitor | 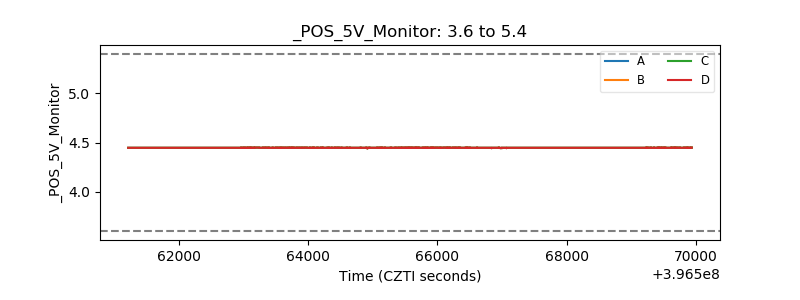 |
| _ROLL_ROT | 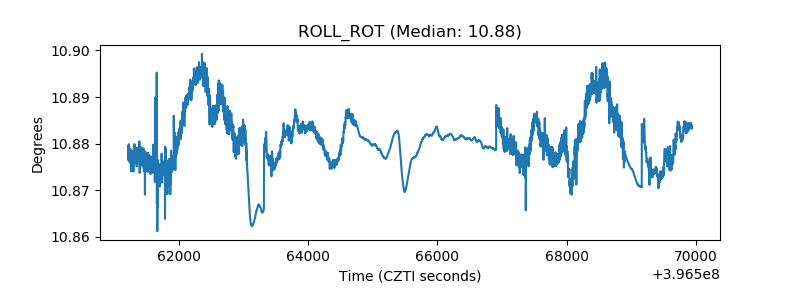 |
| _Roll_DEC | 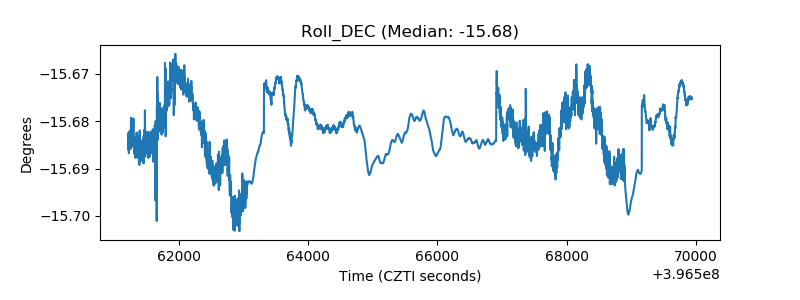 |
| _Roll_RA | 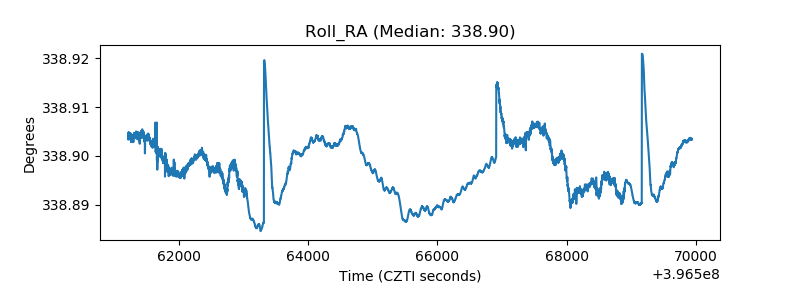 |
| Veto Counter | 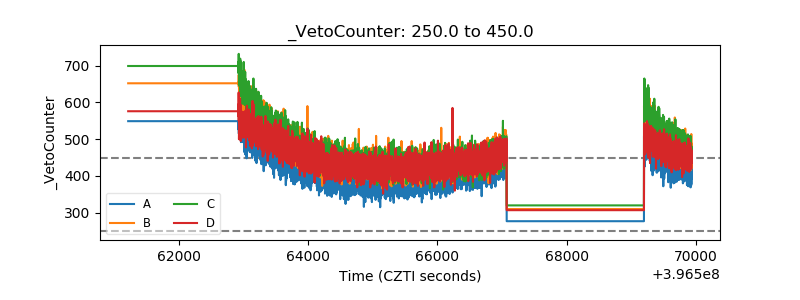 |