| Param | Original file | Final file |
|---|---|---|
| Filename | modeM0/AS1A09_002T01_9000005322_37432cztM0_level2.evt | modeM0/AS1A09_002T01_9000005322_37432cztM0_level2_quad_clean.evt |
| Size (bytes) | 417,009,600 | 62,642,880 |
| Size | 397.7 MB | 59.7 MB |
| Events in quadrant A | 2,622,542 | 390,635 |
| Events in quadrant B | 3,444,181 | 398,337 |
| Events in quadrant C | 2,800,566 | 391,289 |
| Events in quadrant D | 3,420,864 | 364,391 |
| Mode M0 | |||
|---|---|---|---|
| Quadrant | BADHDUFLAG | Total packets | Discarded packets |
| A | 0 | 10784 | 3 |
| B | 0 | 13373 | 2 |
| C | 0 | 11167 | 2 |
| D | 0 | 13536 | 2 |
| Mode M9 | |||
|---|---|---|---|
| Quadrant | BADHDUFLAG | Total packets | Discarded packets |
| A | 0 | 26 | 0 |
| B | 0 | 26 | 0 |
| C | 0 | 26 | 0 |
| D | 0 | 27 | 0 |
| Mode SS | |||
|---|---|---|---|
| Quadrant | BADHDUFLAG | Total packets | Discarded packets |
| A | 0 | 104 | 0 |
| B | 0 | 104 | 0 |
| C | 0 | 104 | 0 |
| D | 0 | 104 | 0 |
| Quadrant | Total seconds | Saturated seconds | Saturation percentage |
|---|---|---|---|
| A | 5012 | 17 | 0.339186% |
| B | 5012 | 329 | 6.564246% |
| C | 5012 | 72 | 1.436552% |
| D | 5012 | 207 | 4.130088% |
Noise dominated data is calculated using 1-second bins in cleaned event files. If a bin has >2000 counts, and if more than 50% of those come from <1% of pixels, then it is considered to be noise-dominated and hence unusable.
| Quadrant | # 1 sec bins | Bins with >0 counts | Bins with >2000 counts | High rate bins dominated by noise | Noise dominated (total time) | Noise dominated (detector-on time) | Marked lightcurve |
|---|---|---|---|---|---|---|---|
| A | 6955 | 5013 | 6 | 6 | 0.09% | 0.12% | 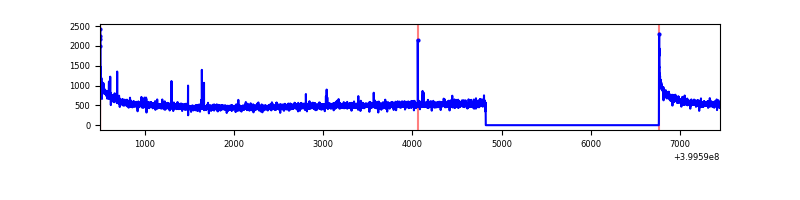 |
| B | 6955 | 5013 | 232 | 232 | 3.34% | 4.63% | 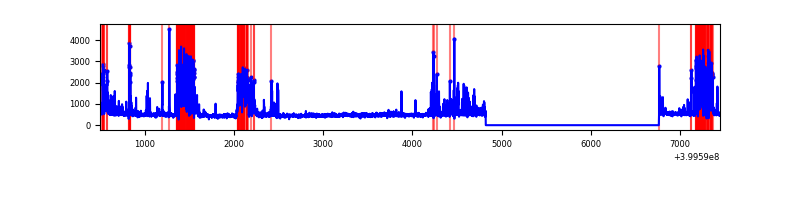 |
| C | 6955 | 5013 | 71 | 71 | 1.02% | 1.42% | 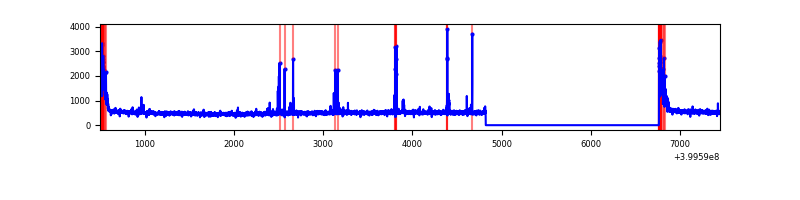 |
| D | 6955 | 5013 | 191 | 191 | 2.75% | 3.81% | 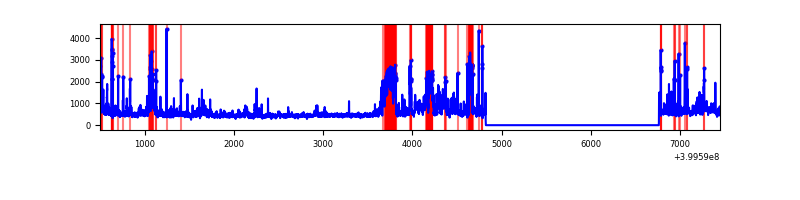 |
Top three noisy pixels from each quadrant. If the there are fewer than three noisy pixels in the level2.evt file, extra rows are filled as -1
| Pixel properties | Quadrant properties | ||||||
|---|---|---|---|---|---|---|---|
| Quadrant | DetID | PixID | Counts | Sigma | Mean | Median | Sigma |
| A | 10 | 83 | 272606 | 2281.14 | 596 | 585 | 119.2 |
| A | 12 | 189 | 15696 | 126.72 | 596 | 585 | 119.2 |
| A | 13 | 6 | 10445 | 82.69 | 596 | 585 | 119.2 |
| B | 5 | 172 | 605329 | 5589.41 | 580 | 568 | 108.2 |
| B | 0 | 189 | 319891 | 2951.29 | 580 | 568 | 108.2 |
| B | 4 | 171 | 108563 | 998.13 | 580 | 568 | 108.2 |
| C | 0 | 10 | 225094 | 1698.77 | 579 | 584 | 132.2 |
| C | 15 | 214 | 214674 | 1619.93 | 579 | 584 | 132.2 |
| C | 14 | 254 | 95305 | 716.71 | 579 | 584 | 132.2 |
| D | 10 | 253 | 485575 | 3536.04 | 572 | 556 | 137.2 |
| D | 12 | 227 | 173382 | 1259.99 | 572 | 556 | 137.2 |
| D | 12 | 235 | 141036 | 1024.17 | 572 | 556 | 137.2 |
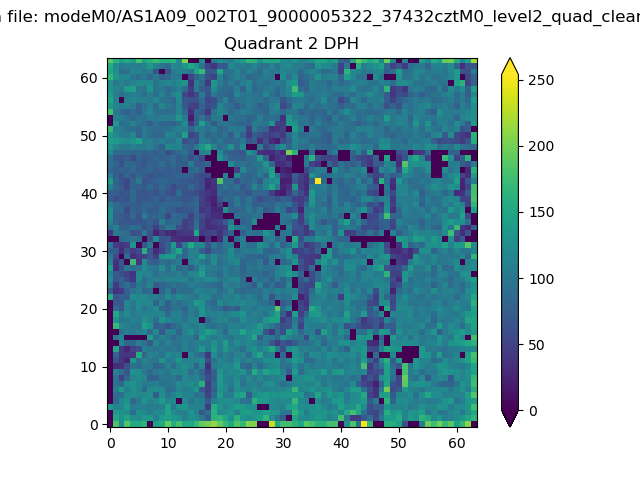
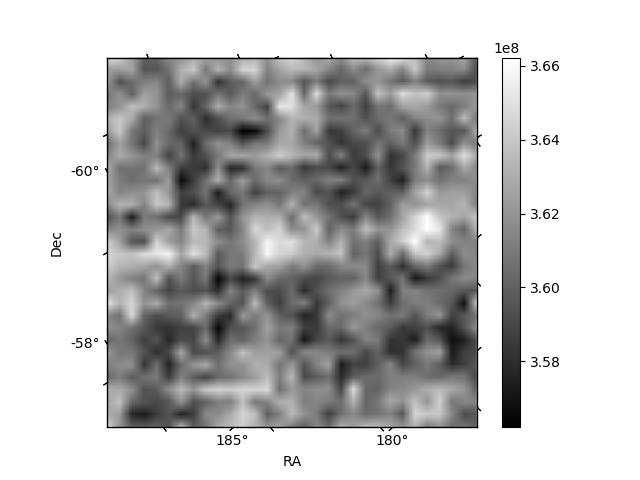
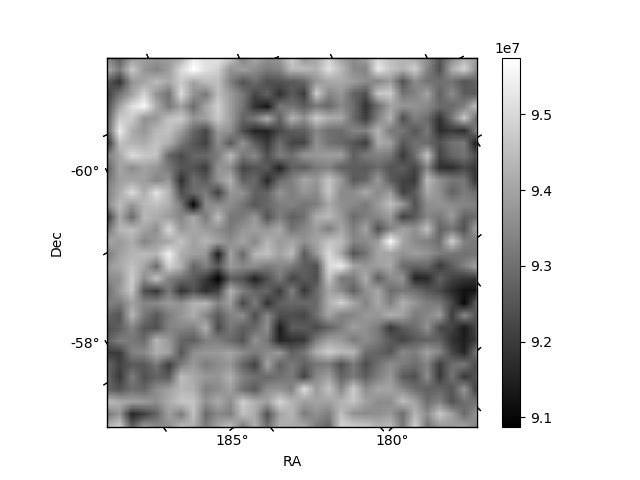
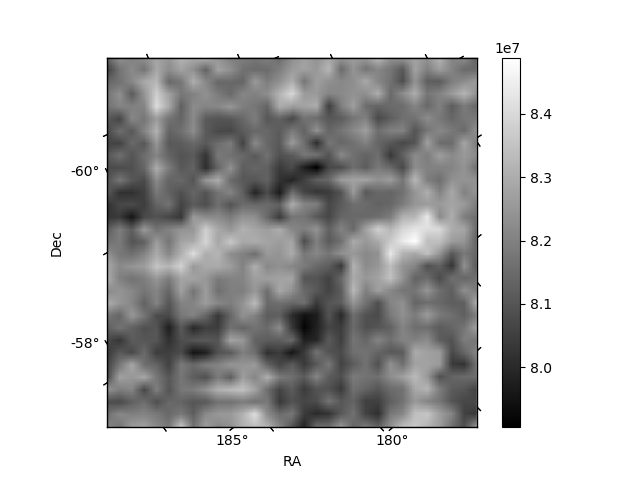
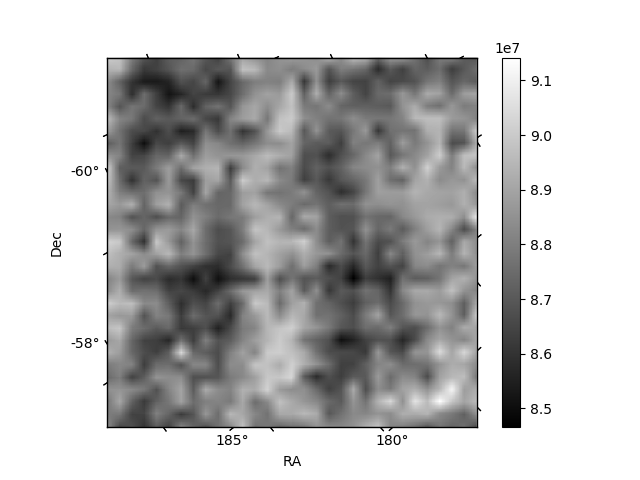
Histogram calculated using DETX and DETY for each event in the final _common_clean file
| Quadrant A | 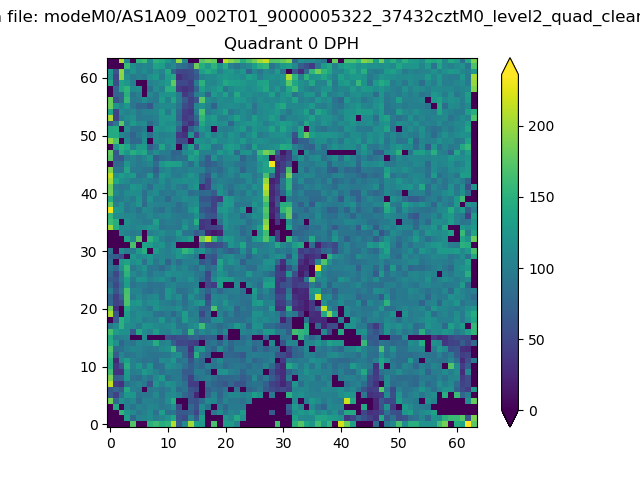 |
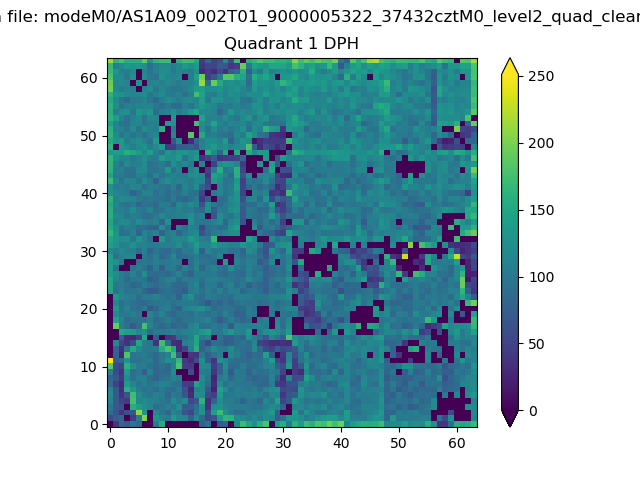 |
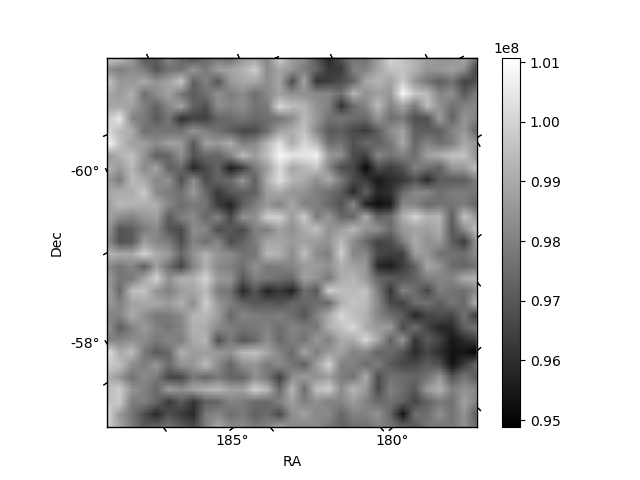
Quadrant B |
|---|---|---|---|
| Quadrant D | 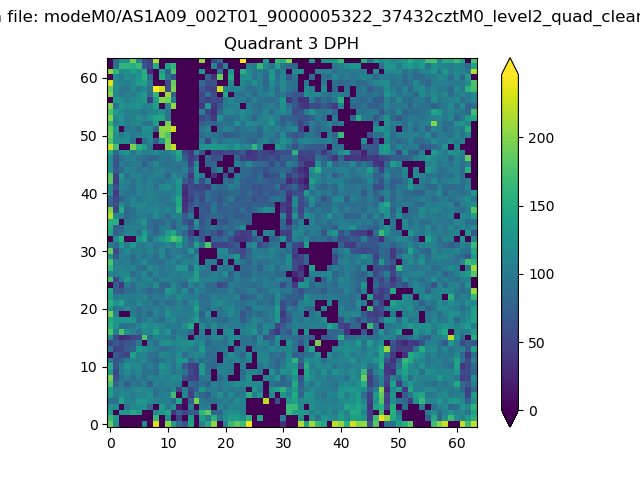 |
 |
Quadrant C |
| Plot type | Count rate plots | Images |
|---|---|---|
| Comparison with Poisson distribution Blue bars denote a histogram of data divided into 1 sec bins. Red curve is a Poisson curve with rate = median count rate of data. |
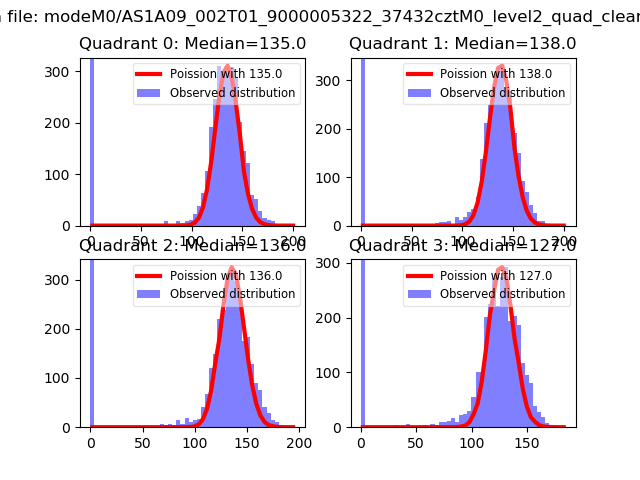 |
 |
| Quadrant-wise count rates Data is divided into 100 sec bins |
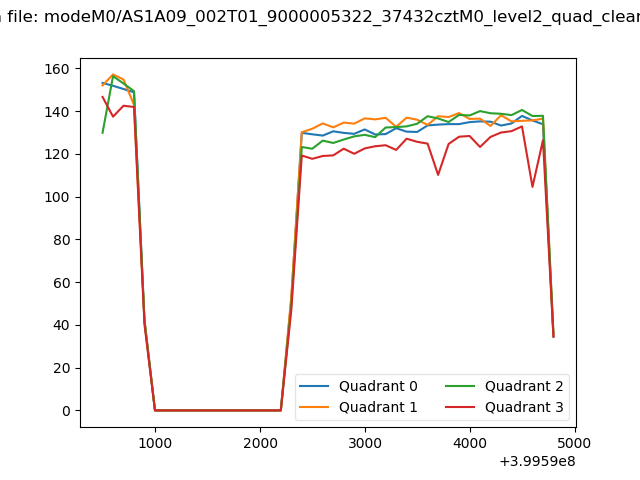 |
|
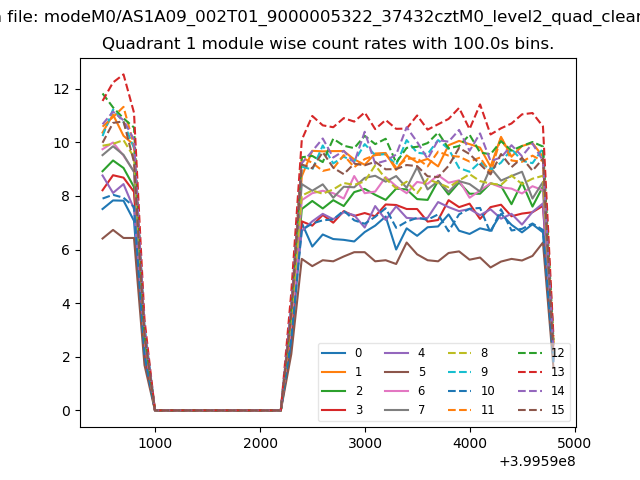
| Module-wise count rates for Quadrant A Data is divided into 100 sec bins |
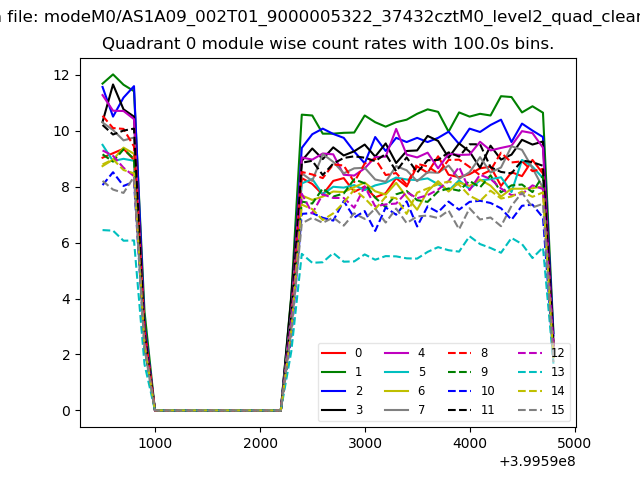 |
 |
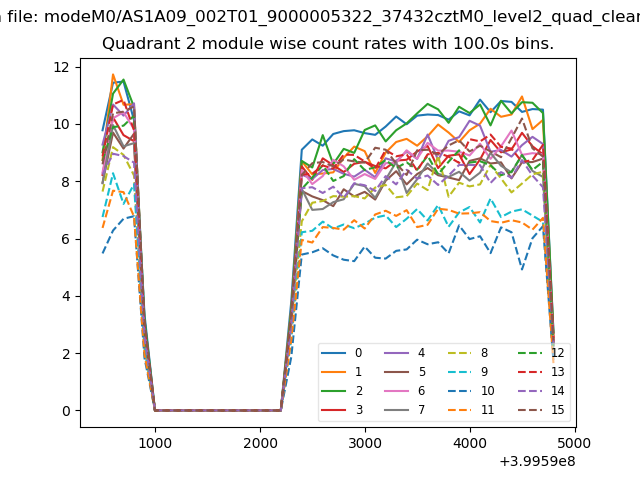
| Module-wise count rates for Quadrant B Data is divided into 100 sec bins |
 |
 |
| Module-wise count rates for Quadrant C Data is divided into 100 sec bins |
 |
 |
| Module-wise count rates for Quadrant D Data is divided into 100 sec bins |
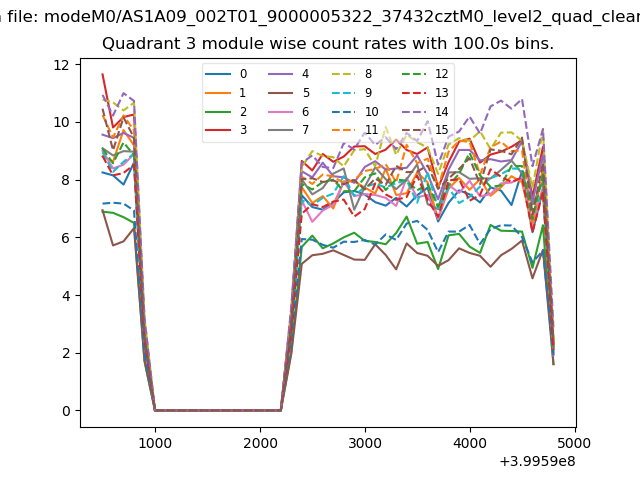 |
 |
| Parameter | Plot |
|---|---|
| CZT HV Monitor | 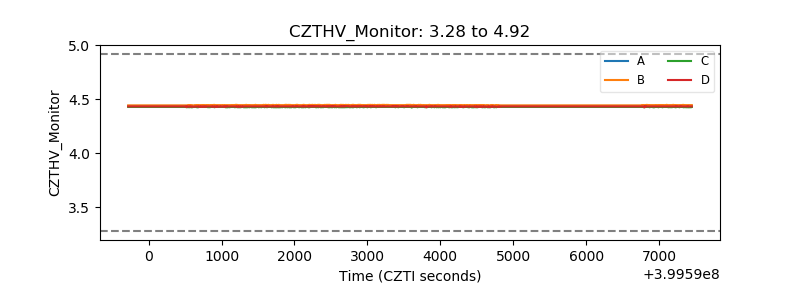 |
| D_VDD | 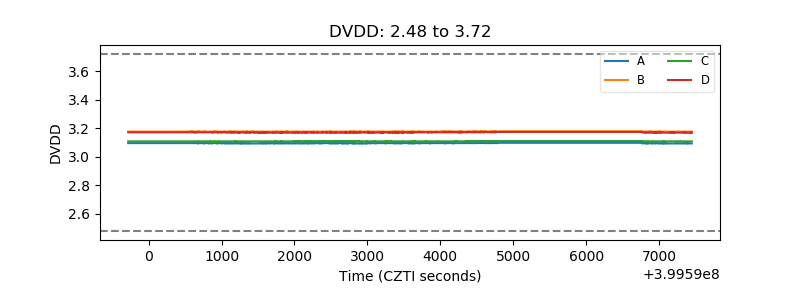 |
| Temperature 1 | 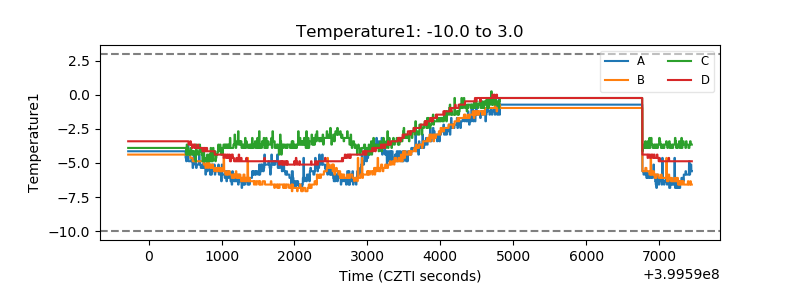 |
| Veto HV Monitor | 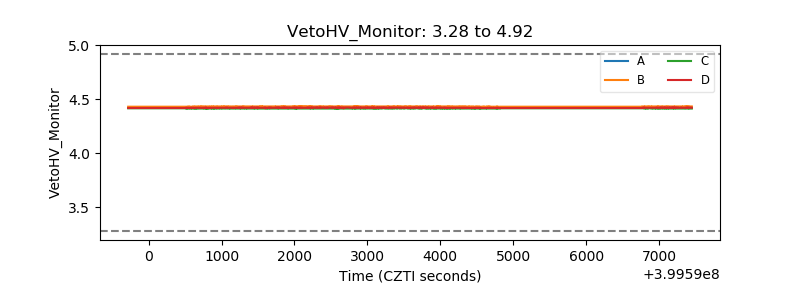 |
| Veto LLD | 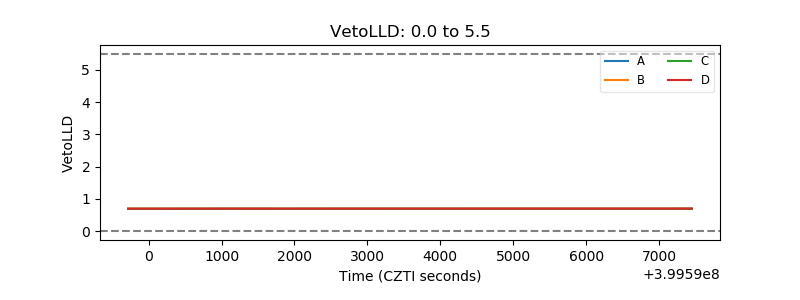 |
| Alpha Counter | 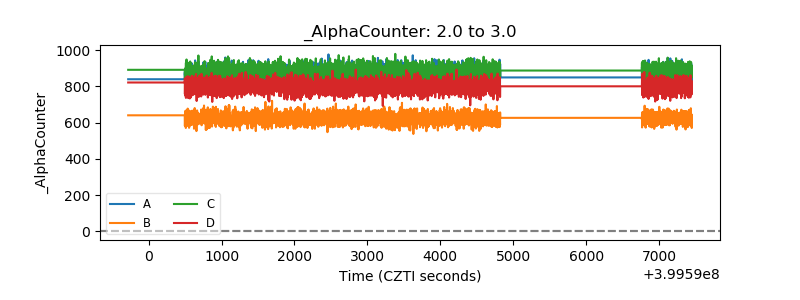 |
| _CPM_Rate | 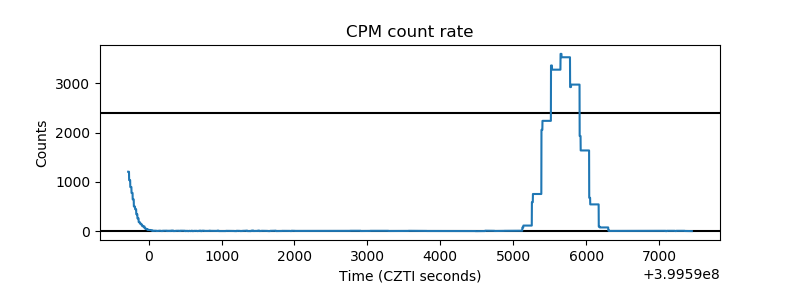 |
| CZT Counter | 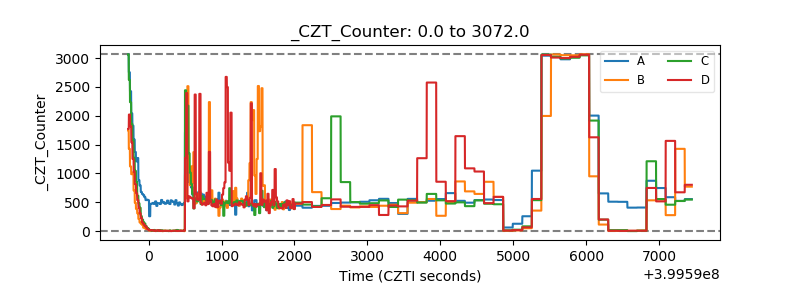 |
| +2.5 Volts monitor | 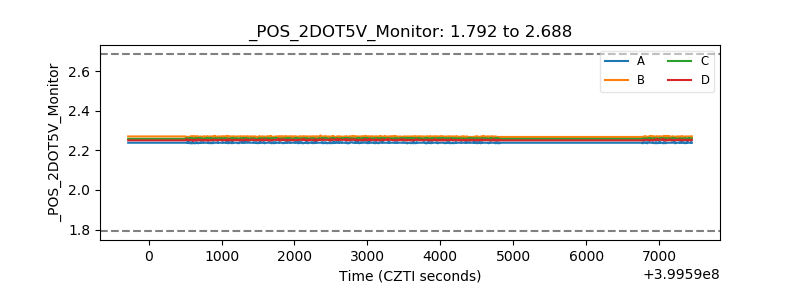 |
| +5 Volts monitor | 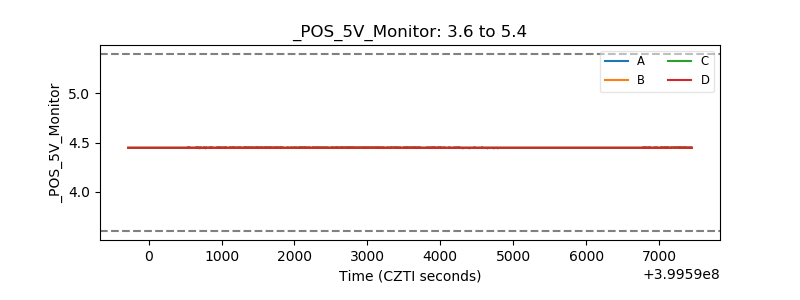 |
| _ROLL_ROT | 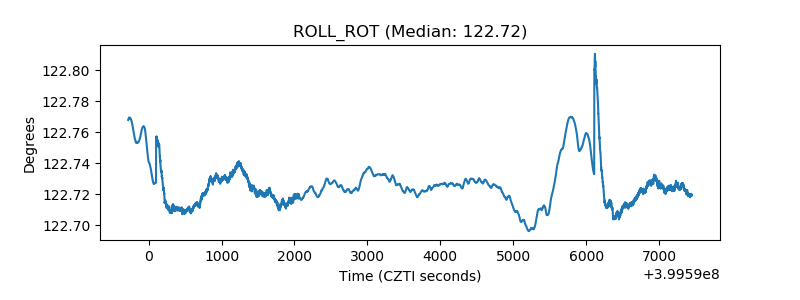 |
| _Roll_DEC | 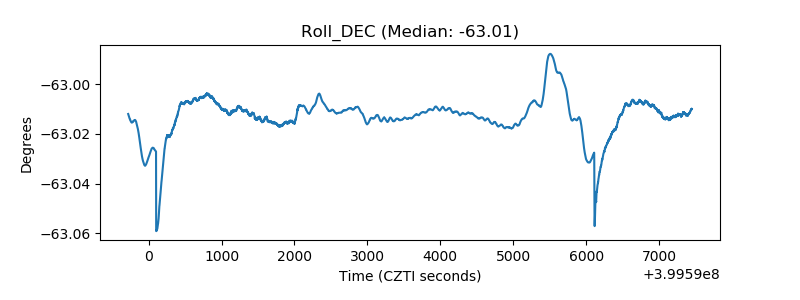 |
| _Roll_RA | 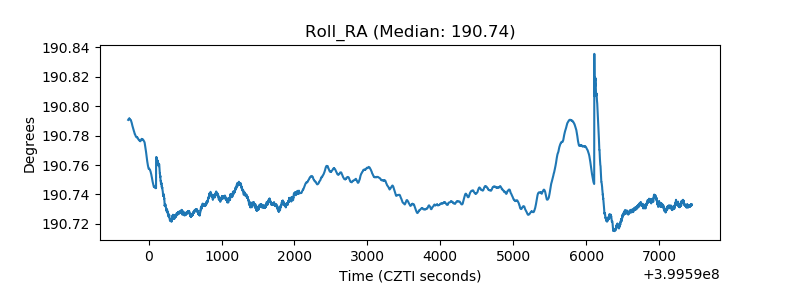 |
| Veto Counter | 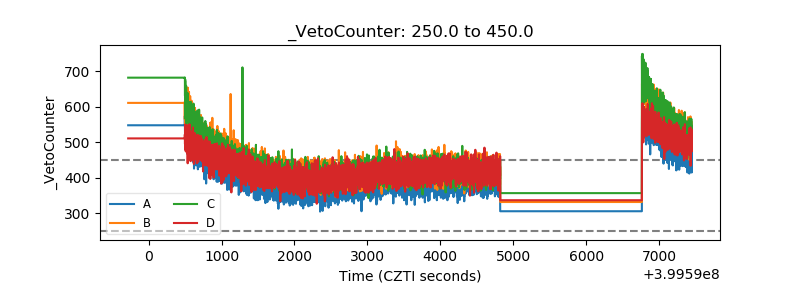 |