| Param | Original file | Final file |
|---|---|---|
| Filename | modeM0/AS1A12_025T10_9000005384_38394cztM0_level2.fits | modeM0/AS1A12_025T10_9000005384_38394cztM0_level2_quad_clean.evt |
| Size (bytes) | 337,855,680 | 80,827,200 |
| Size | 322.2 MB | 77.1 MB |
| Events in quadrant A | 2,750,554 | 545,223 |
| Events in quadrant B | 2,519,081 | 557,346 |
| Events in quadrant C | 2,322,708 | 527,660 |
| Events in quadrant D | 4,536,133 | 476,291 |
| Mode SS | |||
|---|---|---|---|
| Quadrant | BADHDUFLAG | Total packets | Discarded packets |
| A | 0 | 100 | 0 |
| B | 0 | 100 | 0 |
| C | 0 | 100 | 0 |
| D | 0 | 100 | 0 |
| Mode M0 | |||
|---|---|---|---|
| Quadrant | BADHDUFLAG | Total packets | Discarded packets |
| A | 0 | 11232 | 2 |
| B | 0 | 10703 | 1 |
| C | 0 | 9864 | 1 |
| D | 0 | 17190 | 1 |
| Mode M9 | |||
|---|---|---|---|
| Quadrant | BADHDUFLAG | Total packets | Discarded packets |
| A | 0 | 14 | 0 |
| B | 0 | 14 | 0 |
| C | 0 | 14 | 0 |
| D | 0 | 14 | 0 |
| Quadrant | Total seconds | Saturated seconds | Saturation percentage |
|---|---|---|---|
| A | 4854 | 46 | 0.947672% |
| B | 4854 | 34 | 0.700453% |
| C | 4854 | 3 | 0.061805% |
| D | 4854 | 225 | 4.635352% |
Noise dominated data is calculated using 1-second bins in cleaned event files. If a bin has >2000 counts, and if more than 50% of those come from <1% of pixels, then it is considered to be noise-dominated and hence unusable.
| Quadrant | # 1 sec bins | Bins with >0 counts | Bins with >2000 counts | High rate bins dominated by noise | Noise dominated (total time) | Noise dominated (detector-on time) | Marked lightcurve |
|---|---|---|---|---|---|---|---|
| A | 6227 | 4855 | 26 | 26 | 0.42% | 0.54% | 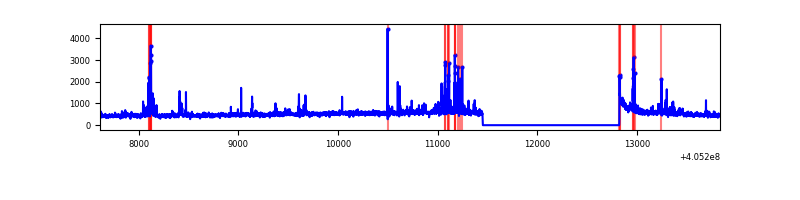 |
| B | 6227 | 4855 | 8 | 8 | 0.13% | 0.16% | 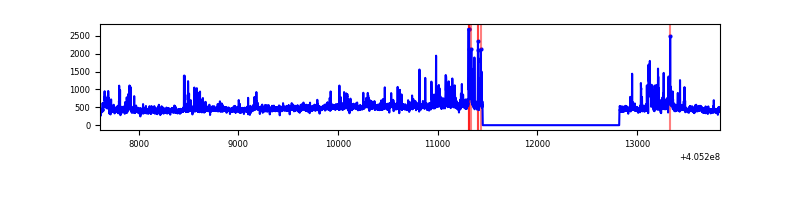 |
| C | 6227 | 4855 | 0 | 0 | 0.00% | 0.00% | 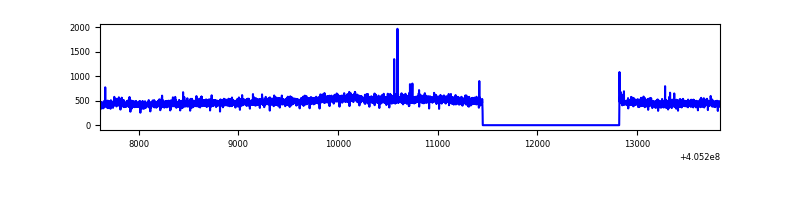 |
| D | 6227 | 4855 | 226 | 226 | 3.63% | 4.65% | 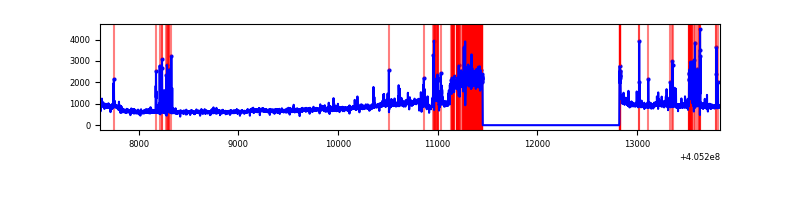 |
Top three noisy pixels from each quadrant. If the there are fewer than three noisy pixels in the level2.evt file, extra rows are filled as -1
| Pixel properties | Quadrant properties | ||||||
|---|---|---|---|---|---|---|---|
| Quadrant | DetID | PixID | Counts | Sigma | Mean | Median | Sigma |
| A | 10 | 83 | 301732 | 2673.36 | 547 | 537 | 112.7 |
| A | 13 | 248 | 110569 | 976.63 | 547 | 537 | 112.7 |
| A | 9 | 143 | 107271 | 947.36 | 547 | 537 | 112.7 |
| B | 0 | 183 | 203268 | 1915.52 | 545 | 531 | 105.8 |
| B | 4 | 171 | 45068 | 420.8 | 545 | 531 | 105.8 |
| B | 0 | 186 | 35489 | 330.29 | 545 | 531 | 105.8 |
| C | 15 | 214 | 200155 | 1587.16 | 534 | 537 | 125.8 |
| C | 3 | 233 | 12006 | 91.19 | 534 | 537 | 125.8 |
| C | 15 | 159 | 10667 | 80.54 | 534 | 537 | 125.8 |
| D | 10 | 203 | 1936089 | 15025.33 | 527 | 510 | 128.8 |
| D | 13 | 171 | 118465 | 915.65 | 527 | 510 | 128.8 |
| D | 2 | 16 | 82655 | 637.67 | 527 | 510 | 128.8 |
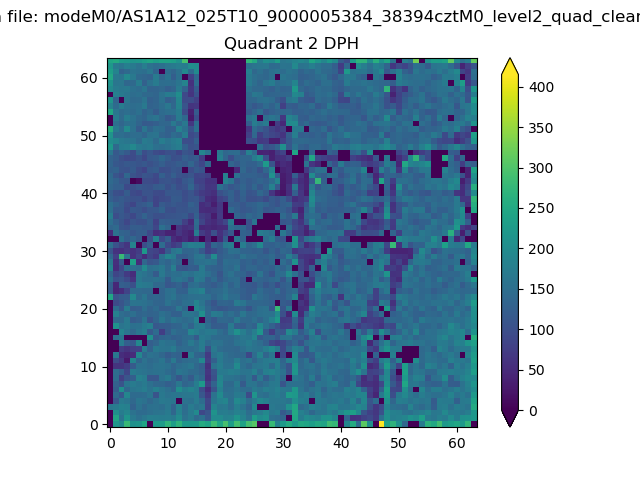
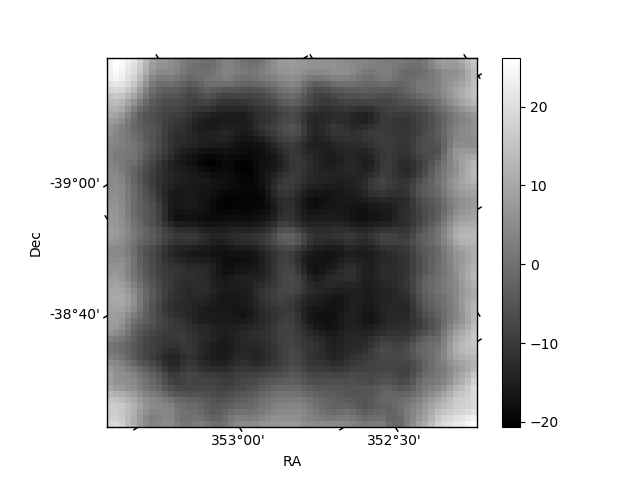
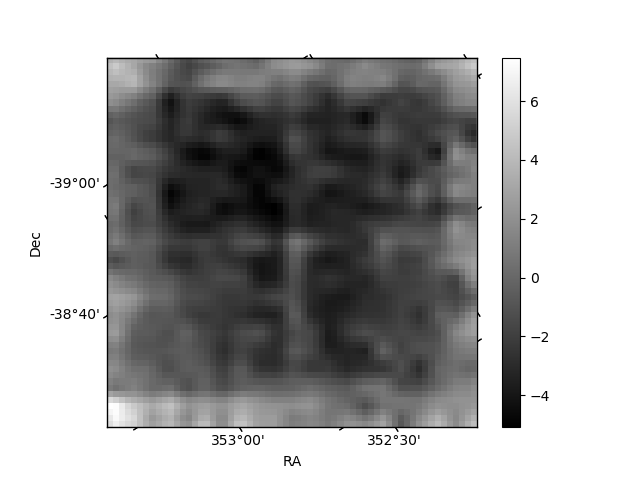
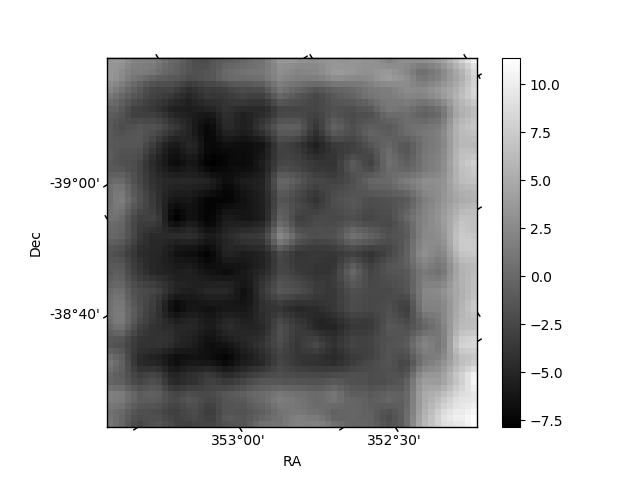
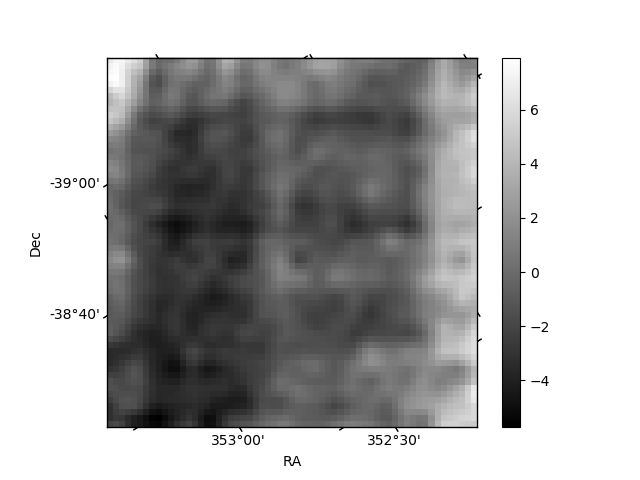
Histogram calculated using DETX and DETY for each event in the final _common_clean file
| Quadrant A | 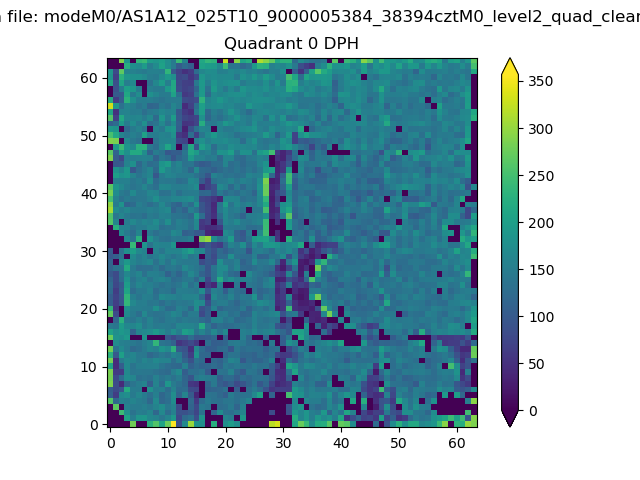 |
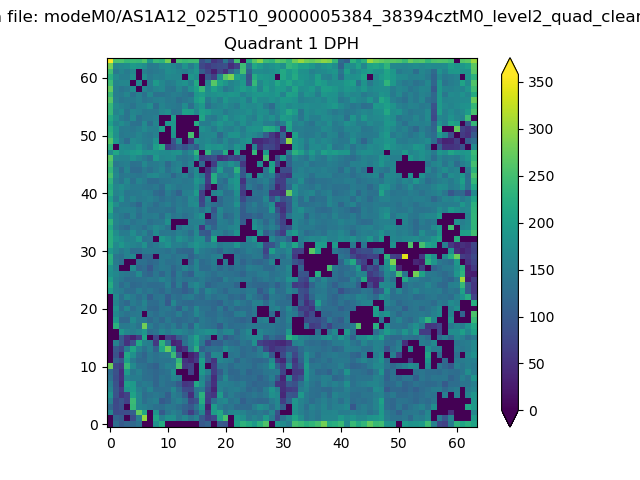 |
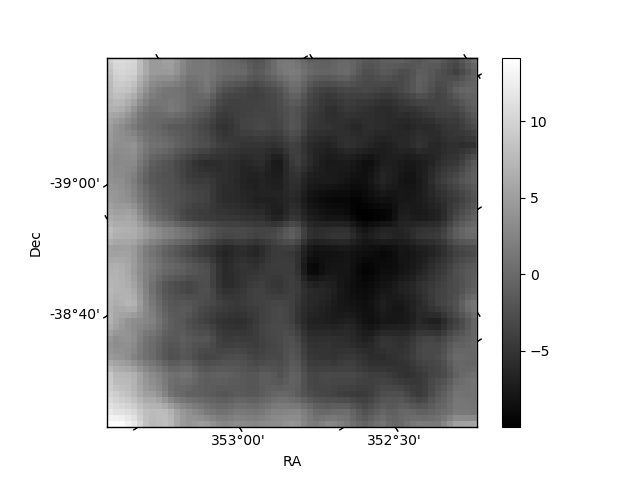
Quadrant B |
|---|---|---|---|
| Quadrant D | 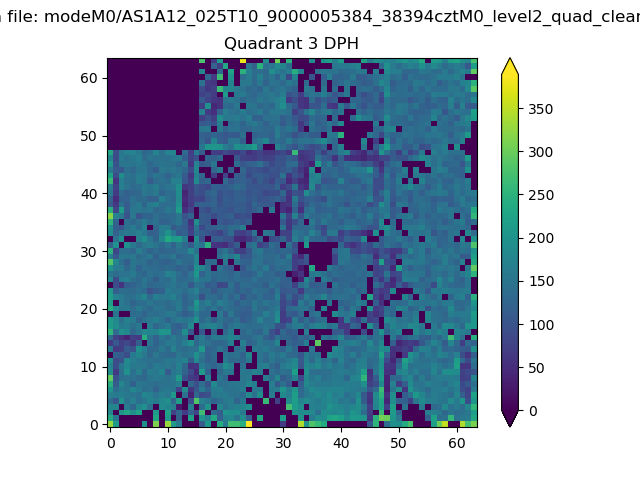 |
 |
Quadrant C |
| Plot type | Count rate plots | Images |
|---|---|---|
| Comparison with Poisson distribution Blue bars denote a histogram of data divided into 1 sec bins. Red curve is a Poisson curve with rate = median count rate of data. |
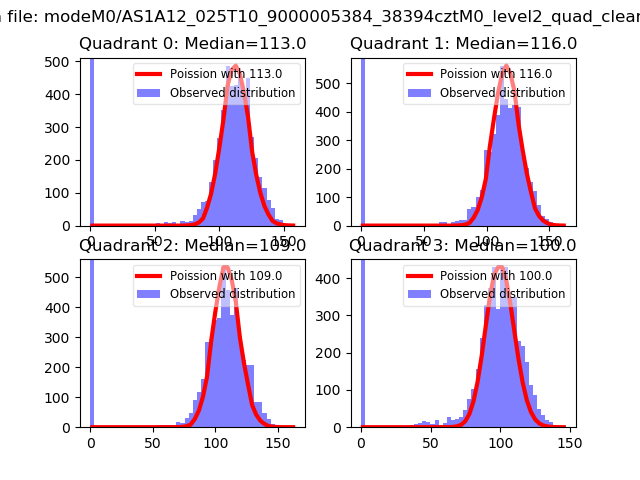 |
 |
| Quadrant-wise count rates Data is divided into 100 sec bins |
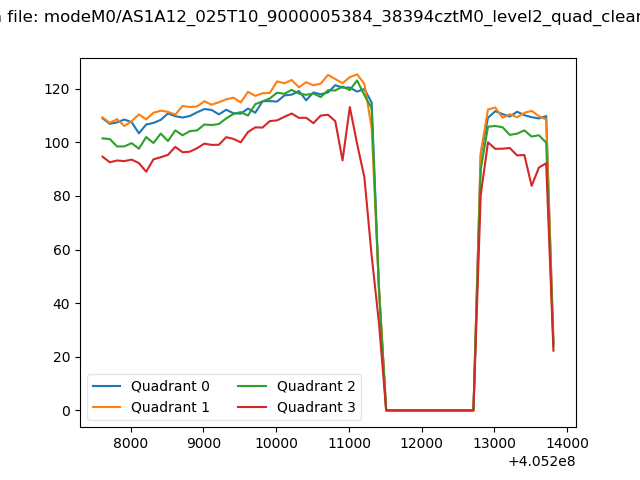 |
|
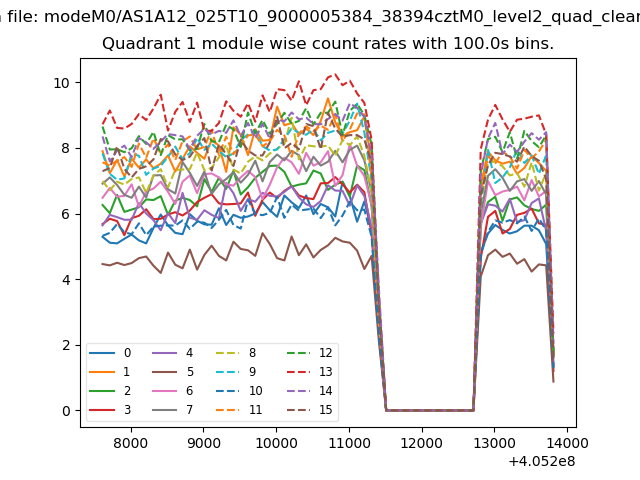
| Module-wise count rates for Quadrant A Data is divided into 100 sec bins |
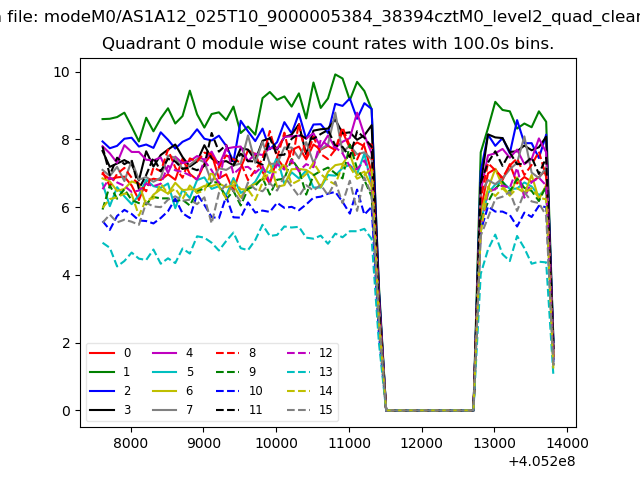 |
 |
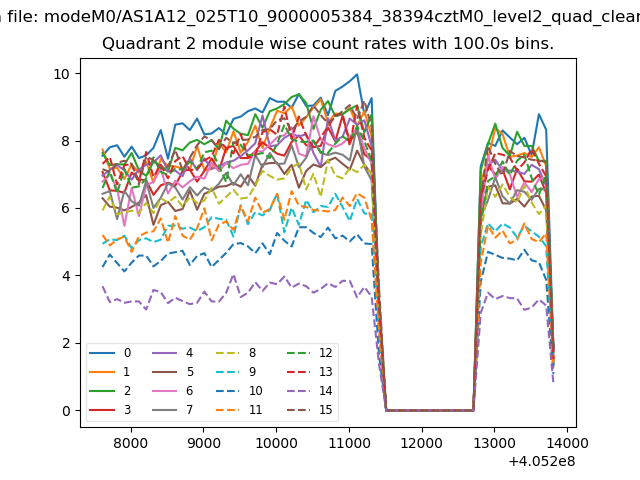
| Module-wise count rates for Quadrant B Data is divided into 100 sec bins |
 |
 |
| Module-wise count rates for Quadrant C Data is divided into 100 sec bins |
 |
 |
| Module-wise count rates for Quadrant D Data is divided into 100 sec bins |
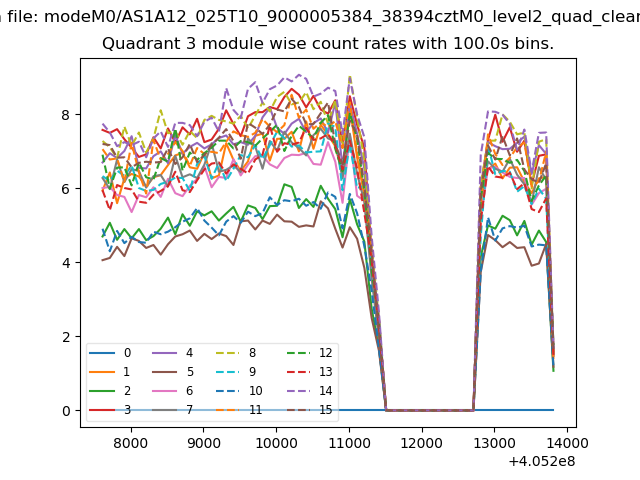 |
 |
| Parameter | Plot |
|---|---|
| CZT HV Monitor |  |
| D_VDD | 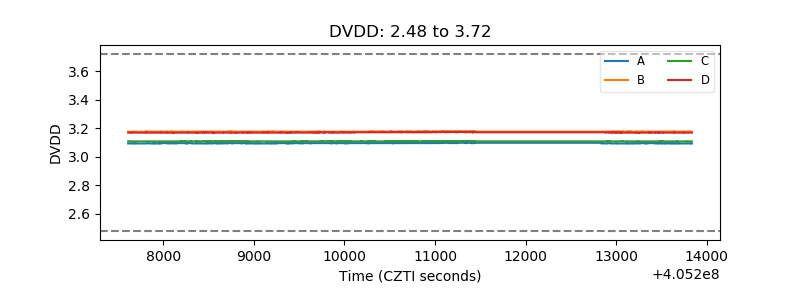 |
| Temperature 1 | 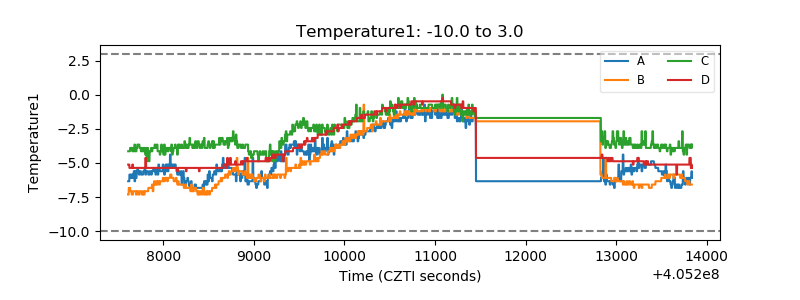 |
| Veto HV Monitor | 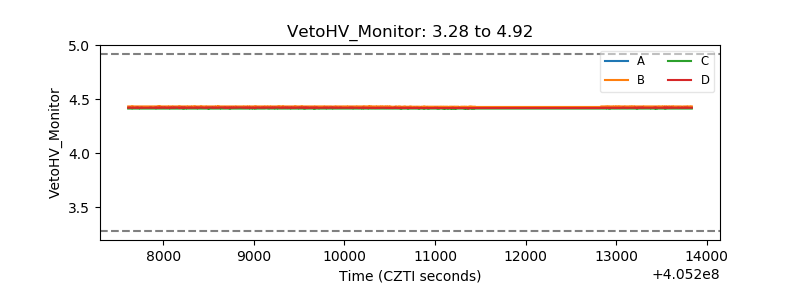 |
| Veto LLD | 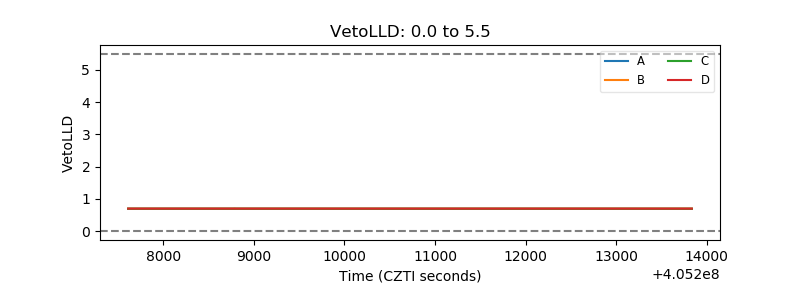 |
| Alpha Counter | 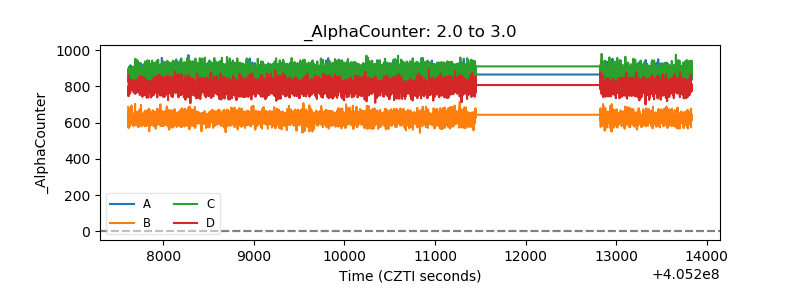 |
| _CPM_Rate | 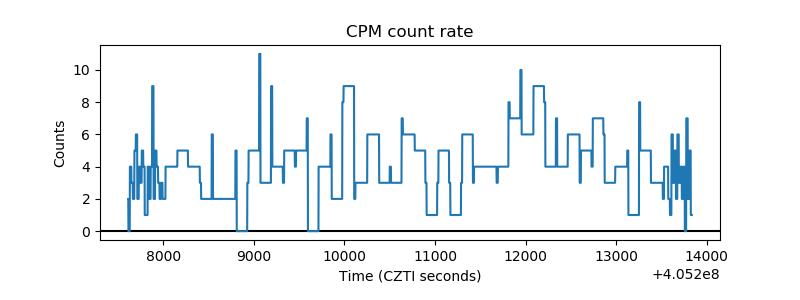 |
| CZT Counter | 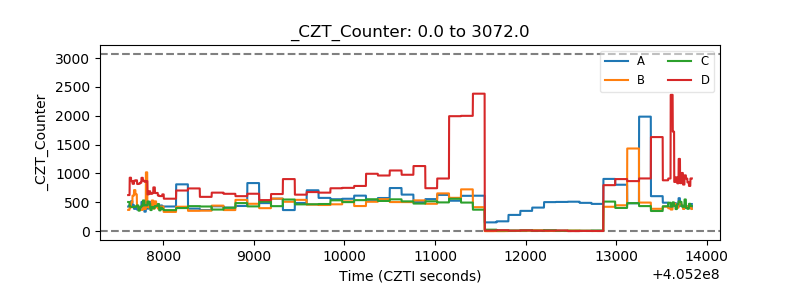 |
| +2.5 Volts monitor | 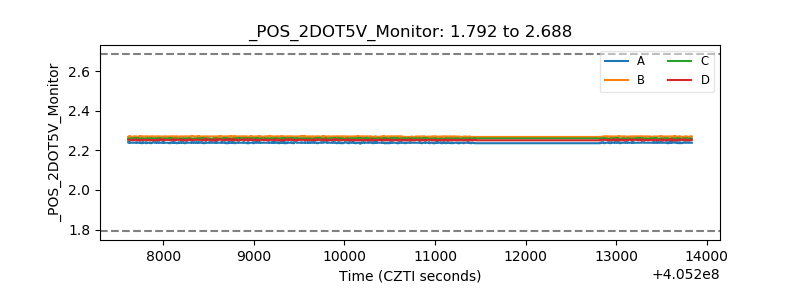 |
| +5 Volts monitor | 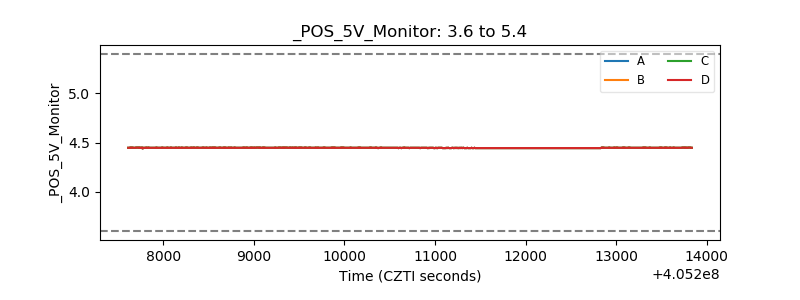 |
| _ROLL_ROT | 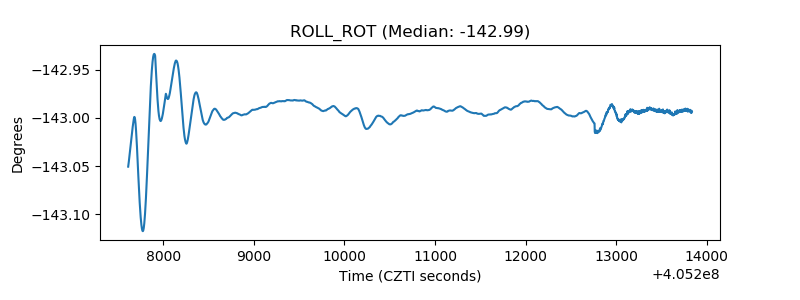 |
| _Roll_DEC | 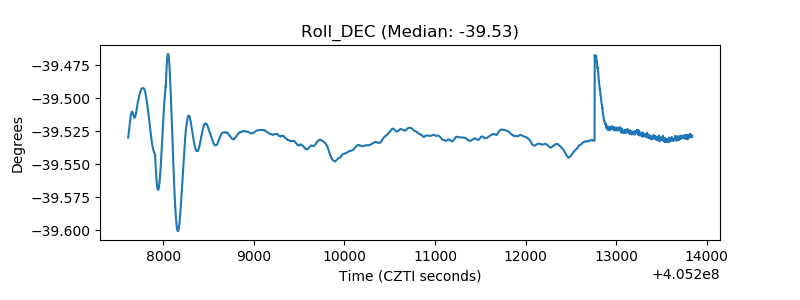 |
| _Roll_RA | 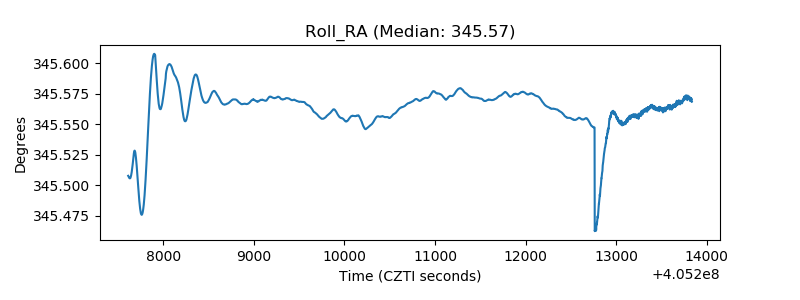 |
| Veto Counter | 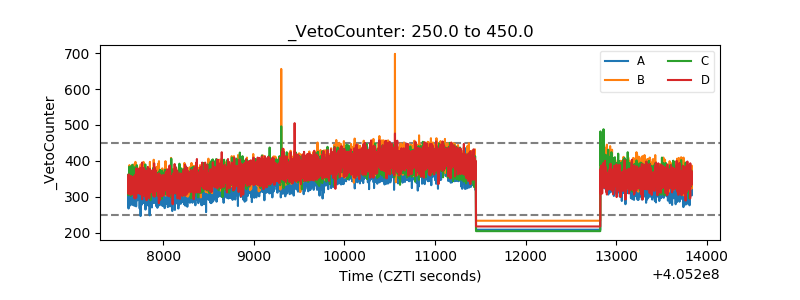 |