| Param | Original file | Final file |
|---|---|---|
| Filename | modeM0/AS1A12_018T01_9000005386_38510cztM0_level2.fits | modeM0/AS1A12_018T01_9000005386_38510cztM0_level2_quad_clean.evt |
| Size (bytes) | 350,406,720 | 95,708,160 |
| Size | 334.2 MB | 91.3 MB |
| Events in quadrant A | 3,080,808 | 644,906 |
| Events in quadrant B | 3,426,094 | 650,416 |
| Events in quadrant C | 2,783,262 | 623,563 |
| Events in quadrant D | 3,234,662 | 578,130 |
| Mode SS | |||
|---|---|---|---|
| Quadrant | BADHDUFLAG | Total packets | Discarded packets |
| A | 0 | 118 | 0 |
| B | 0 | 118 | 0 |
| C | 0 | 118 | 0 |
| D | 0 | 118 | 0 |
| Mode M9 | |||
|---|---|---|---|
| Quadrant | BADHDUFLAG | Total packets | Discarded packets |
| A | 0 | 22 | 0 |
| B | 0 | 22 | 0 |
| C | 0 | 22 | 0 |
| D | 0 | 23 | 0 |
| Mode M0 | |||
|---|---|---|---|
| Quadrant | BADHDUFLAG | Total packets | Discarded packets |
| A | 0 | 12560 | 3 |
| B | 0 | 13962 | 2 |
| C | 0 | 11815 | 2 |
| D | 0 | 13582 | 2 |
| Quadrant | Total seconds | Saturated seconds | Saturation percentage |
|---|---|---|---|
| A | 5731 | 36 | 0.628163% |
| B | 5731 | 118 | 2.058977% |
| C | 5731 | 17 | 0.296632% |
| D | 5731 | 60 | 1.046938% |
Noise dominated data is calculated using 1-second bins in cleaned event files. If a bin has >2000 counts, and if more than 50% of those come from <1% of pixels, then it is considered to be noise-dominated and hence unusable.
| Quadrant | # 1 sec bins | Bins with >0 counts | Bins with >2000 counts | High rate bins dominated by noise | Noise dominated (total time) | Noise dominated (detector-on time) | Marked lightcurve |
|---|---|---|---|---|---|---|---|
| A | 7075 | 5732 | 29 | 29 | 0.41% | 0.51% | 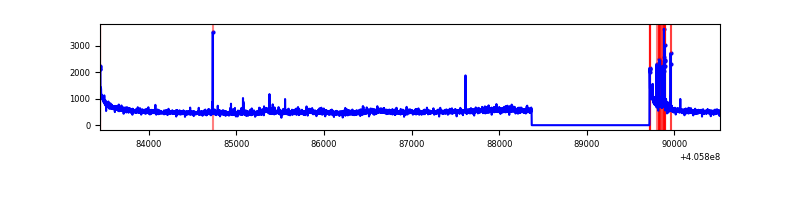 |
| B | 7075 | 5732 | 87 | 87 | 1.23% | 1.52% | 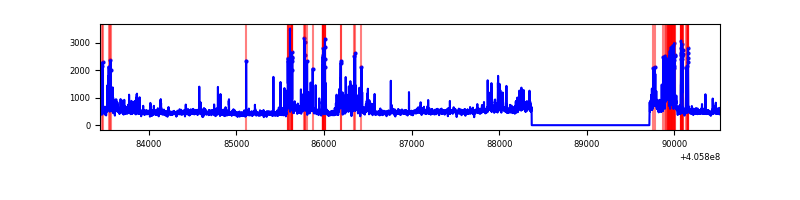 |
| C | 7075 | 5732 | 10 | 10 | 0.14% | 0.17% | 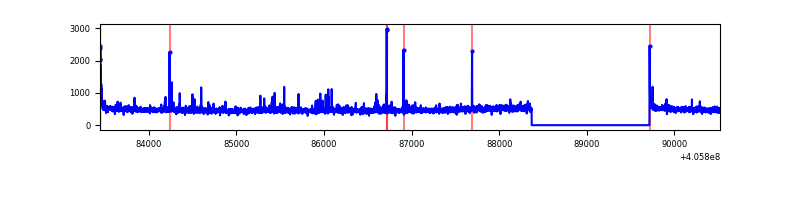 |
| D | 7075 | 5732 | 43 | 43 | 0.61% | 0.75% | 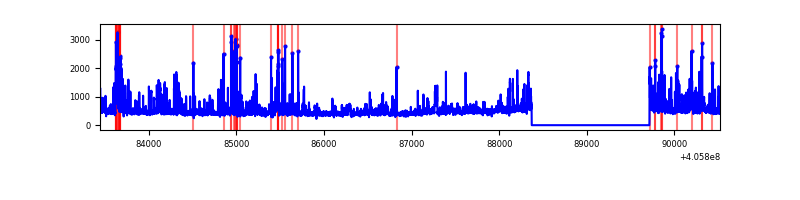 |
Top three noisy pixels from each quadrant. If the there are fewer than three noisy pixels in the level2.evt file, extra rows are filled as -1
| Pixel properties | Quadrant properties | ||||||
|---|---|---|---|---|---|---|---|
| Quadrant | DetID | PixID | Counts | Sigma | Mean | Median | Sigma |
| A | 10 | 83 | 426812 | 3301.75 | 635 | 622 | 129.1 |
| A | 12 | 189 | 95165 | 732.44 | 635 | 622 | 129.1 |
| A | 9 | 143 | 67387 | 517.24 | 635 | 622 | 129.1 |
| B | 8 | 3 | 608404 | 5006.16 | 629 | 613 | 121.4 |
| B | 5 | 200 | 110305 | 903.49 | 629 | 613 | 121.4 |
| B | 0 | 183 | 85495 | 699.14 | 629 | 613 | 121.4 |
| C | 15 | 214 | 240208 | 1665.39 | 618 | 622 | 143.9 |
| C | 14 | 254 | 74827 | 515.81 | 618 | 622 | 143.9 |
| C | 0 | 10 | 36719 | 250.91 | 618 | 622 | 143.9 |
| D | 12 | 235 | 391334 | 2603.01 | 620 | 602 | 150.1 |
| D | 13 | 249 | 215081 | 1428.83 | 620 | 602 | 150.1 |
| D | 12 | 233 | 124676 | 826.57 | 620 | 602 | 150.1 |
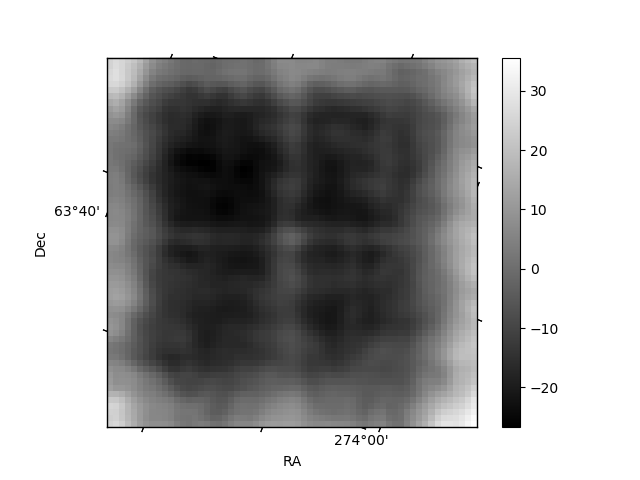
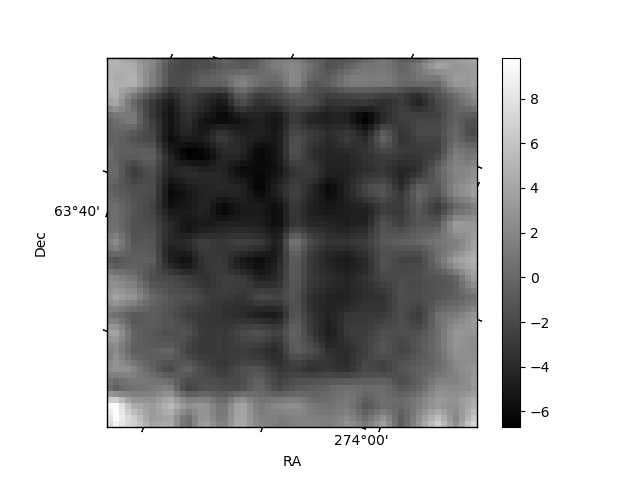
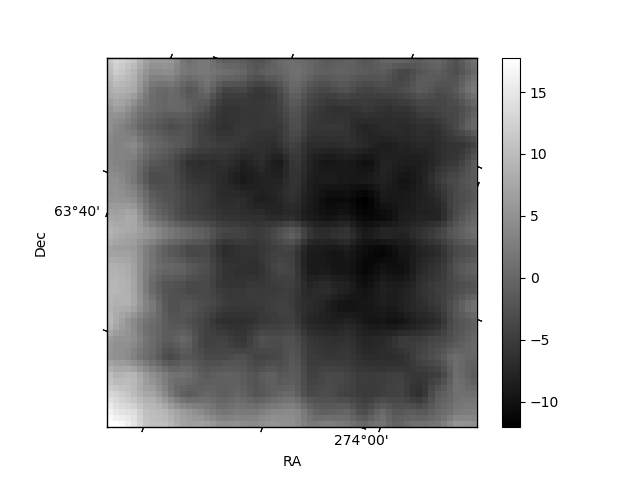
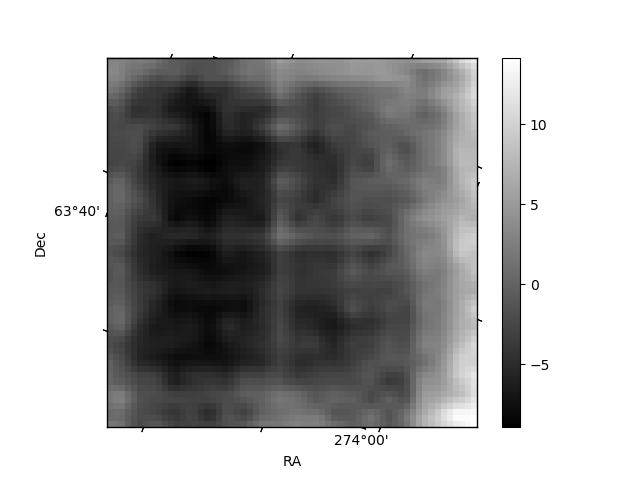
Histogram calculated using DETX and DETY for each event in the final _common_clean file
| Quadrant A | 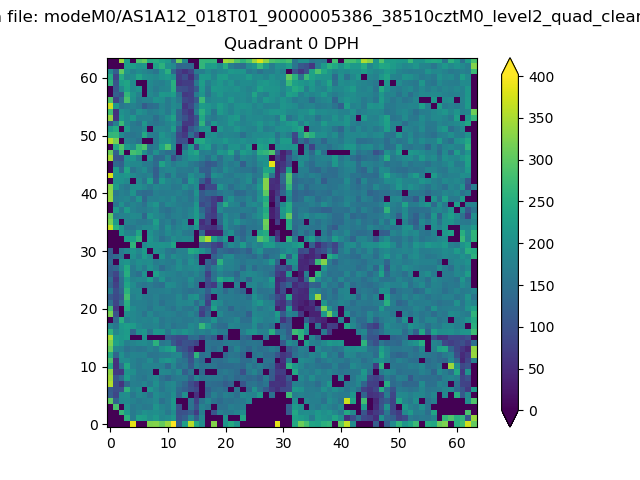 |
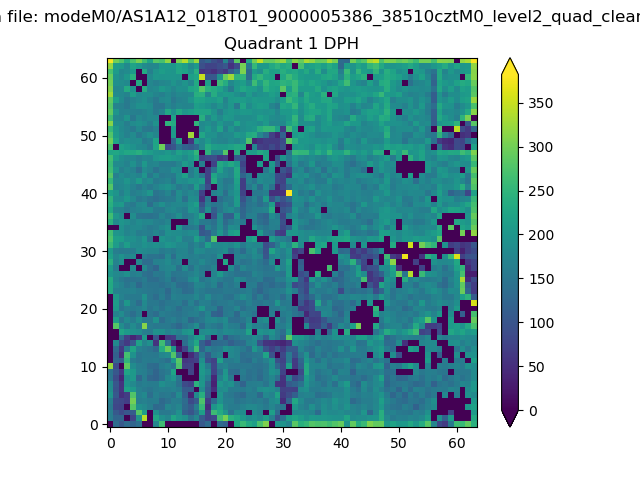 |
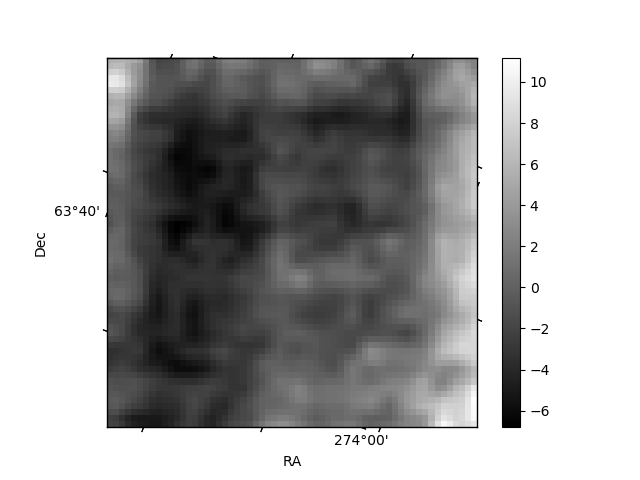
Quadrant B |
|---|---|---|---|
| Quadrant D | 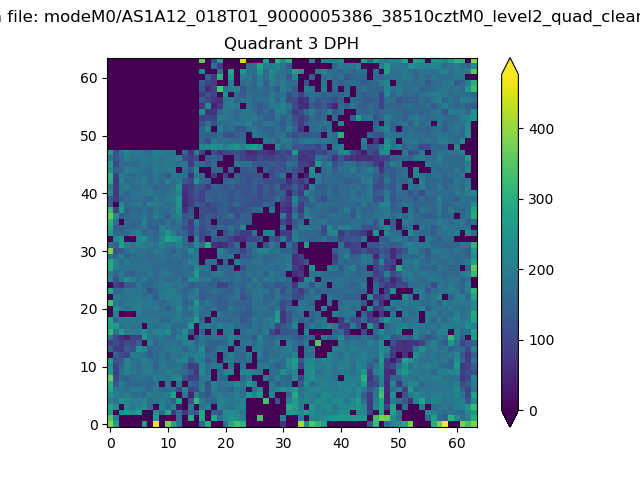 |
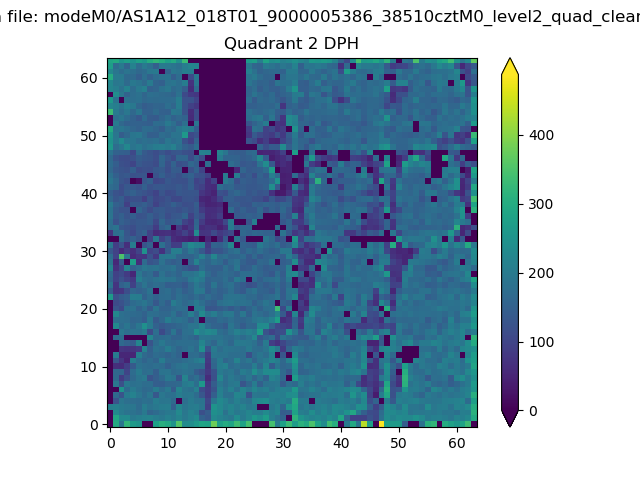 |
Quadrant C |
| Plot type | Count rate plots | Images |
|---|---|---|
| Comparison with Poisson distribution Blue bars denote a histogram of data divided into 1 sec bins. Red curve is a Poisson curve with rate = median count rate of data. |
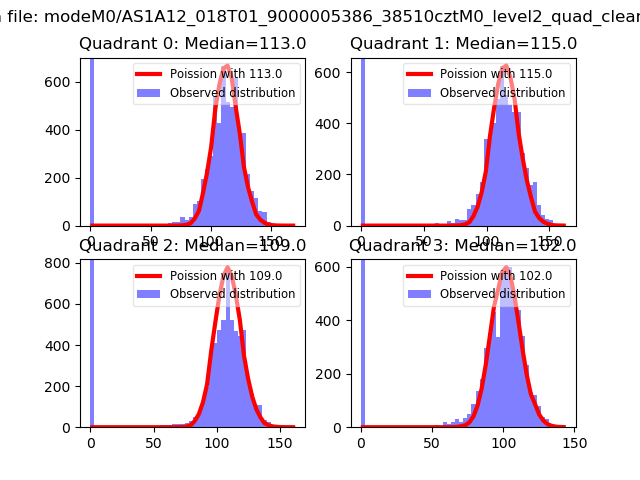 |
 |
| Quadrant-wise count rates Data is divided into 100 sec bins |
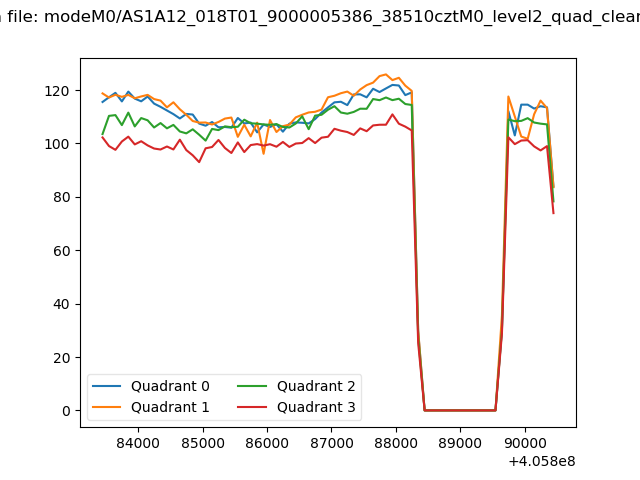 |
|
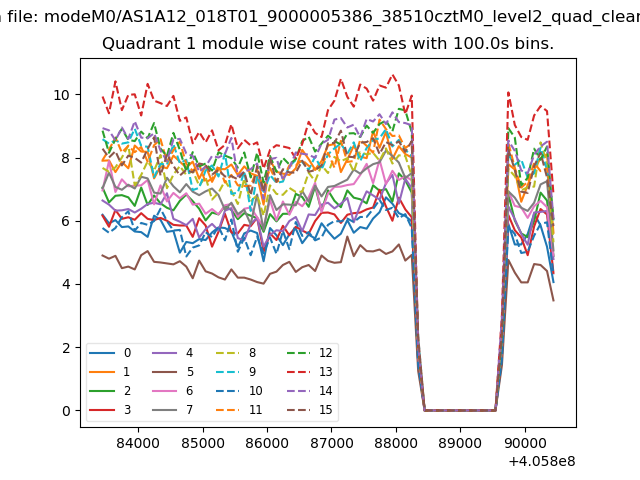
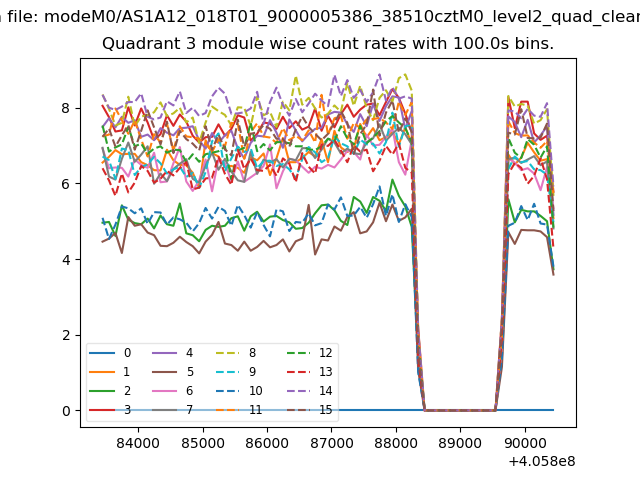
| Module-wise count rates for Quadrant A Data is divided into 100 sec bins |
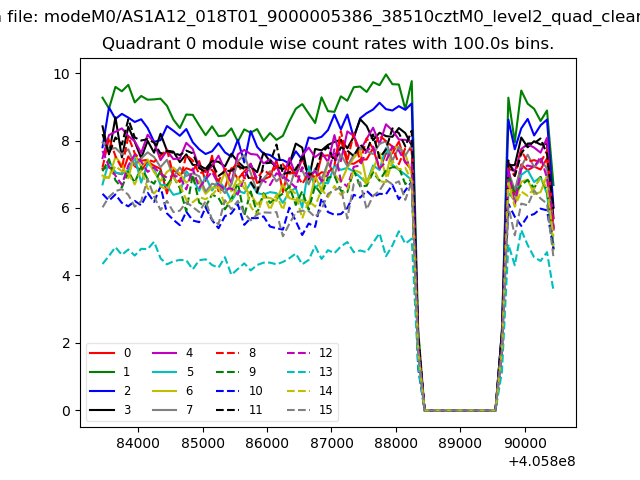 |
 |
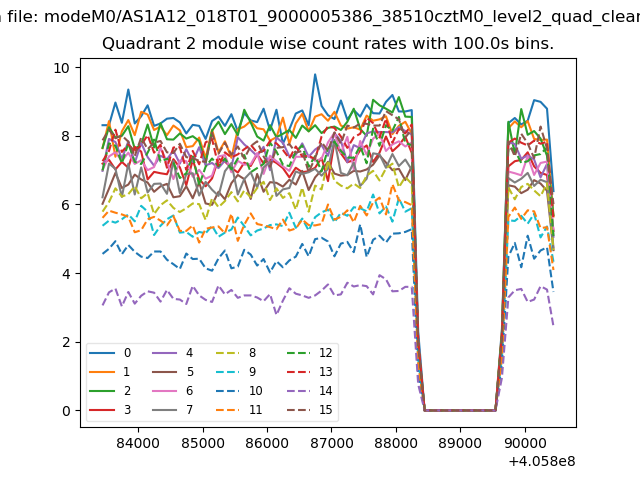
| Module-wise count rates for Quadrant B Data is divided into 100 sec bins |
 |
 |
| Module-wise count rates for Quadrant C Data is divided into 100 sec bins |
 |
 |
| Module-wise count rates for Quadrant D Data is divided into 100 sec bins |
 |
 |
| Parameter | Plot |
|---|---|
| CZT HV Monitor | 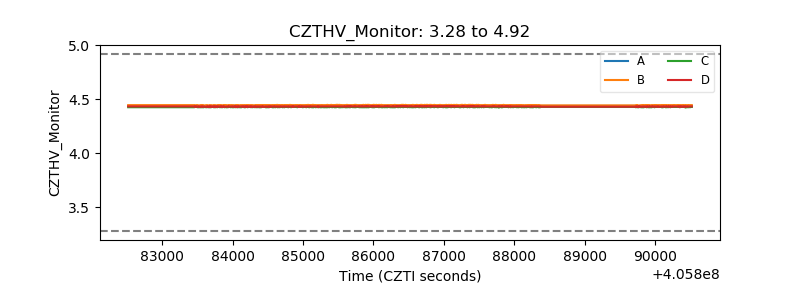 |
| D_VDD | 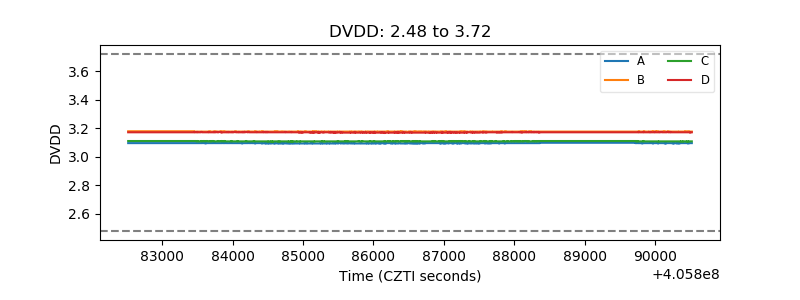 |
| Temperature 1 | 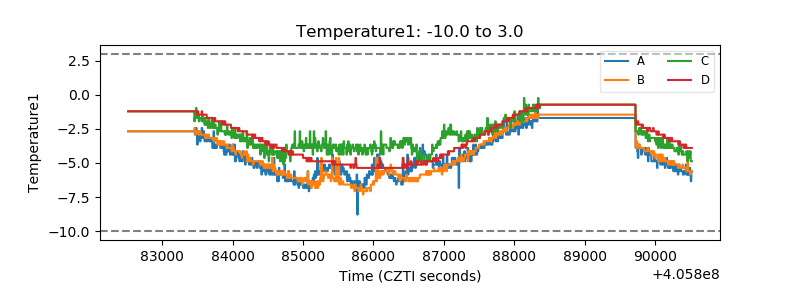 |
| Veto HV Monitor | 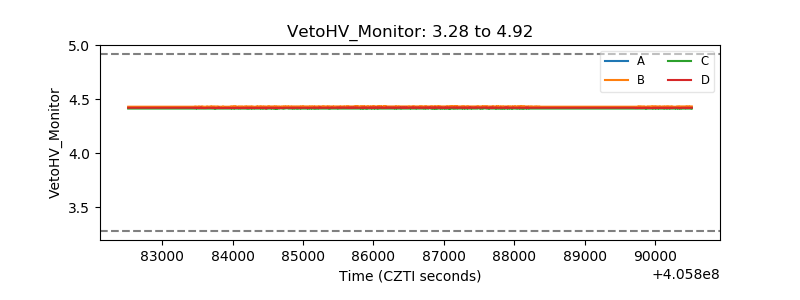 |
| Veto LLD | 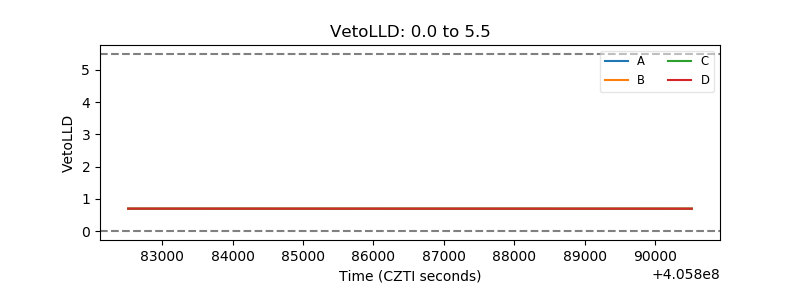 |
| Alpha Counter | 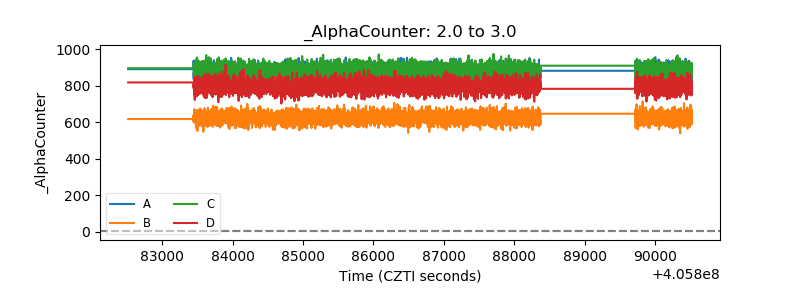 |
| _CPM_Rate | 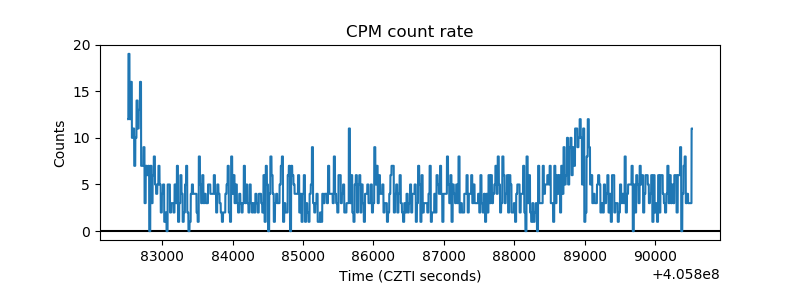 |
| CZT Counter | 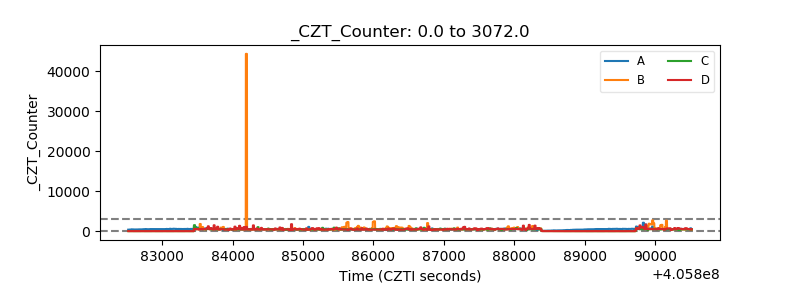 |
| +2.5 Volts monitor | 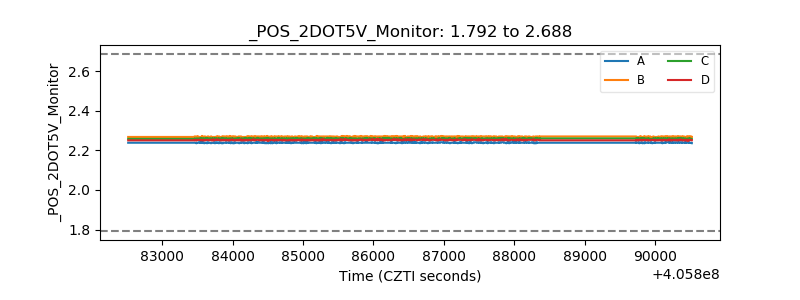 |
| +5 Volts monitor | 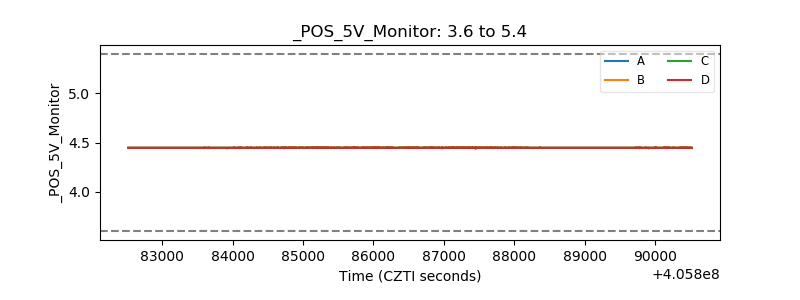 |
| _ROLL_ROT | 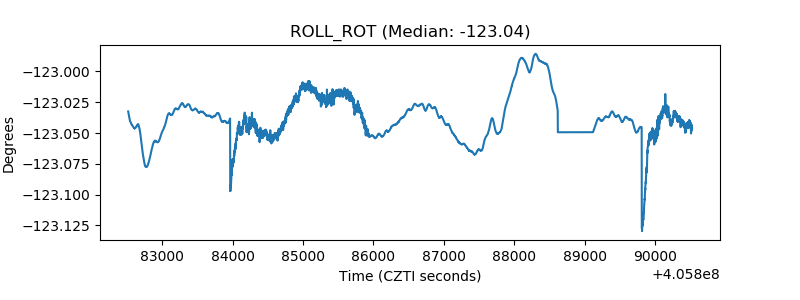 |
| _Roll_DEC | 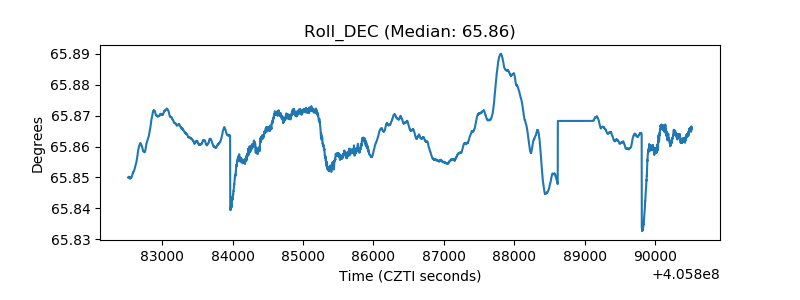 |
| _Roll_RA | 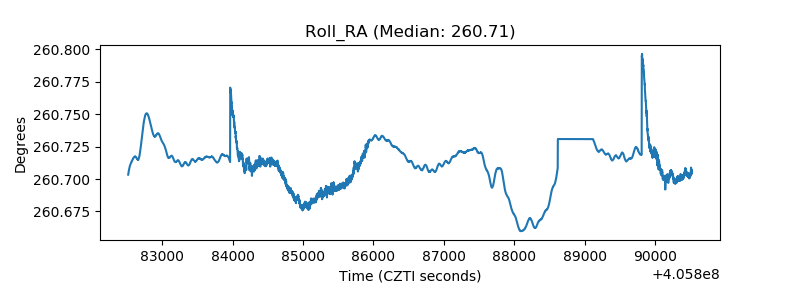 |
| Veto Counter | 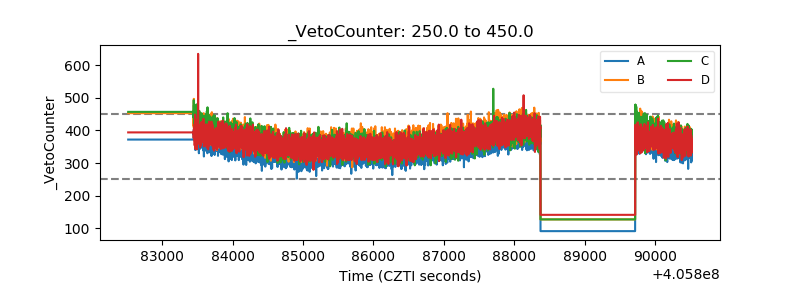 |