| Param | Original file | Final file |
|---|---|---|
| Filename | modeM0/AS1C07_001T02_9000005426_39017cztM0_level2.fits | modeM0/AS1C07_001T02_9000005426_39017cztM0_level2_quad_clean.evt |
| Size (bytes) | 181,229,760 | 46,785,600 |
| Size | 172.8 MB | 44.6 MB |
| Events in quadrant A | 2,110,156 | 311,916 |
| Events in quadrant B | 1,346,273 | 320,512 |
| Events in quadrant C | 1,343,657 | 307,171 |
| Events in quadrant D | 1,692,885 | 280,758 |
| Mode M0 | |||
|---|---|---|---|
| Quadrant | BADHDUFLAG | Total packets | Discarded packets |
| A | 0 | 8139 | 2 |
| B | 0 | 5804 | 1 |
| C | 0 | 5588 | 1 |
| D | 0 | 6970 | 1 |
| Mode M9 | |||
|---|---|---|---|
| Quadrant | BADHDUFLAG | Total packets | Discarded packets |
| A | 0 | 14 | 0 |
| B | 0 | 14 | 0 |
| C | 0 | 14 | 0 |
| D | 0 | 14 | 0 |
| Mode SS | |||
|---|---|---|---|
| Quadrant | BADHDUFLAG | Total packets | Discarded packets |
| A | 0 | 56 | 0 |
| B | 0 | 56 | 0 |
| C | 0 | 56 | 0 |
| D | 0 | 56 | 0 |
| Quadrant | Total seconds | Saturated seconds | Saturation percentage |
|---|---|---|---|
| A | 2746 | 78 | 2.840495% |
| B | 2746 | 24 | 0.873999% |
| C | 2746 | 1 | 0.036417% |
| D | 2746 | 79 | 2.876912% |
Noise dominated data is calculated using 1-second bins in cleaned event files. If a bin has >2000 counts, and if more than 50% of those come from <1% of pixels, then it is considered to be noise-dominated and hence unusable.
| Quadrant | # 1 sec bins | Bins with >0 counts | Bins with >2000 counts | High rate bins dominated by noise | Noise dominated (total time) | Noise dominated (detector-on time) | Marked lightcurve |
|---|---|---|---|---|---|---|---|
| A | 4089 | 2747 | 38 | 38 | 0.93% | 1.38% | 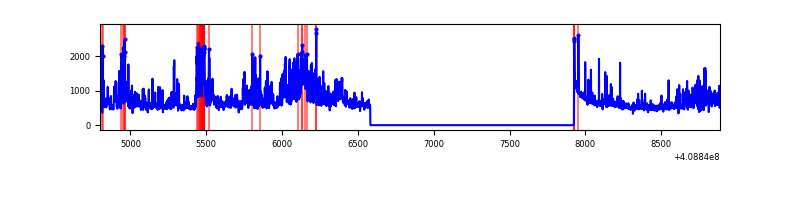 |
| B | 4089 | 2746 | 9 | 9 | 0.22% | 0.33% | 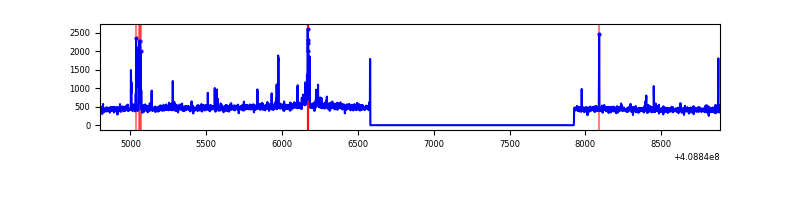 |
| C | 4089 | 2747 | 0 | 0 | 0.00% | 0.00% | 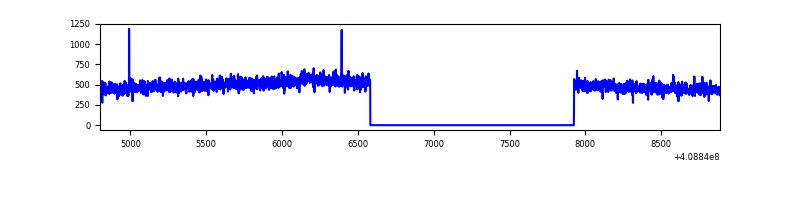 |
| D | 4088 | 2746 | 64 | 64 | 1.57% | 2.33% | 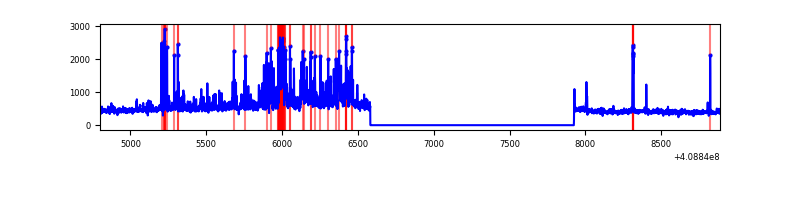 |
Top three noisy pixels from each quadrant. If the there are fewer than three noisy pixels in the level2.evt file, extra rows are filled as -1
| Pixel properties | Quadrant properties | ||||||
|---|---|---|---|---|---|---|---|
| Quadrant | DetID | PixID | Counts | Sigma | Mean | Median | Sigma |
| A | 6 | 10 | 304288 | 4655.99 | 316 | 309 | 65.3 |
| A | 12 | 16 | 248350 | 3799.2 | 316 | 309 | 65.3 |
| A | 10 | 83 | 217259 | 3322.98 | 316 | 309 | 65.3 |
| B | 5 | 172 | 46309 | 736.12 | 314 | 306 | 62.5 |
| B | 15 | 85 | 46258 | 735.3 | 314 | 306 | 62.5 |
| B | 0 | 230 | 10542 | 163.79 | 314 | 306 | 62.5 |
| C | 15 | 214 | 116631 | 1548.53 | 312 | 313 | 75.1 |
| C | 1 | 128 | 4040 | 49.62 | 312 | 313 | 75.1 |
| C | 13 | 61 | 1960 | 21.93 | 312 | 313 | 75.1 |
| D | 2 | 249 | 155364 | 2018.46 | 311 | 301 | 76.8 |
| D | 12 | 227 | 92908 | 1205.47 | 311 | 301 | 76.8 |
| D | 12 | 233 | 77419 | 1003.85 | 311 | 301 | 76.8 |
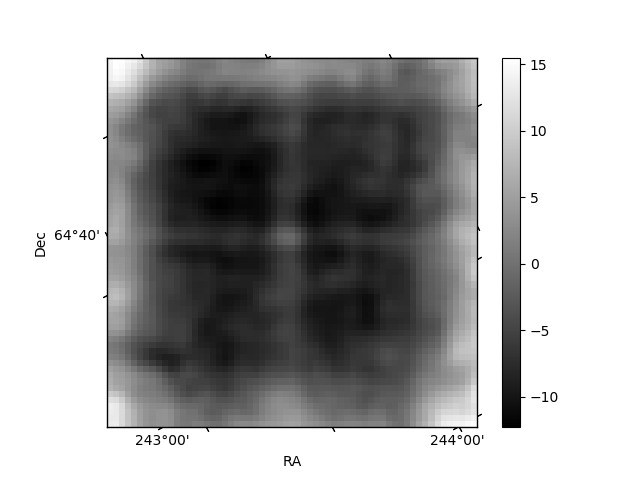
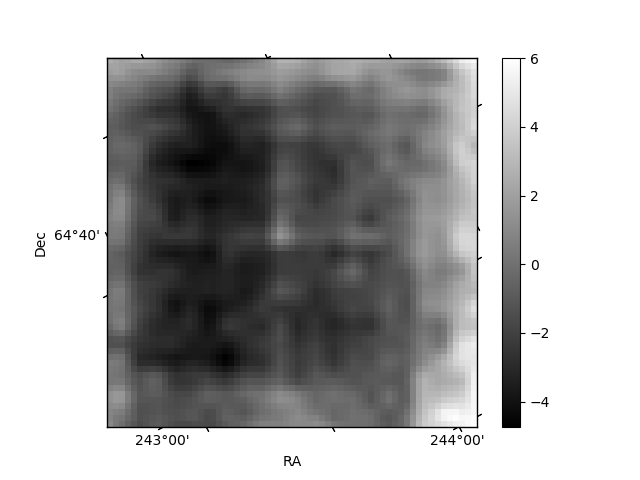
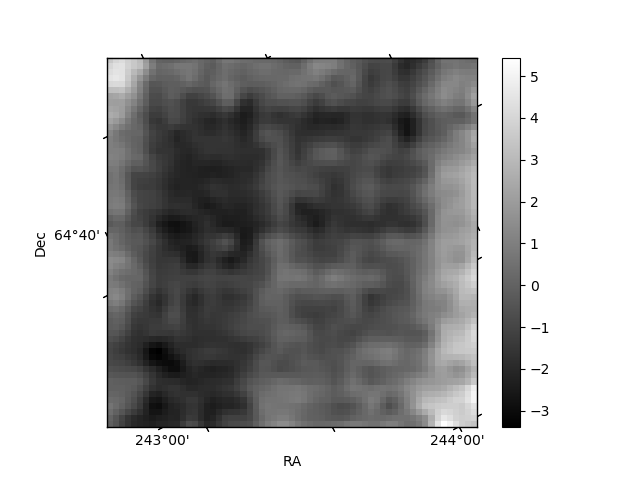
Histogram calculated using DETX and DETY for each event in the final _common_clean file
| Quadrant A | 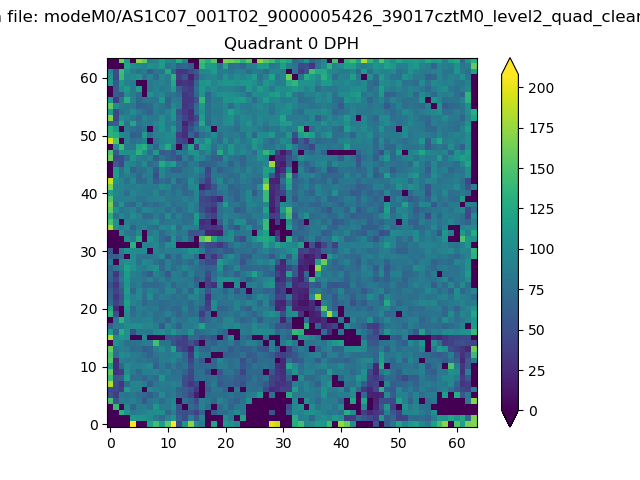 |
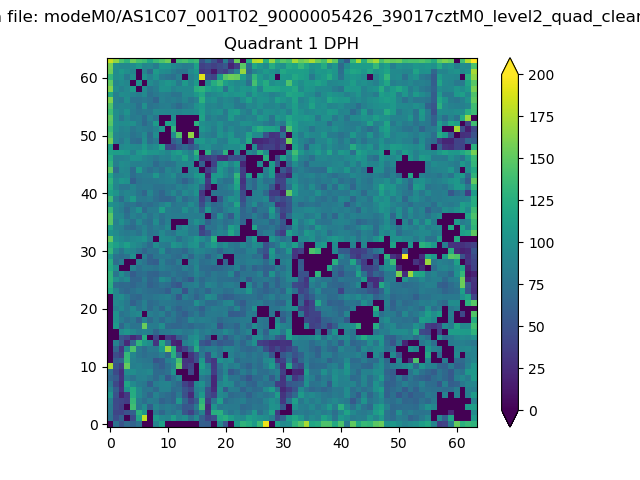 |
Quadrant B |
|---|---|---|---|
| Quadrant D | 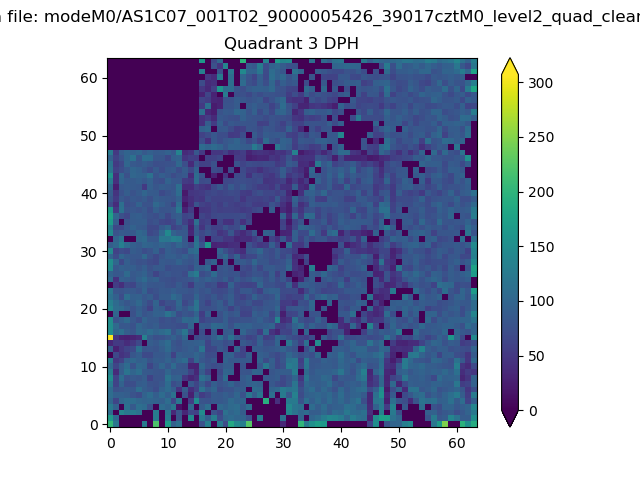 |
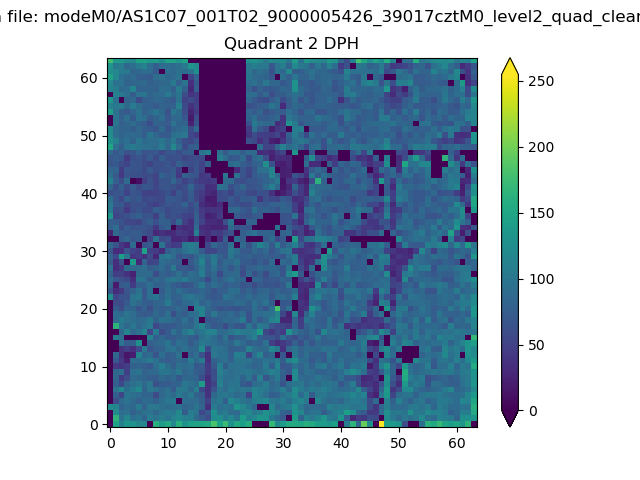 |
Quadrant C |
| Plot type | Count rate plots | Images |
|---|---|---|
| Comparison with Poisson distribution Blue bars denote a histogram of data divided into 1 sec bins. Red curve is a Poisson curve with rate = median count rate of data. |
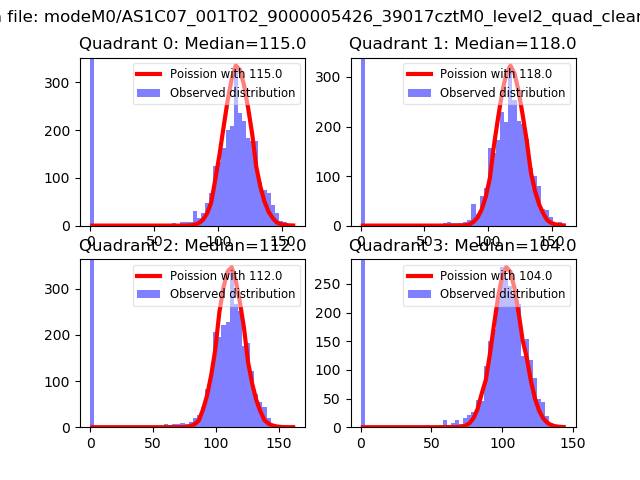 |
 |
| Quadrant-wise count rates Data is divided into 100 sec bins |
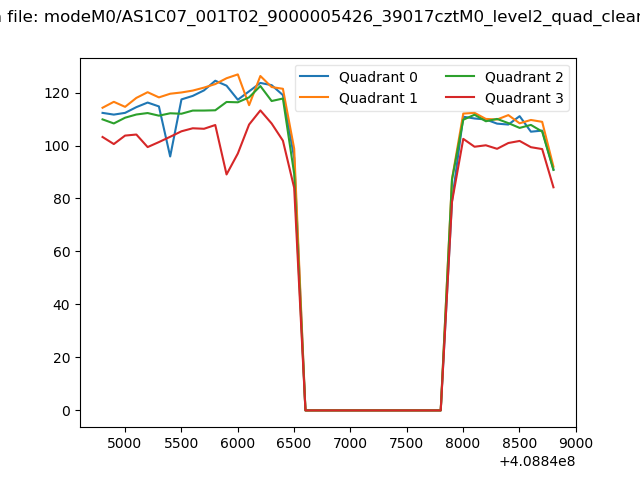 |
|
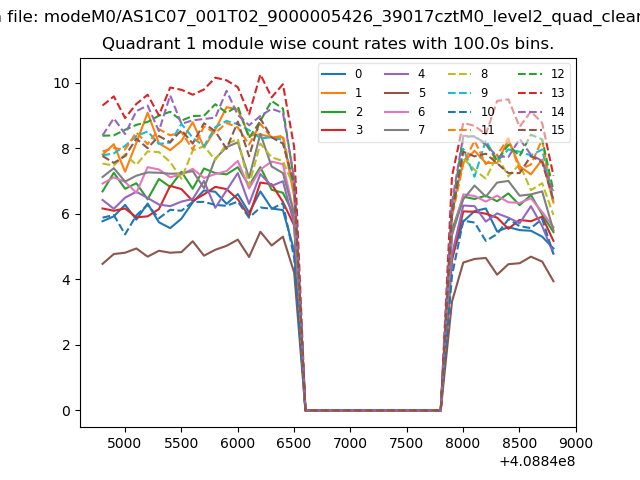
| Module-wise count rates for Quadrant A Data is divided into 100 sec bins |
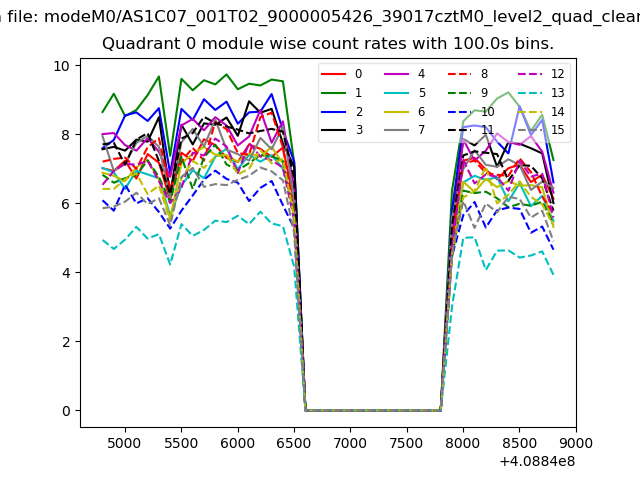 |
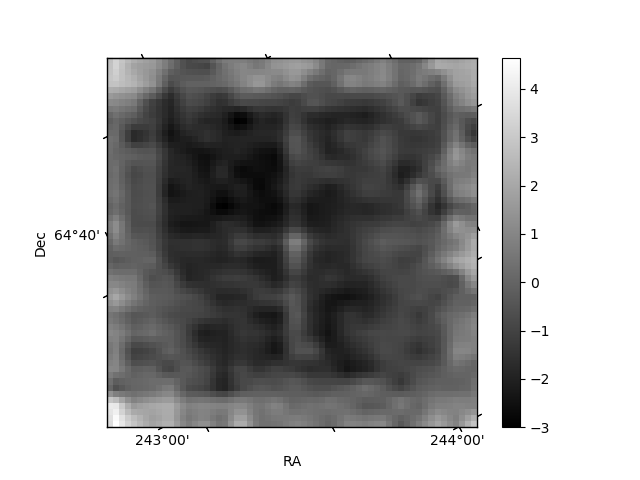 |
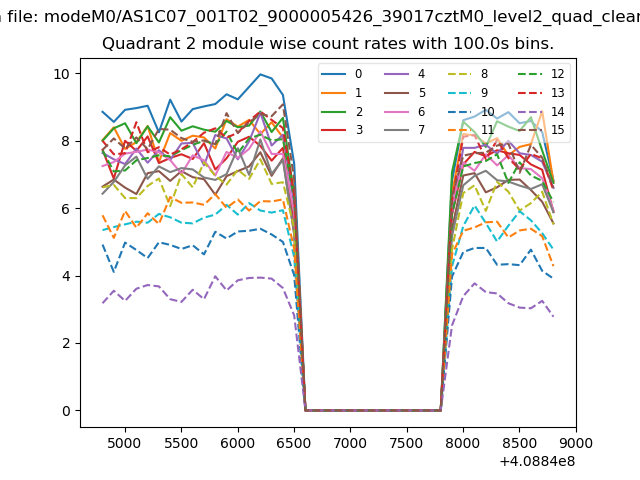
| Module-wise count rates for Quadrant B Data is divided into 100 sec bins |
 |
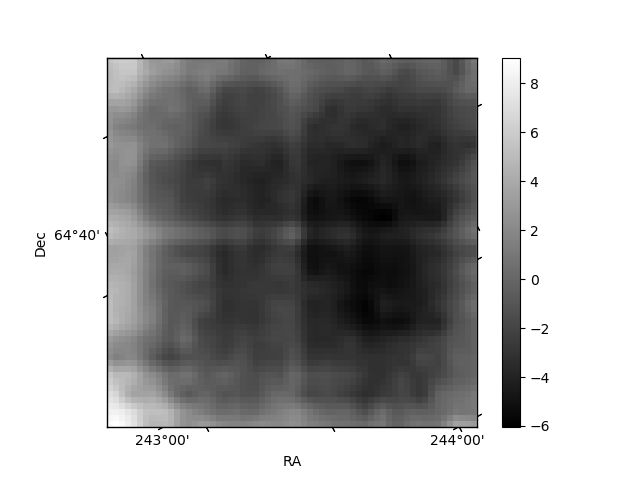 |
| Module-wise count rates for Quadrant C Data is divided into 100 sec bins |
 |
 |
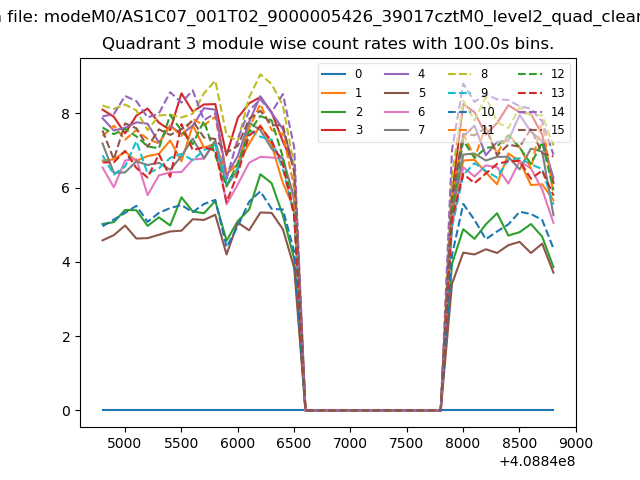
| Module-wise count rates for Quadrant D Data is divided into 100 sec bins |
 |
 |
| Parameter | Plot |
|---|---|
| CZT HV Monitor | 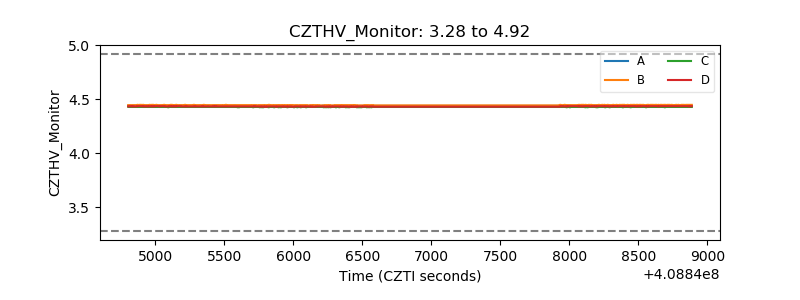 |
| D_VDD | 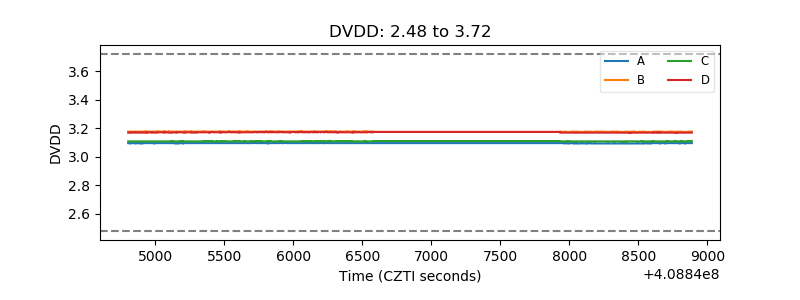 |
| Temperature 1 | 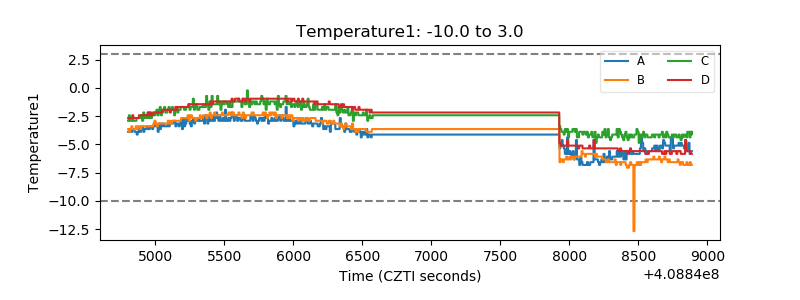 |
| Veto HV Monitor | 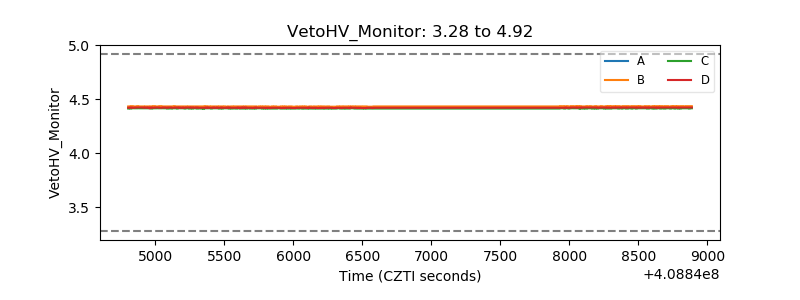 |
| Veto LLD | 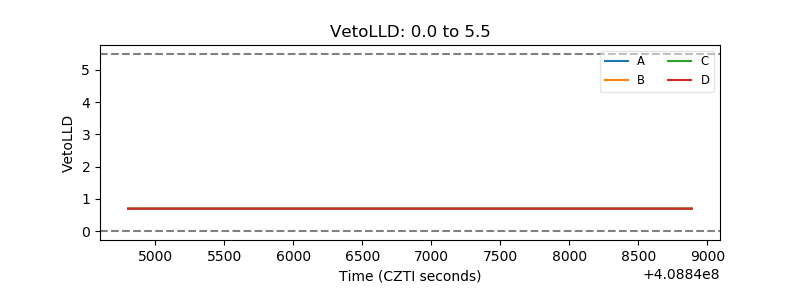 |
| Alpha Counter | 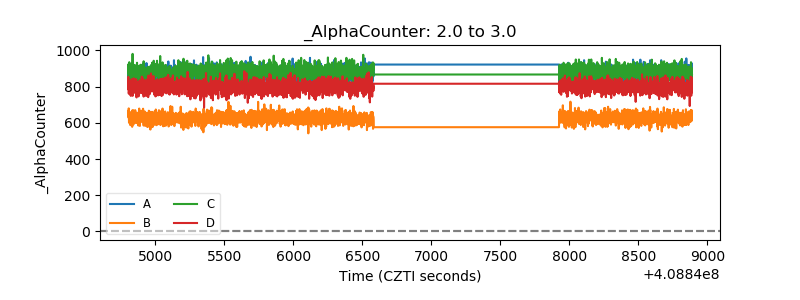 |
| _CPM_Rate | 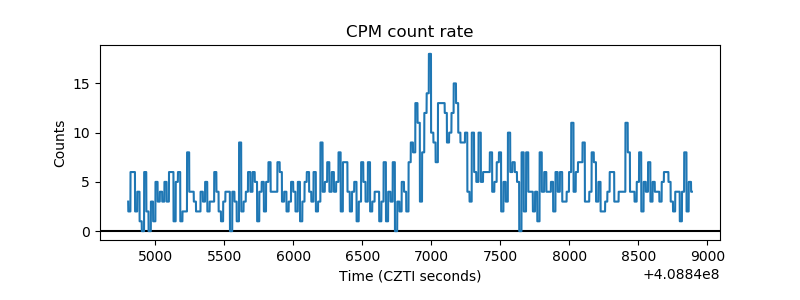 |
| CZT Counter | 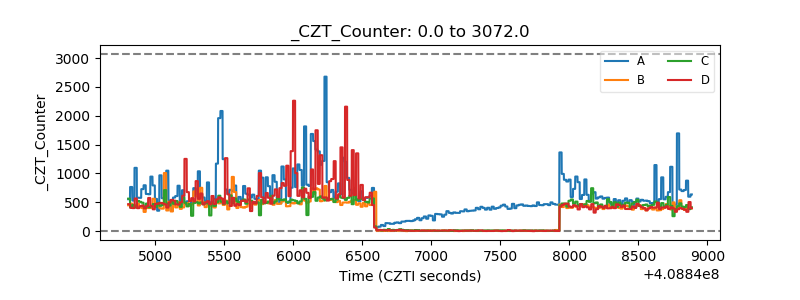 |
| +2.5 Volts monitor | 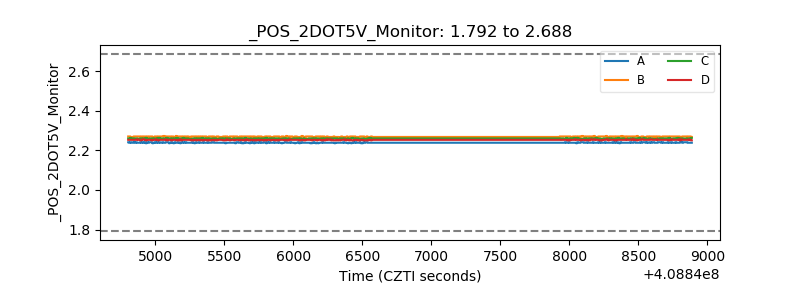 |
| +5 Volts monitor | 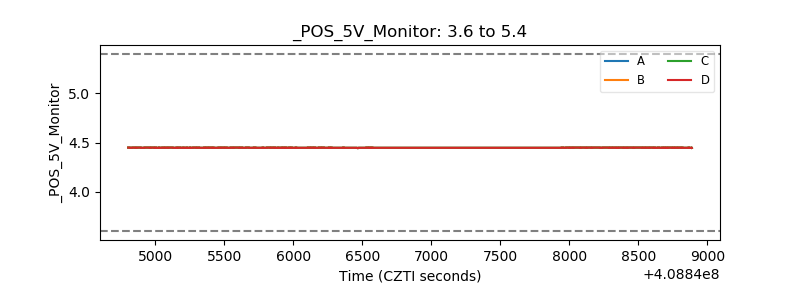 |
| _ROLL_ROT | 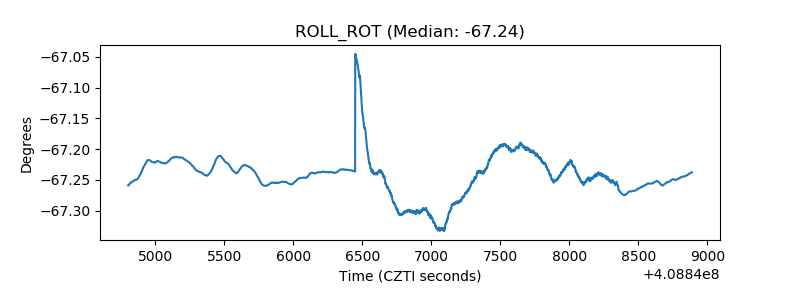 |
| _Roll_DEC | 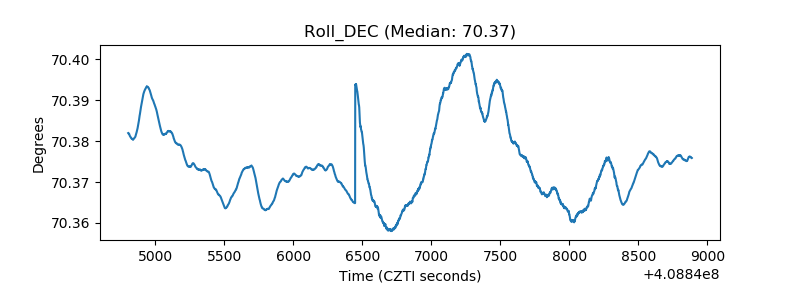 |
| _Roll_RA | 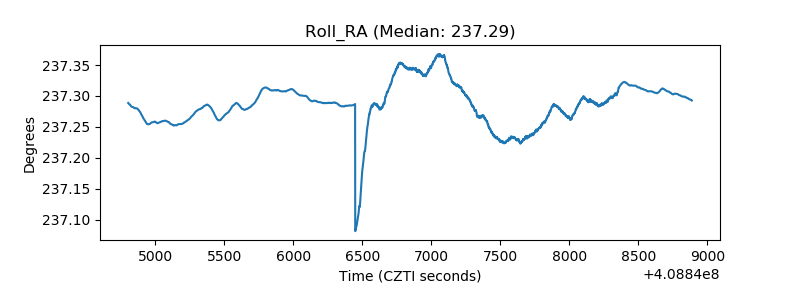 |
| Veto Counter | 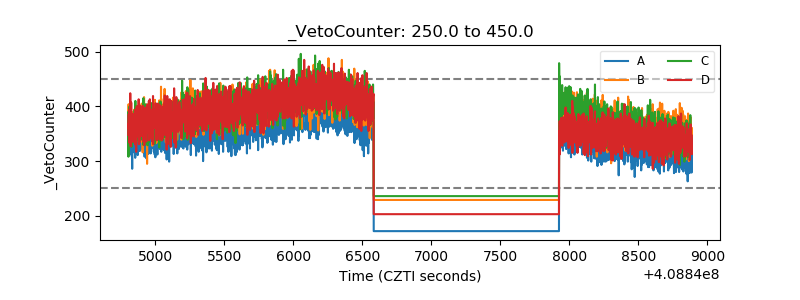 |